. 2024 Mar 27;12:RP91507. doi: 10.7554/eLife.91507

Figure 3. Binding of R-state inhibitors reveals allosteric coupling between the active site and the activation loop.

(A–C) Summary of hydrogen-deuterium exchange (HDX) experiments indicating regions that change in deuterium uptake upon binding of (A) BVD523, (B) Vertex-11e (VTX11e), and (C) GDC0994. (D–F) HDX time courses showing effects of inhibitors on deuterium uptake at the (D) DFG motif (peptide 161–168: LKICDFGL), (E) P+1 segment (peptide 191–198, YRAPEIML), and (F) helix αF (peptide 203–210: YTKSIDIW). Colored segments in panels A–C indicate regions where HDX decreases or increases upon binding each inhibitor at saturating concentration ([ERK2]:[inhibitor]=1.0:1.2). Full peptide coverage and locations of segments that undergo changes in HDX with inhibitor binding are shown in Figure 3—figure supplement 1 and Figure 3—figure supplement 2. Highlighted in light green in panels A–C are regions where a similar degree of HDX protection is seen with all inhibitors in both 0P-ERK2 and 2P-ERK2 (Gly loop, hinge, helices αC, αE, and αL16). HDX protection is similar with all inhibitors in strands β7-β8 (dark green) in 2P-ERK2, but not 0P-ERK2. Time courses for these peptides are shown in Figure 3—figure supplement 3. Highlighted in light blue are regions where BVD523, VTX11e, or GDC0994 lead to decreased HDX uptake around the DFG motif, in 0P-ERK2 or 2P-ERK2. Highlighted in dark blue are regions where BVD523 and VTX11e lead to increased HDX protection, compared to GDC0994. These occur only in 2P-ERK2, and include the DFG motif and adjacent strand β9, as well as the P+1 segment and helix αF. Time courses for strand β9 are shown in Figure 3—figure supplement 4. Full HDX datasets for all inhibitors are presented in Figure 1. Crystal structures shown in panels A–C are (A) PDBID: 6GDQ (left) and 2ERK (right); (B) PDBID: 4QTE (left) and 6OPK (right); (C) PDBID: 5K4I (left); and 6OPH (right).

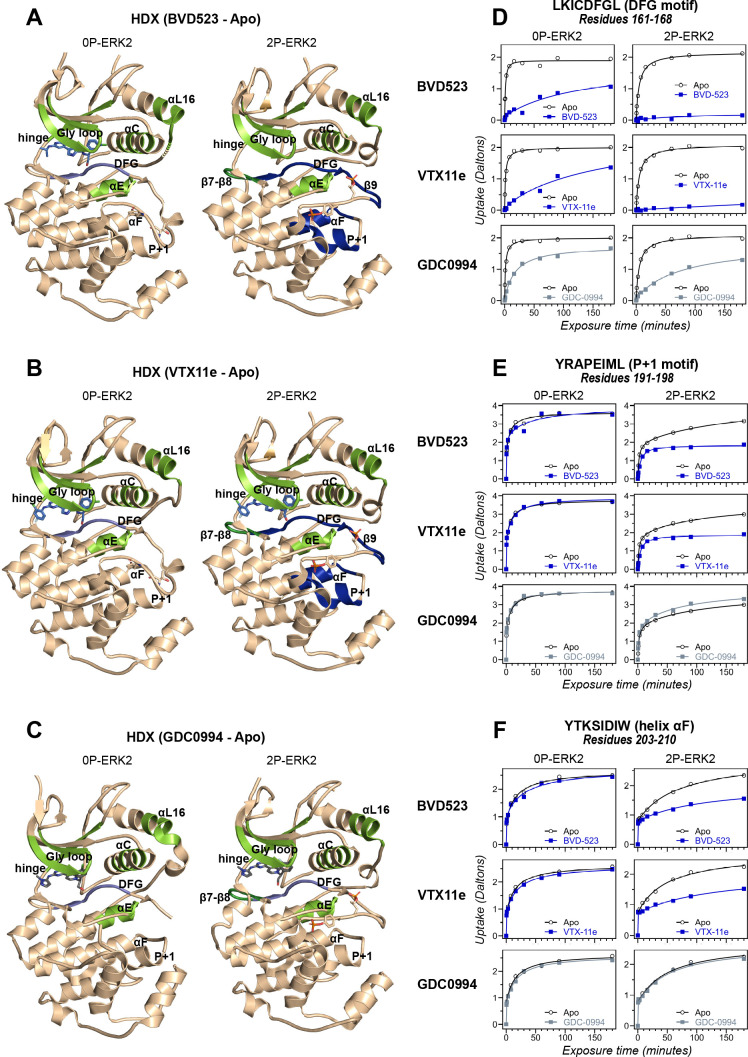
Figure 3.

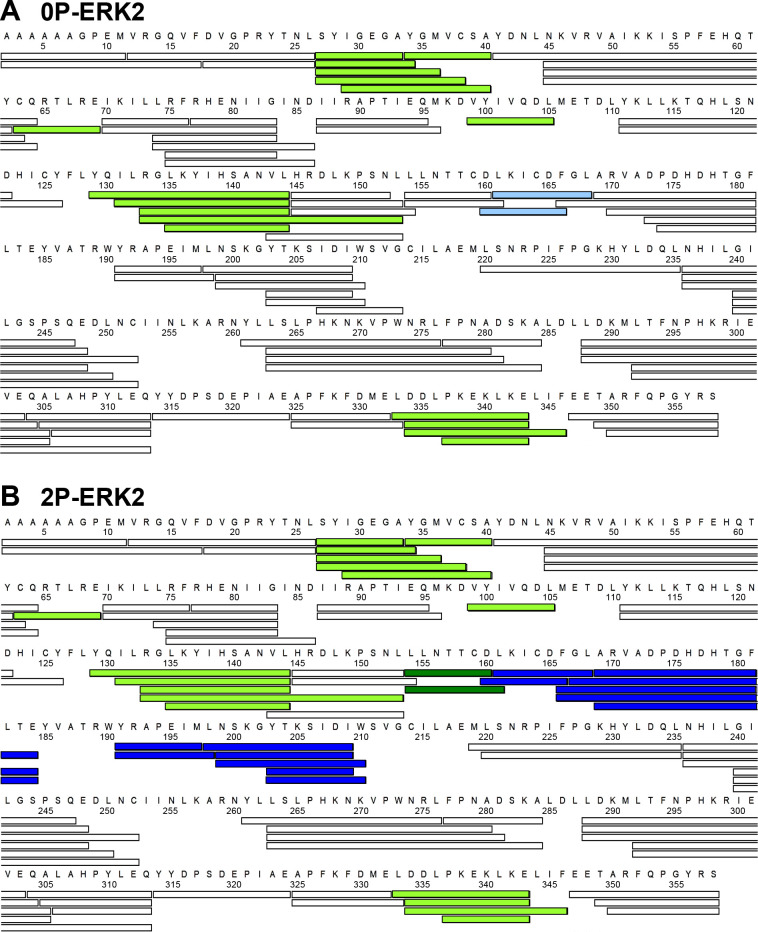
Figure 3—figure supplement 1. Proteolytic peptides analyzed by hydrogen-deuterium exchange mass spectrometry (HDX-MS).

Figure 3—figure supplement 1.

Peptides produced by pepsin digestion yielded 90% and 91% coverage of exchangeable amides in (A) 0P-ERK2 and (B) 2P-ERK2, respectively. Colors indicate regions where ligand binding alters HDX uptake. Light green indicates peptides where binding of Vertex-11e (VTX11e), BVD523, and GDC0994 induce a similar degree of HDX protection (i.e. decreased deuterium uptake) in both 0P-ERK2 and 2P-ERK2. Deep green indicates peptides where all inhibitors induce a similar degree of HDX protection, but only in 2P-ERK2. Deep blue indicates peptides where VTX11e and BVD523 induce greater HDX protection compared to GDC0994 in 2P-ERK2. Light blue indicates peptides that show HDX protection by all inhibitors around the DFG motif in 0P-ERK2, but to a lower amount compared to BVD523 or VTX11e in 2P-ERK2.
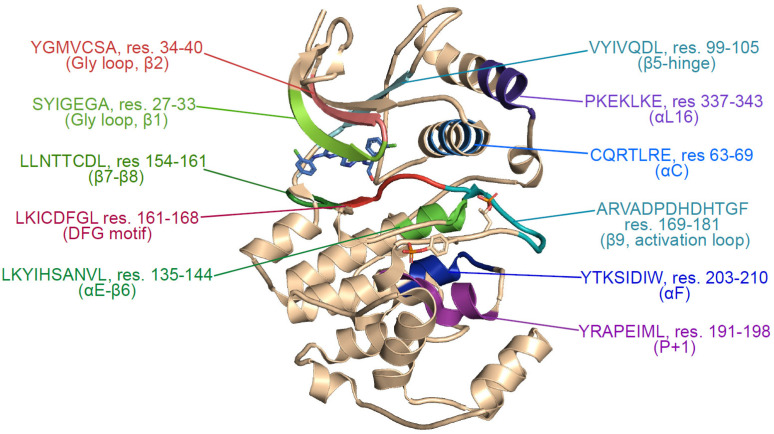
Figure 3—figure supplement 2. Structural map of regions showing hydrogen-deuterium exchange (HDX) responses to inhibitor binding.

Figure 3—figure supplement 2.

Structure of 2P-ERK2 (PDBID:6OPK), indicating the locations of peptides where binding of Vertex-11e (VTX11e), BVD523, or GDC0994 alter HDX behavior, as highlighted in Figure 3—figure supplement 1.
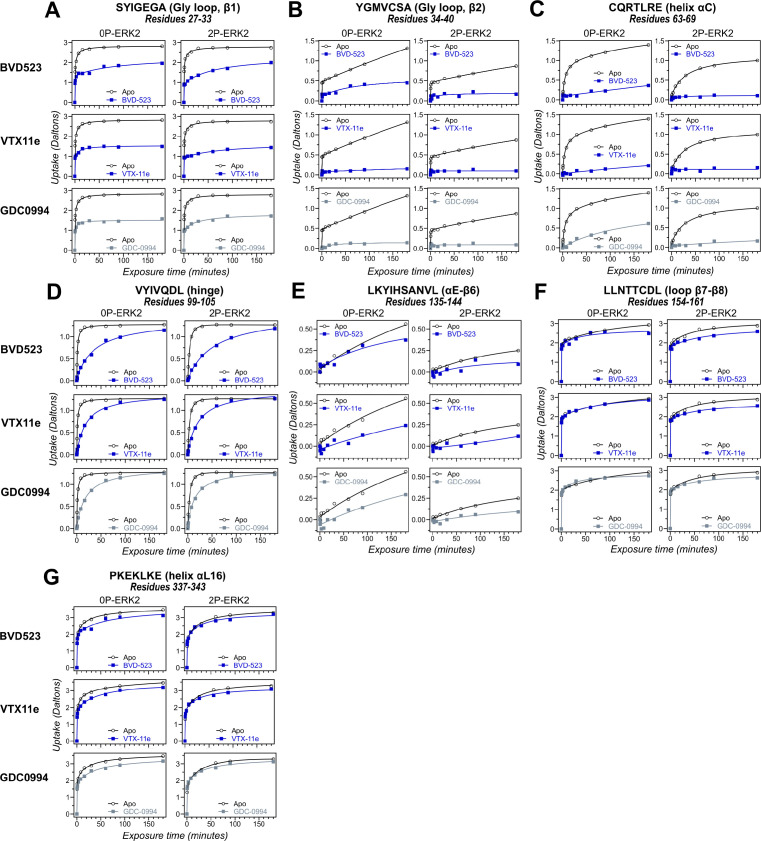
Figure 3—figure supplement 3. Hydrogen-deuterium exchange (HDX) time courses of regions with comparable responses to different inhibitors.

Figure 3—figure supplement 3.

HDX time courses for key peptide segments in extracellular signal-regulated kinase-2 (ERK2), including (A, B) the Gly loop (peptide 29–33, SYIGEGA; peptide 34–40, YGMVCSA), (C) helix αC (peptide 63–69, CQRTLRE), (D) the hinge (peptide 99–105, VYIVQDL), (E) helix αE-β6 (peptide 135–144, LKYIHSANVL), (F) loop β7-β8 (peptide 154–161, LLNTTCDL), and (G) helix αL16 (peptide 337–343, PKEKLKE). Open symbols show deuterium uptake in 0P- or 2P-ERK2 apoenzymes. Closed symbols show deuterium uptake in 0P- or 2P-ERK2 complexed with BVD523, VTX11e (blue), or GDC0994 (gray). In these regions, deuterium uptake decreases by a similar degree upon binding each of the three inhibitors.
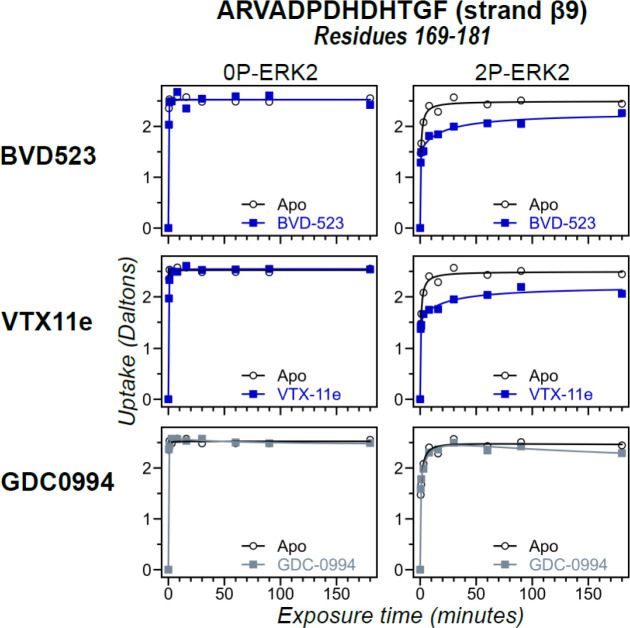
Figure 3—figure supplement 4. Hydrogen-deuterium exchange (HDX) time courses with differential responses to inhibitor binding.

Figure 3—figure supplement 4.

HDX time courses for strand β9 (peptide 169–181, ARVADPDHDHTGF) located adjacent to the DFG motif. Open symbols show deuterium uptake in 0P- or 2P-ERK2 apoenzymes. Closed symbols show deuterium uptake in 0P- or 2P-ERK2 complexed with BVD523, Vertex-11e (VTX11e) or GDC0994. Deuterium uptake in these regions decreases by a larger degree upon binding VTX11e or BVD523 (blue) compared to GDC0994 (gray), as also seen in the DFG motif, P+1, and helix αF (Figure 3).