

Abstract
Purpose:
Considering the conceptual migration from vocal load and vocal loading to vocal demand and vocal demand response, this review of literature aims to identify physiological explanations, reported measurements, and associated factors (vocal demands) reported in the literature when considering the phonatory response to a vocal demand.
Methods:
A systematic review of literature, following the PRISMA Statement, was conducted using Web of Science, PubMed, Scopus, and Science Direct. Data were analyzed and presented in two parts. First, a bibliometric analysis, co-occurrence analysis, and content analysis were performed. Three criteria got article inclusion were defined: (1) written in English, Spanish, and Portuguese, (2) published between 2009 and 2021, and (3) focused on vocal load and loading, vocal demand response, and voice assessment parameters. A total of 54 publications met the criteria and were included in this review. The second part included a conceptual framework based on the content analysis of three aspects of vocal demand response: (1) physiological explanations, (2) reported measurements, and (3) vocal demands.
Results and Conclusion:
As would be expected since vocal demand response is a relatively new term and not yet commonly used in literature when discussing way that the speakers respond to communicative scenarios, most of the studies reviewed (both historical and recent) still use the term of vocal load and vocal loading. Although there is a broad variety of literature discussing a wide range of vocal demands and voice parameters used to characterize the vocal demand response, results show that there is consistency across the studies. While vocal demand response is unique and intrinsic to the talker, associated factors that contribute to this response include both internal talker and external talker factors. Internal factors include muscle stiffness, viscosity in the phonatory system, vocal fold tissue damage, elevated sound pressure levels during occupational voice demands, extended periods of voice use, sub-optimal body posture, difficulties in breathing technique, and sleep disturbances. Associated external factors include the working environment (noise, acoustics, temperature, humidity). In conclusion, although vocal demand response is intrinsic to the speaker, the speaker’s response is affected by external vocal demands. However, due to the wide methods to evaluate vocal demand response, it has been difficult to establish its contribution to voice disorders in the general population, and specifically, among occupational voice users. This literature review identified commonly reported parameters and factors that may help clinicians and researchers to define vocal demand response.
Keywords: vocal load, vocal demand response, voice
Introduction
Voice is not only an interaction tool fundamental to oral communication, but it is also a working tool for occupational voice users who rely on their voices to perform their jobs(1). To better understand the difference between healthy and unhealthy voice use, it is important to understand voice production (phonation driven from airflow), as well as the context of multiple contributing internal and external factors which impact the production. In other words, voice production must be understood as more than just vibrating vocal folds in isolation but include the external factors contributing to the situational communicative circumstances (vocal demands) leading to vocalization and the vocalist’s internal factors or capacities specifically contributing to vibrating vocal folds and radiated sound (vocal demand response). By considering voice use and related metrics within this larger context of vocal demand and vocal demand response, a framework (2) is created that clarifies contributing factors and reported parameters around vocal use, whether towards vocal training, prevention of voice disorders, or the tracking of improvement during treatment.
The literature highlights many internal factors and systems which contribute to an individual’s vocal demand response with a gamut of different measurements, instruments, and techniques, hampering a clear consensus on how to quantify the response to a vocal demand. For example, in a thoughtful and comprehensive recommendation for instrumental assessment of voice (3), there is no mention of patient-external vocal demands such as the requirement to vocalize in a loud room or for long periods of time (4,5) nor for quantifying internal patient factors such as pulmonary function6 or psychology (6,7). Also, reports have shown that patients with voice problems generally mention increased vocal effort, regardless of the underlying pathophysiology (8).
Further, there has been inconsistency in both how terms are used, and which factors are controlled for, particularly in the occupational voice demand literature. For example, while some researchers have narrowed the focus of vocal loading to the vocal demand of time (long periods of voice use) (4),(9), others have described it in terms of the vocal demand response such as elevated vocal pitch or intensity. Some studies have taken a wider perspective, often conflating both vocal load and vocal loading when describing it as a function of five factors: environmental noise, phonation time, phonation intensity, phonation pitch, and hyperfunctional or hyperkinetic dysfunctional adaptations (10). Further still, other studies have focused more on the physiological component of voice production, relating increased vocal load and vocal loading to an increased vocal fold vibration, muscle tension, and negative phonatory function (2).
This lack of consensus can be illustrated with the example of the well-known Lombard Effect where the extrinsic demand of a noisy communication environment is reflected by a demand response of increases in vocal loudness and to some extent by elevated vocal pitch; variability in this Lombard vocal demand response has been related to many other contributing factors such as vocal goal (11) and individual factors such as age (12). Yet in this example, there is not a clear consensus about which intrinsic individual factors to measure or control for or which types of assessments should be included to quantify these factors, which is particularly important in the occupational voice context (13). Part of the confusion was due to the lack of consensus on four commonly occurring concepts: vocal load, vocal loading, vocal effort, and vocal fatigue (2). Given the ambiguous, and sometimes even conflicting, uses of these terms in the literature a recent publication (2) proposed four new standardized definitions with examples, even replacing vocal load and vocal loading with two new terms to better clarify the difference between the noun and the verb. Therefore, proposing vocal demand (vocal requirements for a given communication scenario – external and independent of the speaker) and vocal demand response (the way that talkers respond to the communicative context during speaking and corresponding individual factors) (2). Within this context, vocal demand response (VDR) could be assessed through voice parameters, such as voice acoustic parameters (e.g., dB, fundamental frequency), vocal production quantities (e.g., subglottic pressure (14–16), maximum flow declination rate, nasalization) (17–19), physiological variables (e.g., lung volume (20), vocal fold length, lamina propria elasticity, hydration) (10,21–23), personality traits and psychophysiological quantities (e.g. grit, interception, congruence) (24,25), and some functional/behavioral elements (e.g., laryngeal hyperfunction, understood as the compression of the glottis and supraglottic structures during phonation (26)) (2); and characterized as the mechanical load on the tissue due to vocal fold vibration (2),(27),(4). Returning to the Lombard example above, the noisy communication environment and the goal to communicate is the vocal demand where the actual vocalization reflected with increases in vocal loudness and to some extent by elevated vocal pitch would be the vocal demand response; intrinsic factors to the individual, such as age, would be independent of the vocal demand.
Given both the new implementation of these terms and the lack of clarity in how vocal demand response is described as well as the lack of combined discussions of vocal demand response (acoustic output and individualized physiologic factors) within the context of a vocal demand (external goal of the production), there is a need to expand and clarify the knowledge related to vocal demand response (VDR), the parameters with which it can be quantified, and its associated factors (vocal demands). A necessary step is to attribute voice parameters and contributing factors previously studied and reported from the perspective of these new terms since this will lead to better utilization and can have implications on voice assessment, treatment, and training. Therefore, this study aims to identify the most reported physiological explanations, reported measurements, and associated factors (vocal demands) of vocal demand response through a systematic review of the literature.
Methods
The protocol review was registered and can be accessed in the Open Science Framework (OSF) Registries. The OSF Registries provide a centralized location for researchers to publicly share their research plans, including study designs, hypotheses, and methods. By registering our protocol, we hope to make our research more accessible to the scientific community and increase the rigor of our study.
Literature search
The search was conducted using four databases: (a) Web of Science, (b) PubMed, (c) Scopus, and (d) Science Direct. Inclusion criteria were defined as follows: (1) Language: Articles written in English and Portuguese, (2) time window: articles published between 2009 and 2021, and (3) topics: studies about vocal load, vocal demand response, and voice assessment parameters. Table 1 shows the search strings used in each database.
Table 1.
Search strings used per database
| Database | Search string |
|---|---|
|
| |
| Web of Science | [“Speech Production Measurement” OR “Diagnostic Techniques and Procedures” OR “Parameters”] AND [“Vocal Load” OR “Vocal Loading” OR “Vocal Demand” OR “Vocal Quality”] |
| PubMed | {“Speech Production Measurement” OR “Diagnostic Techniques and Procedures” OR “Parameters”] AND [“Vocal Load” OR “Vocal Loading” OR “Vocal Demand” OR “Vocal Quality”] |
| Scopus | “Parameters” AND [“Vocal Load” OR “Vocal Loading” OR “Vocal Demand” OR “Use of Voice” OR “Vocal Quality”] |
| Science direct | [“Speech Production Measurement” OR “Diagnostic Techniques and Procedures” OR “Parameters”] AND [“Vocal Load” OR Vocal Loading” OR “Vocal Demand” OR “Vocal Quality”] |
Selection of publications
Figure 1 shows the PRISMA Statement flow diagram. The identification stage was conducted by the first author, resulting in the retrieval of 1,409 articles. After removing duplicates, a total of 968 titles were included in the analysis. The screening, eligibility, and inclusion stages were independently conducted by the first and second authors of the study. During the screening stage, 841 titles and abstracts were excluded because they did not meet the inclusion criteria (vocal load, vocal demand response, or vocal assessment parameters). During the eligibility stage, 71 manuscripts were excluded because they did not mention factors related to vocal load or vocal demand response, or they did not mention assessment parameters associated with vocal load in their methodology. In the end, 54 manuscripts were included in this systematic review of the literature.
Figure 1.
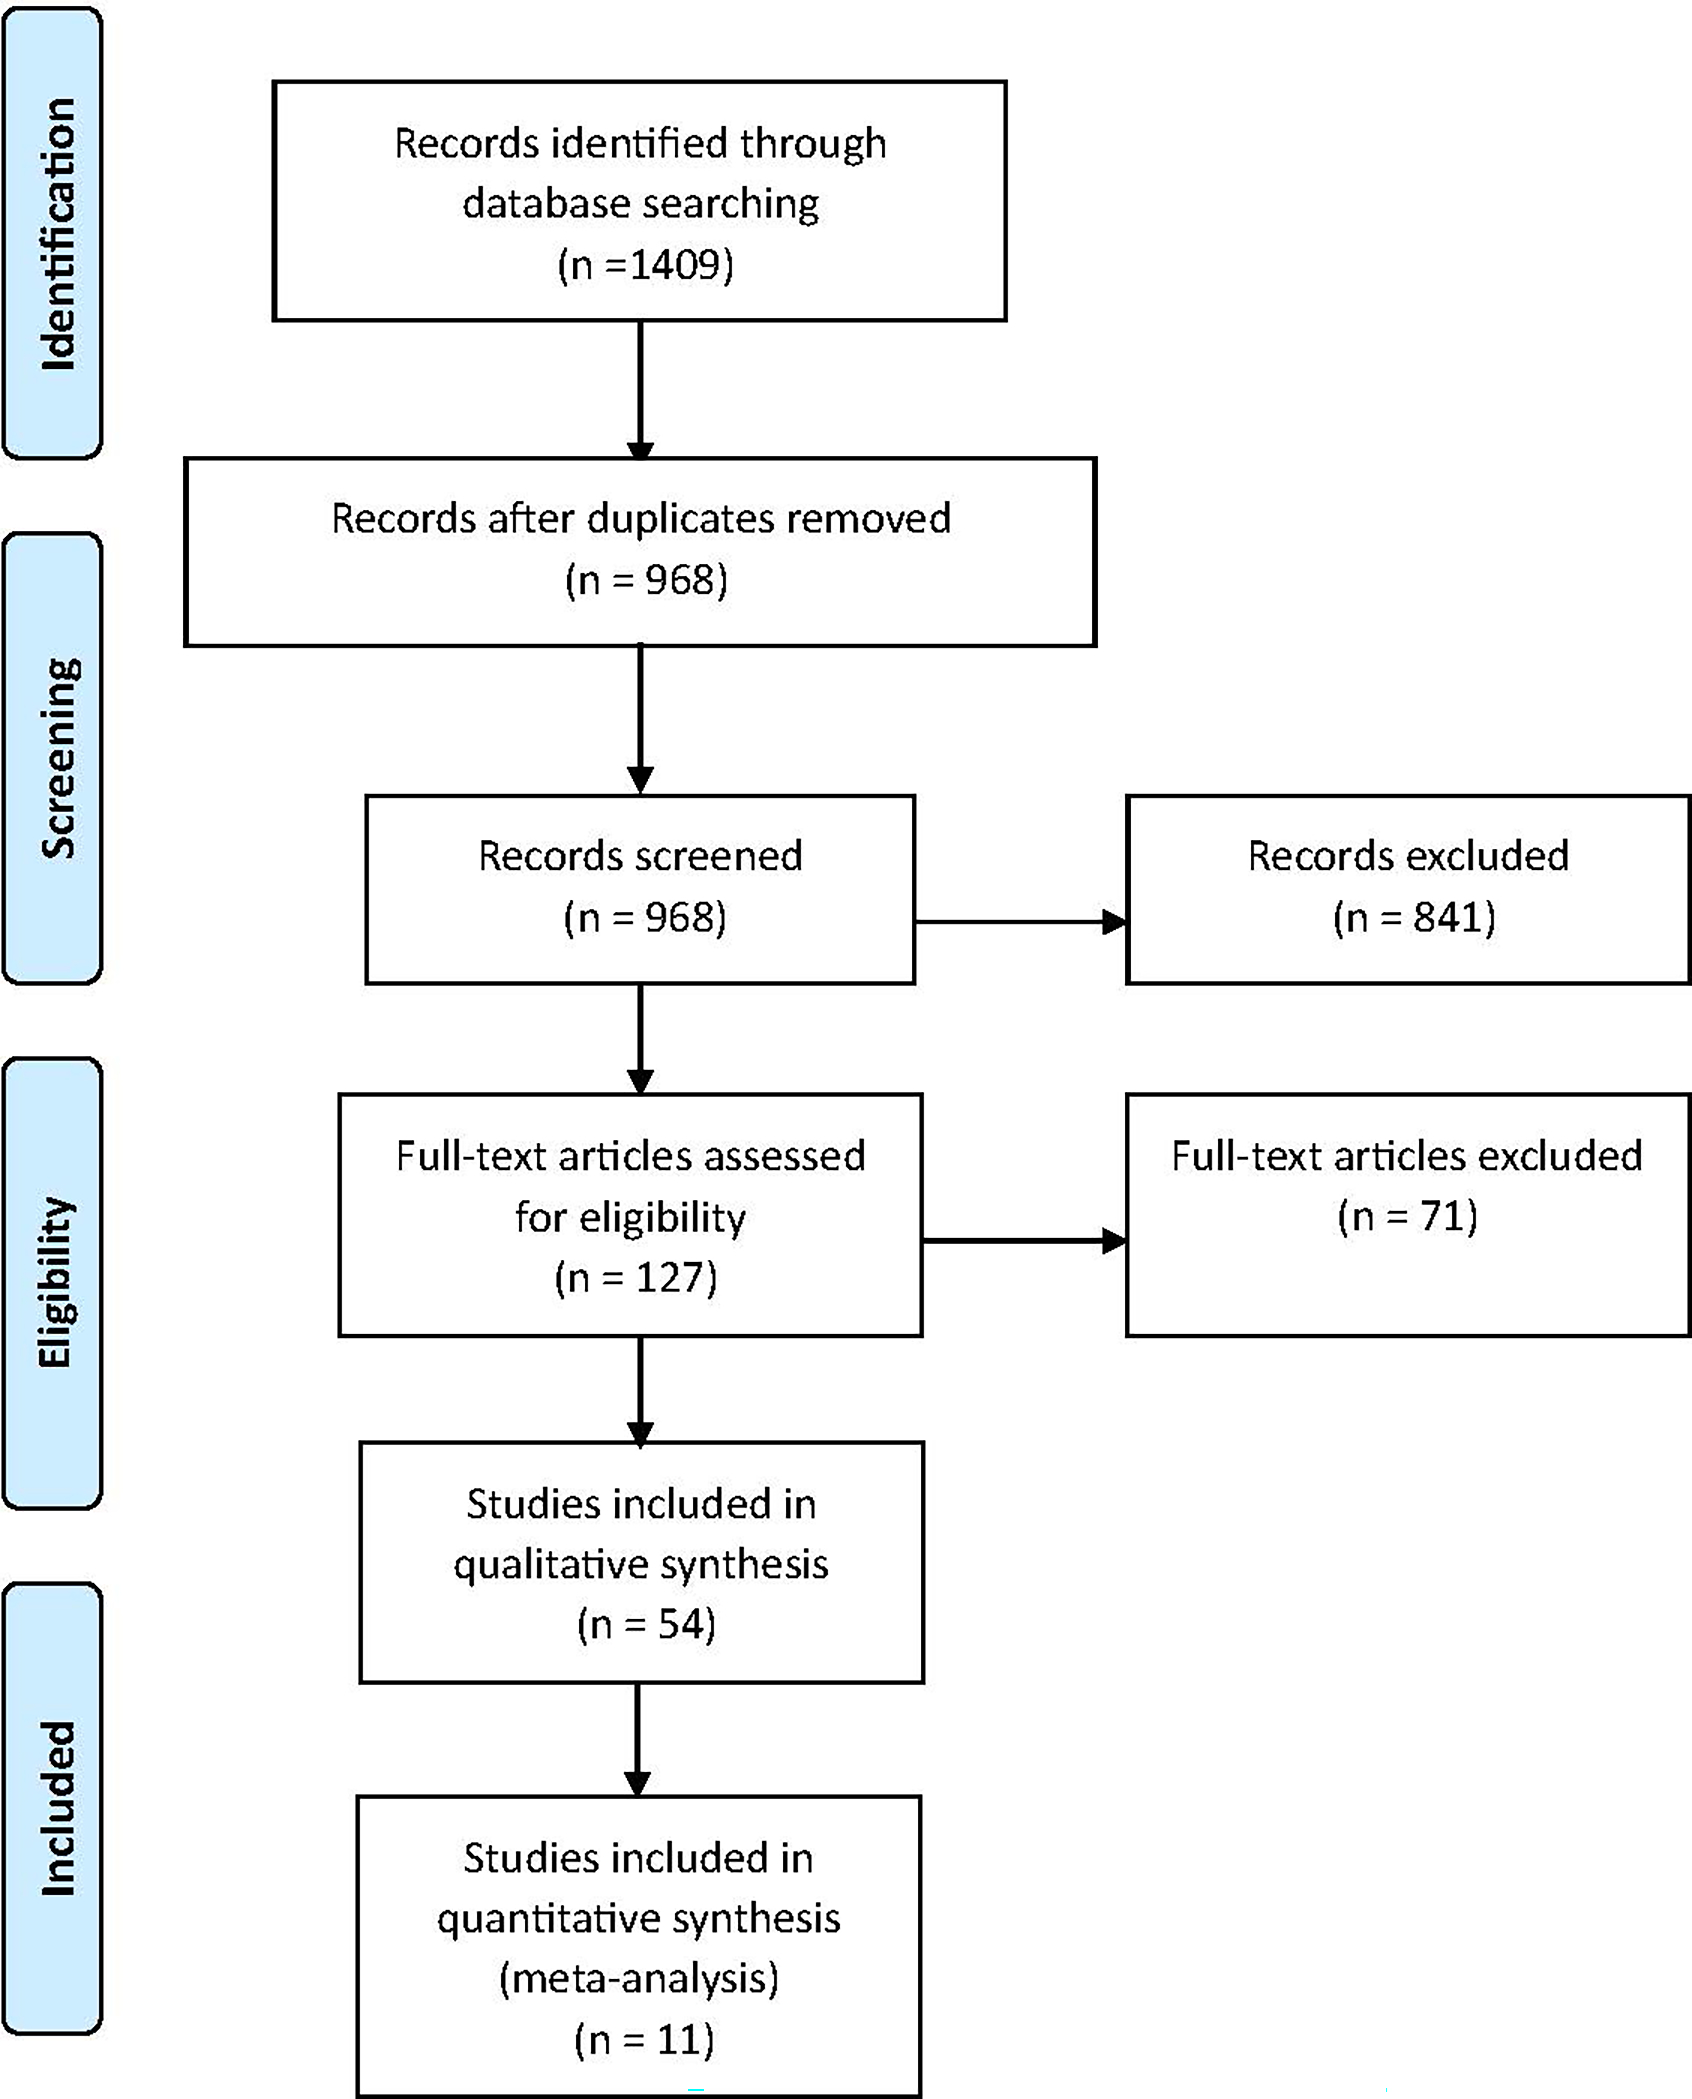
PRISMA flow diagram.
Data extraction and analysis
The first and second authors extracted data from each paper and recorded it in a table using Microsoft Excel (Table 2). The extracted dependent variables from each paper included various acoustic parameters such as Sound Pressure Levels (SPL), fundamental frequency (fo), Cepstral Peak Prominence Smoothed (CPPS), Harmonics-to-Noise Ratio (HNR), Jitter, and Shimmer. Additionally, vocal doses (phonation time percentage and VLI) were extracted from publications that reported them. Lastly, the perceptual assessment data obtained using GRBAS was also included in the extraction process.
Table 2.
Relevant information of included publications
| # | Title | Last Name, Year, Country | Journal | Sample size by gender | Parameters evaluated |
|---|---|---|---|---|---|
|
| |||||
| 1 | Vocal Fatigue in prospective vocal professionals | Anand et al., 2019, USA | Journal of Voice | 28 undergraduate and graduate students from SLP | SD SPL (dB) - fo (Hz) - fo standard deviation (Hz) - Pitch Strength - CPPS (dB) - AVQI |
| 2 | Vocal Dose of preservice music therapists’ preservice music teachers, and other undergraduate students | Jeremy et al., 2019, USA | Journal of Voice | 8 students from different careers | fo (Hz) |
| 3 | Vocal fatigue in doctors: evaluation with subjective and objective acoustic parameters | Erkan et al., 2020, Turkey | Logopedics Phoniatrics Vocology | 30 medical volunteers (15 men and 15 women) | fo (Hz) - Jitter (%) - Shimmer (%) - HNR |
| 4 | Muscle Tension Dysphonia: Experience from a Conflict Zone | Ali et al., 2020, India | Indian Journal of Otolaryngology and Head & Neck Surgery | 72 subjects diagnosed with muscle tension dysphonia (MTD) | GRBAS |
| 5 | Acoustic Analysis of Indian Teachers’ Voice: Pre and Post Teaching Circumstances | Alexander et al., 2017, India | Indian Journal of Otolaryngology and Head & Neck Surgery | 30 elementary school teachers, (15 male and 15 female) | fo (Hz) - Jitter (%) - Shimmer (%) - HNR - SPL (dB) |
| 6 | Dynamically Monitoring Vocal Fatigue and Recovery Using Aerodynamic, Acoustic, and Subjective Self-Rating Measurements | Xue et al., 2018, China | Journal of Voice | 10 undergraduate and graduate students (6 males and 4 females) | PTP - fo (Hz) - Jitter (%) - Shimmer (%) - HNR |
| 7 | Respiratory and Laryngeal Function in Teachers: Pre- and Post-vocal Loading Challenge | Herndon et al., 2017, USA | Journal of Voice | 12 occupational voice users (3 males and 9 females) | CPP - LHR |
| 8 | Effects of added absorption on the vocal exertions of talkers in a reverberant room | Rollins et al., 2019, USA | The Journal of the Acoustical Society of America | 32 university students (16 men and 16 women) | T20 - EDT - C50 (dB) - STI - Gramo RG (dB) |
| 9 | Trajectories in classroom acoustics: Vocal behavior of teachers | Astolfi, 2018, Italy | The Journal of the Acoustical Society of America | Active teachers | SPL (dB) - Dt - fo (Hz) - CPPS |
| 10 | Voice Use Among Music Theory Teachers: A Voice Dosimetry and Self-Assessment Study | Schiller et al., 2017, Belgium | Journal of Voice | 13 music theory teachers (4 men and 9 women) | fo (Hz) - voice SPL (dB) - SPL (dB) - VLI - Phonation time (%) |
| 11 | Relationship between Activity Noise, Voice Parameters, and Voice Symptoms among Female Teachers | Pirilä et al., 2017, Finland | Folia Phoniatrica et Logopaedica | 24 female elementary school teachers. | SPL (dB) - fo (Hz) - HNR |
| 12 | Development of a System for Quantitative Assessment of Vocal Loading | Mahalakshmi et al., 2018, India | Advances in Systems, Control and Automation | 25% of the U.S. population. | fo (Hz) - Dt - DD - Dc - De |
| 13 | Long-Time Voice Accumulation During Work, Leisure, and a Vocal Loading Task in Groups with Different Levels of Functional Voice Problems | Whitling et al., 2016, Sweden | Journal of Voice | 50 women 20 with functional dysphonia; 10 with high vocal load with voice complaints; 10 with high daily vocal load without voice complaints; and 10 healthy voice controls, | Voice SPL (dB) - Background noise (dB) - fo (Hz) - Phonation time (%) |
| 14 | The Interaction of Surface Hydration and Vocal Loading on Voice Meas ures | Fujiki et al., 2016, USA | Journal of Voice | 16 normophonic subjects (8 males- 8 females). | CPP - fo (Hz) |
| 15 | Voice Changes in Real Speaking Situations during a Day, with and Without Vocal Loading: Assessing Call Center Operators | Boaz et al., 2015, Israel | Journal of Voice | 27 subjects (7 males- 20 females). | SPL (dB) - fo (Hz) |
| 16 | Vocal Effects in Military Students Submitted to an Intense Recruit Training: A Pilot Study | Nascimiento et al., 2015, Brazil | Journal of Voice | 83 male soldiers. | fo (Hz) - Jitter (dB) HNR (dB) - Brightness (dB) - Intensity (dB) |
| 17 | Acoustic comfort in high-school classrooms for students and teachers | Puglisi et al., 2015, Italy | Energy Procedia | 37 teachers | SPL (dB) - fo (Hz) - Phonation time (%) |
| 18 | How classroom acoustics affect the vocal load of teachers | Durup et al., 2015, Great Britain | Energy Procedia | 20 primary and secondary school teachers (6 males - 14 females). | SPL (dB) - fo (Hz) - Total phonation time (%) - LAeq ((dB) - Tmf (seconds) |
| 19 | Discriminant capacity of acoustic, perceptual, and vocal self: The effects of vocal demands | Cortes et al., 2014, Brazil | Journal of Voice | 73 women from different professions. | fo (Hz) - GRBAS - Loudness (dB) |
| 20 | Effects of vocal demands on voice performance of student singers | Franca et al., 2014, USA | Journal of Voice | 8 university music students with specialization in voice. | RAP - fo (Hz) - Brigthness - NHR (dB) - VTI - SPL (dB) - MAFV |
| 21 | Comparison of vocal loading parameters in kindergarten and elementary school teachers | Remacle et al., 2013, Belgium | Journal of Speech, Language, and Hearing Research | 32 female teachers (12 kindergarten - 20 elementary school) | fo (Hz) - SPL (dB) - Dt - DD - Dc |
| 22 | Acoustic parameters and salivary IL-6 levels in overweight and obese teachers | Acurio et al., 2014, Chile | Journal of Voice | 33 teachers at school with normal voices | HNR - MPT - fo (Hz) - Frequency disturbance - Jitter local (dB) Jitter rap (dB) - Brightness |
| 23 | EGG and acoustic analyses of different voice samples: Comparison between perceptual evaluation and voice activity and participation profile | Kankare et al., 2013, Egypt | Folia Phoniatrica et Logopaedica | 93 kindergarten teachers. | SPL (dB) - fo (Hz) |
| 24 | A comparison of vocal demands with vocal performance among classroom student teachers | Franca, 2012, USA | Journal of Communication Disorders | 11 university students. | fo (Hz) - NHR - VTI - SPL - Jitter (dB) - Shimmer |
| 25 | Relationship between vocal doses and voice disorders on primary school teachers | Astolfi et al., 2012, Italy | Euronoise | 29 teachers (2 men - 27 women) | Jitter (%) - Brightness (%) - fo (Hz) - SPL (dB) - Smooth phonation index |
| 26 | Vocal impact of a prolonged reading task at two intensity levels: Objective measurements and subjective self-ratings | Remacle et al., 2011, Belgium | Journal of Voice | 50 female teachers | fo - Jitt (%) - Shim (%) - NHR - flow - fHigh - Range |
| 27 | The effect of voice amplification on occupational vocal dose in elementary school teachers | Gaskill et al., 2011, USA | Journal of Voice | 2 teachers | fo - Dc - DD - K cycle - SPL - DD per hour(m/h) |
| 28 | Vocal load investigations on primary school teachers | Bottalico et al, 2011, Italy | The Journal of the Acoustical Society of America | 40 elementary school teachers (4 men - 36 women) | SPL (dB) - fo (Hz) |
| 29 | Voice amplification as a means of reducing vocal load for elementary music teachers | Morrow and Connor, 2010, USA | Journal of Voice | 7 primary teachers (1 man and 6 women) | SPL (dB) - MPT (min) - fo (Hz) - Cycle Dose (millions) - Dd (m) |
| 30 | Comparison of voice-use profiles between elementary classroom and music teachers | Morrow and Connor, 2010, USA | Journal of Voice | 12 Teachers (1 man and 11 women) | MPT (min) - fo (Hz) - Vocal intensity |
| 31 | Measurement of vocal doses in virtual classrooms | Bottalico et al., 2010, Italy | Internoise | 22 subjects with normal voices (11 men and 11 women) | SPL (dB) - fo (Hz) - Dt (min) - VLI - Dd (m) - De - Dr |
| 32 | Investigation of Vocal Fatigue Using a Dose-Based Vocal Loading Task | Lei et al., 2020, Canada | Applied Sciences | 10 normal voices subjects (women) | fo (Hz) - SPL (dB) - CPP (dB) - TILT (dB) - HRF (dB) - jitter (%) - shimmer (%) |
| 33 | The impact of a standardized vocal loading test on vocal fold oscillations | Echternach et al., 2020, Germany | European Archives of Oto-Rhino-Laryngology | 23 subjects without vocal training (12 men and 11 women) | fo (Hz) - SPL (dB) - MPT (min) - DSI (dB) - OQ - GAW |
| 34 | Vocal Loading and Environmental Humidity Effects in Older Adults | Sundarrajan et al., 2017, India | Journal of Voice | 13 normal voices subjects (5 men and 8 women) | CPP (dB) - LHR (dB) - PTP (cmH2O) - fo (Hz) - PPE |
| 35 | Comparison of Habitual and High Pitch Phonation in Teachers with and Without Vocal Fatigue | Abi and Santosh, 2020, India | Journal of Voice | 60 teachers (women) | fo (Hz) - Minimum fo (Hz) - Jitter (%) - RAP (%) - PPQ (%) - SPPQ (%) - NHR (Hz)- CPP (dB) - CPPS (dB) |
| 36 | Immediate Impact of Vocal Demand on Musical Theater Singers in Brazil | Pacheco and Behlau, 2018, Brazil | Journal of Voice | 264 musical theater singers (138 men and 126 women) | fo (Hz) |
| 37 | Design of a clinical vocal loading test with long-time measurement of voice | Whitling et al., 2014, Sweden | Journal of Voice | 11 normal voices subjects (5 men and 6 women) | PTP (cmH2O) - SPL (dB) |
| 38 | Vocal Loading in Speaking a Foreign Language | Järvinen and Laukkanen, 2015, Finland | Folia Phoniatrica et Logopaedica | 43 native Finnish and English speakers (22 men and 21 women) | Leq (cm) - fo (Hz) - Alpha ratio (dB) |
| 39 | Measuring Voice Effects of Vibrato-Free and Ingressive Singing: A Study of Phonation Threshold Pressures | Fornhammar et al., 2020, Germany | Journal of Voice | 4 opera singers (2 men and 2 women) | PTP (cmH2O) - fo (Hz) - SPL (dB) |
| 40 | Change of vocal capacity due to different vocal loading tests | Echternach et al., 2013, Germany | Laryngo-Rhino-Otol | 17 teacher training students (6 men and 11 women) | SPL (dB) - fo (Hz) |
| 41 | Influence of Smartphones and Software on Acoustic Voice Measures | Grillo et al., 2016, USA | International Journal of Telerehabilitation | 10 Norwegian-speaking men and women | fo (Hz) - Jitter (%) - Shimmer (%) – NHR (Hz) - CPP (dB) - AVQI |
| 42 | The use and role of the Ambulatory Phonation Monitor (APM) in voice assessment | Nacci et al., 2013, Italy | Acta Otorhinolaryngol Italica | 10 primary school teachers | SPL (dB) - fo - Dt (min) |
| 43 | Impact of vocal load on breathiness: perceptual evaluation | Remacle et al., 2014, Belgium | Logopedics Phoniatrics Vocology | 50 normal voices subjects (female) | SPL (dB) - fo (Hz) |
| 44 | Collision and phonation threshold pressures before and after loud, prolonged vocalization in trained and untrained voices | Enflo et al., 2013, Sweden | Journal of Voice | 10 normal voices subjects (8 males and 2 females) | PTP (cmH2O) - Psub |
| 45 | Speech and Language Pathologists’ Voice Use in Working Environments: A Field Study Using Ambulatory Phonation Monitoring | Mozzanica et al., 2017, Switzerland | Folia Phoniatrica et Logopaedica | 28 pathologists (women) | fo (Hz) - SPL (dB) - Total cycles of vibration |
| 46 | Voice disorders in primary school teachers | Lira et al., 2014, Italy | Acta Otorhinolaryngol Italica | 157 teachers (2 men and 155 women) | Jitter (%) - fo (Hz) - Shimmer (%) - vAm (%) - NHR (Hz) - Vti - SPi - FTri (%) - ATri (%) - dVB (%) - dSh (%) |
| 47 | Natural Voice Use in Patients with Voice Disorders and Vocally Healthy Speakers Based on 2 Days Voice Accumulator Information from a Database | Soedersten et al., 2014, Sweden | Journal of Voice | 20 patients with voice disorders (4 males and 16 females) | fo (Hz) - NHR (Hz) - SPL (dB) - Phonation ratio |
| 48 | Acoustic analysis of the voice: Temporal, spectral and cepstral measurements in the normal voice with the Praat in a sample of Spanish speakers | Delgado et al., 2017, Spain | Revista de Investigación en Logopedia | 50 Spanish speakers with normal voices (25 men and 25 women) | fo (Hz) - RAP (%) - Noise parameters - Long-term average spectrum parameters |
| 49 | The Voice Range Profile: Its Function, Applications, Pitfalls and Potential | Ternström et al., 2016, Sweden | Acta Acustica United with Acustica | 30 Swedish with normal voices (men) | fo (min) - fo (max) - fo (range) - SPL (dB) - ST× (dB) |
| 50 | Occupational Vocal Health of Elite Sports Coaches: An Exploratory Pilot Study of Football Coaches | Buckley et al., 2014, Australia | Journal of Voice | 12 Australian soccer coaches (men) | fo (Hz) - SPL (dB) - MPT (%) |
| 51 | Teachers’ Voice Use in Teaching Environments: A Field Study Using Ambulatory Phonation Monitor | Lyberg et al., 2014, Belgium | Journal of Voice | 14 teachers (2 men and 12 women) | SPL (dB) - fo (Hz) - MPT (%) |
| 52 | Measuring Vocal Function in Professional Music Theater Singers: Construct Validation of the Evaluation of the Ability to Sing Easily (EASE) | Phyland et al., 2014, USA | Folia Phoniatrica et Logopaedica | 284 singers (127 men and 157 women) | EASE - VC |
| 53 | Speaking Fundamental Frequency and Phonation Time during Work and Leisure Time in Vocally Healthy Preschool Teachers Measured with a Voice Accumulator | Szabo et al., 2013, Sweden | Folia Phoniatrica et Logopaedica | 12 female preschool teachers with normal voices (women) | MPT - fo (Hz) - Relative phonation time |
| 54 | Preliminary results of a computer-assisted vocal load test with 10-min test duration | Hanschmann et al., 2010, Germany | European Archives of Oto-Rhino-Laryngology | 46 normal voices subjects (12 men and 34 women) | SPL (dB) - VLI - vocal self-perception |
A bibliometric analysis using Vos Viewer software was performed, and this analysis included the identification of the number of articles published per year, as well as the most common journals and locations. A co-occurrence analysis was also performed to identify the relationship between the keywords included in the manuscripts. As a last step, a content analysis was performed to identify three categories: (1) physiological explanations, (2) reported measurements, and (3) associated factors (vocal demands).
Quality assessment
The quality of the publications was assessed using the “Quality Assessment Tool for Quantitative Studies”. Although this scale evaluates eight aspects, only five are included for the total score: (1) selection bias, (2) study design, (3) confounding factors, (4) data collection methods, and (5) permanent participation of the population. Each criterion was scored on a scale of 1 to 3, where 1 is equivalent to “strong”, 2 “medium” and 3 “weak” (28).
Meta-analysis
A random-effects meta-analysis was conducted to compare voice acoustic parameters specifically among teachers with different vocal demands. The mean difference was chosen as the effect measure for the meta-analysis. While it was feasible to include additional measurements or populations, we purposefully focused the analysis on acoustic parameters among teachers to ensure a comprehensive coverage of the voice characteristics relevant to the teaching profession. The random-effects method was employed to account for the variation in population parameters across studies, and the weights used to calculate the summary estimate were adjusted accordingly (29). The meta-analysis was performed using Review Manager software (RevMan 5.3) (30). Heterogeneity was assessed using the X2 test and the I2 test, where the I2 statistic represents the percentage of variation across studies that can be attributed to heterogeneity rather than chance. A rough guide for interpreting I2 values is 25% for low heterogeneity, 50% for moderate heterogeneity, and 75% for high heterogeneity (31). The interpretation of the observed I2 value depends on the effect sizes, the strength of evidence for heterogeneity (e.g., p-value from the X2 test or confidence interval for I2), and the direction of effects.
In preparation for the meta-analysis, efforts were made to ensure data readiness and suitability for presentation or synthesis. This involved addressing missing summary statistics through a simple imputation method or contacting study authors for relevant information whenever feasible. Furthermore, data conversions were conducted to establish consistency and comparability across studies, including standardizing units and transforming variables as needed.
Given the limited number of included studies, the exploration of possible causes of heterogeneity through methods such as subgroup analysis or meta-regression will not be deemed necessary for this meta-analysis.
A sensitivity analysis will be conducted to assess the robustness of the synthesized results in the meta-analysis. This analysis involves systematically excluding individual studies one at a time and re-analyzing the data to evaluate the impact on the overall effect size. This sensitivity analysis aims to examine the stability of the findings and to assess the extent to which the results were influenced by specific studies or methodological factors.
Risk assessment
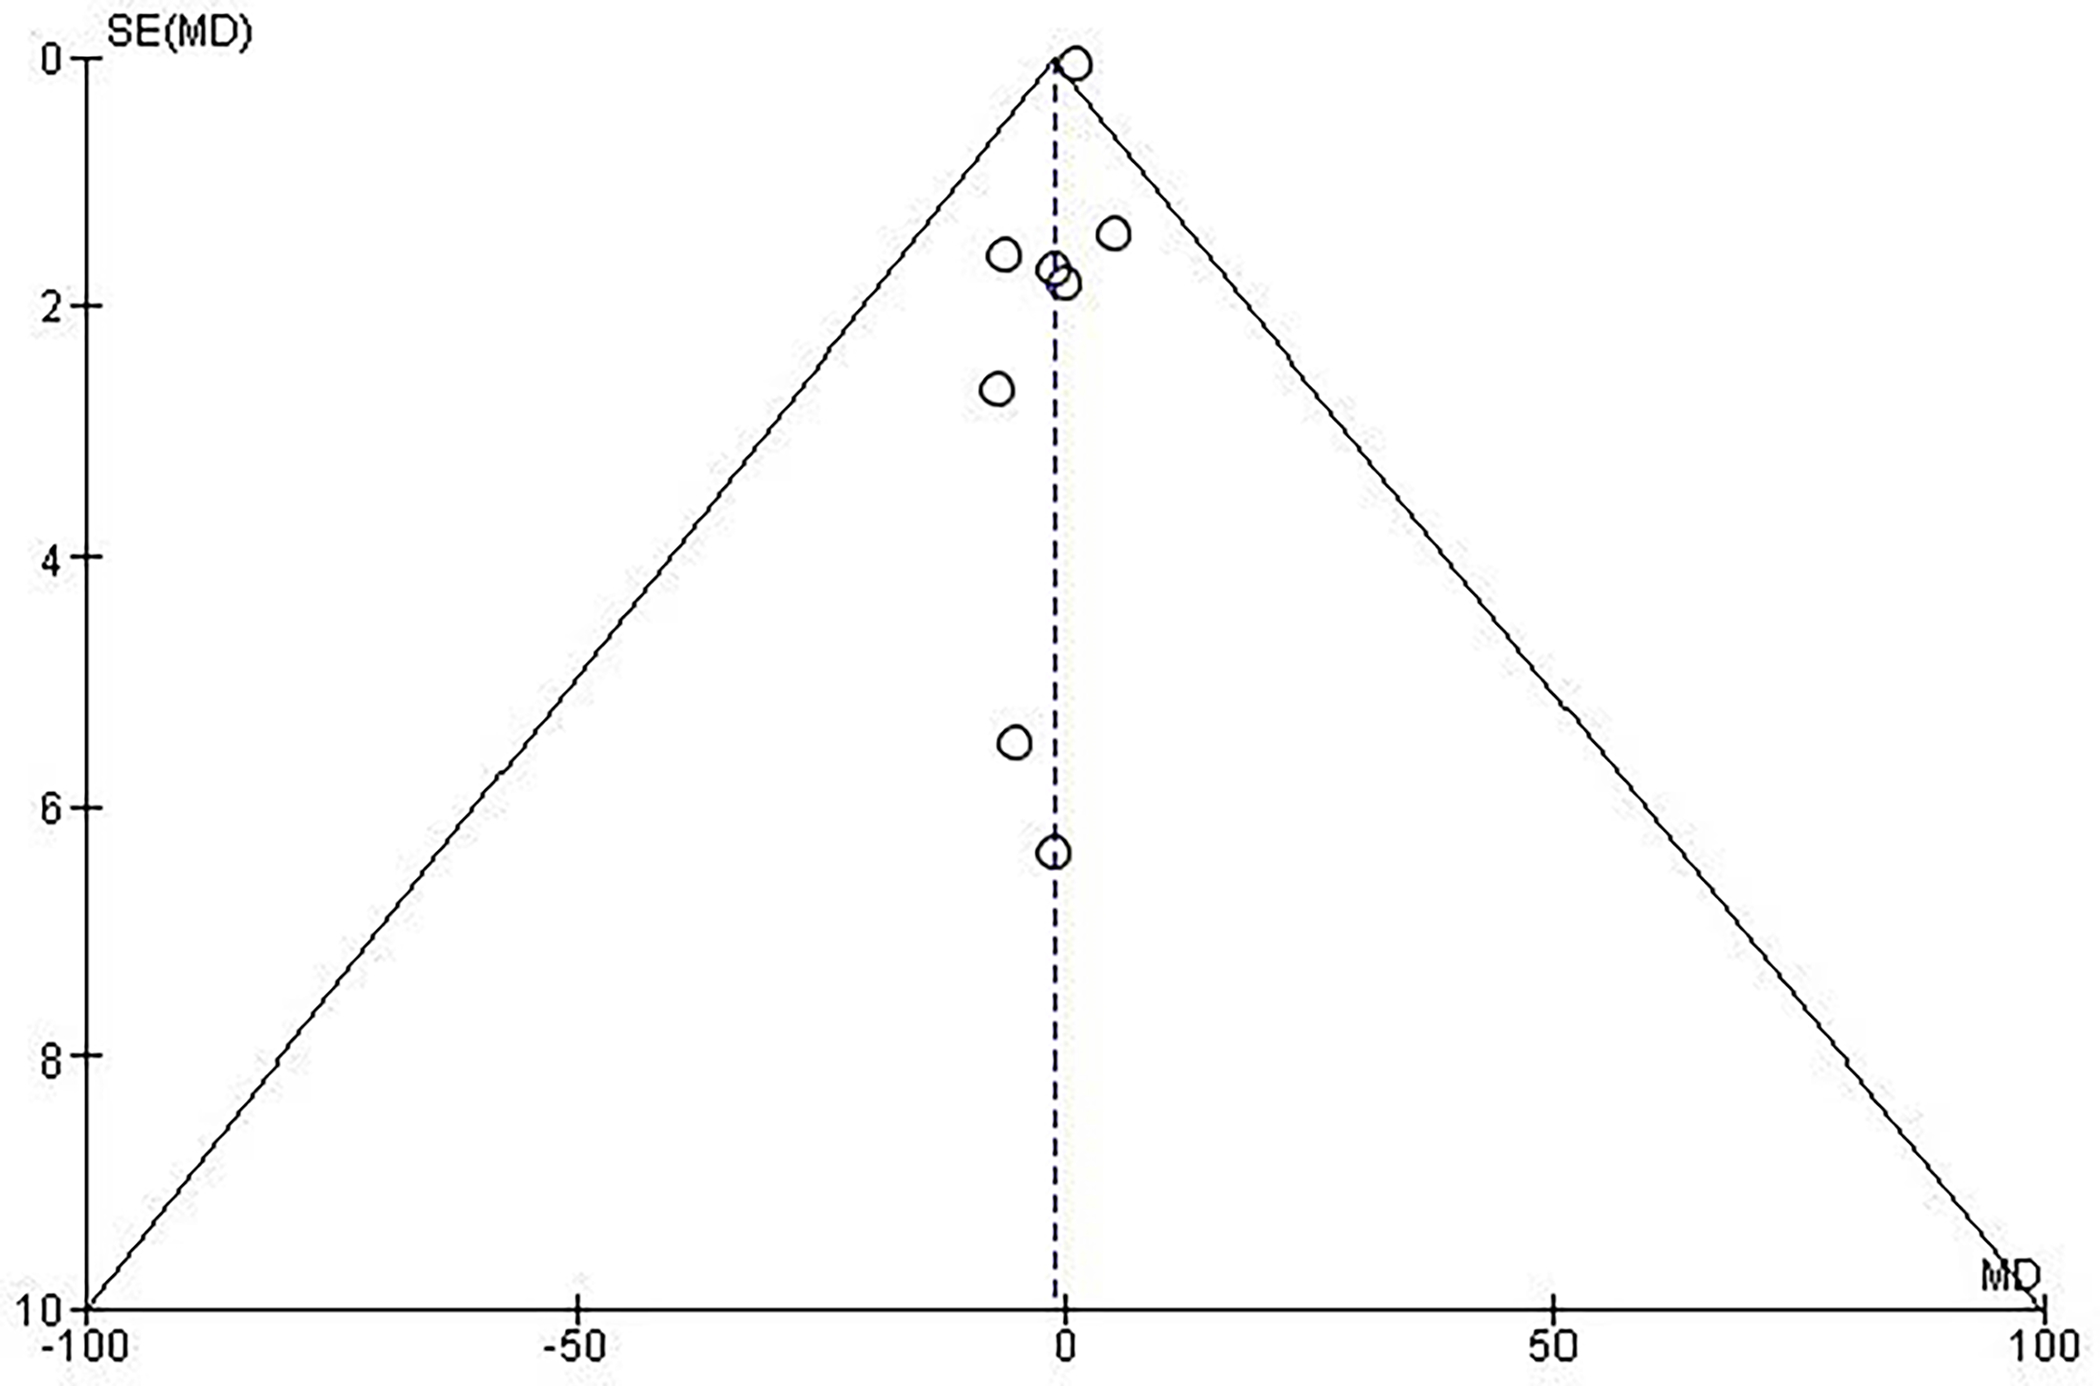
Publication bias was assessed in the meta-analysis by examining funnel plots. Funnel plots are graphical representations that help evaluate potential publication bias by assessing the symmetry of the distribution of study results (32). Asymmetry in the funnel plot can indicate the presence of publication bias, suggesting that studies with smaller sample sizes or non-significant results may be less likely to be published (33). By including funnel plot analysis, we aimed to consider and address the potential impact of publication bias on the overall findings of the meta-analysis.
Results and discussion
Although our purpose was to identify the most reported physiological explanations, parameters, and associated factors of vocal demand response, we found no studies reporting this term. One possible explanation is that vocal demand response is a “new” term that researchers are getting familiar with but, in the meanwhile, they continue using vocal load. Thus, the first part presents the results of the bibliometric analysis and co-occurrence analysis, the second part shows the results of the content analysis of the concept of vocal load, and the third part is the meta-analysis.
Part One
Bibliometric analysis
This analysis included the number of publications per year, journals with more publications, locations of authors’ affiliations more commonly presented, and co-occurrence network. Figure 2 shows that the Journal of Voice is the journal with more publications on this topic (n=26; 46%), followed by Folia Phoniatrica et Logopaedica (11%), European Archives of Oto-Rhino-Laryngology (5%), and The Journal of the Acoustic Society of America (5%).
Figure 2.
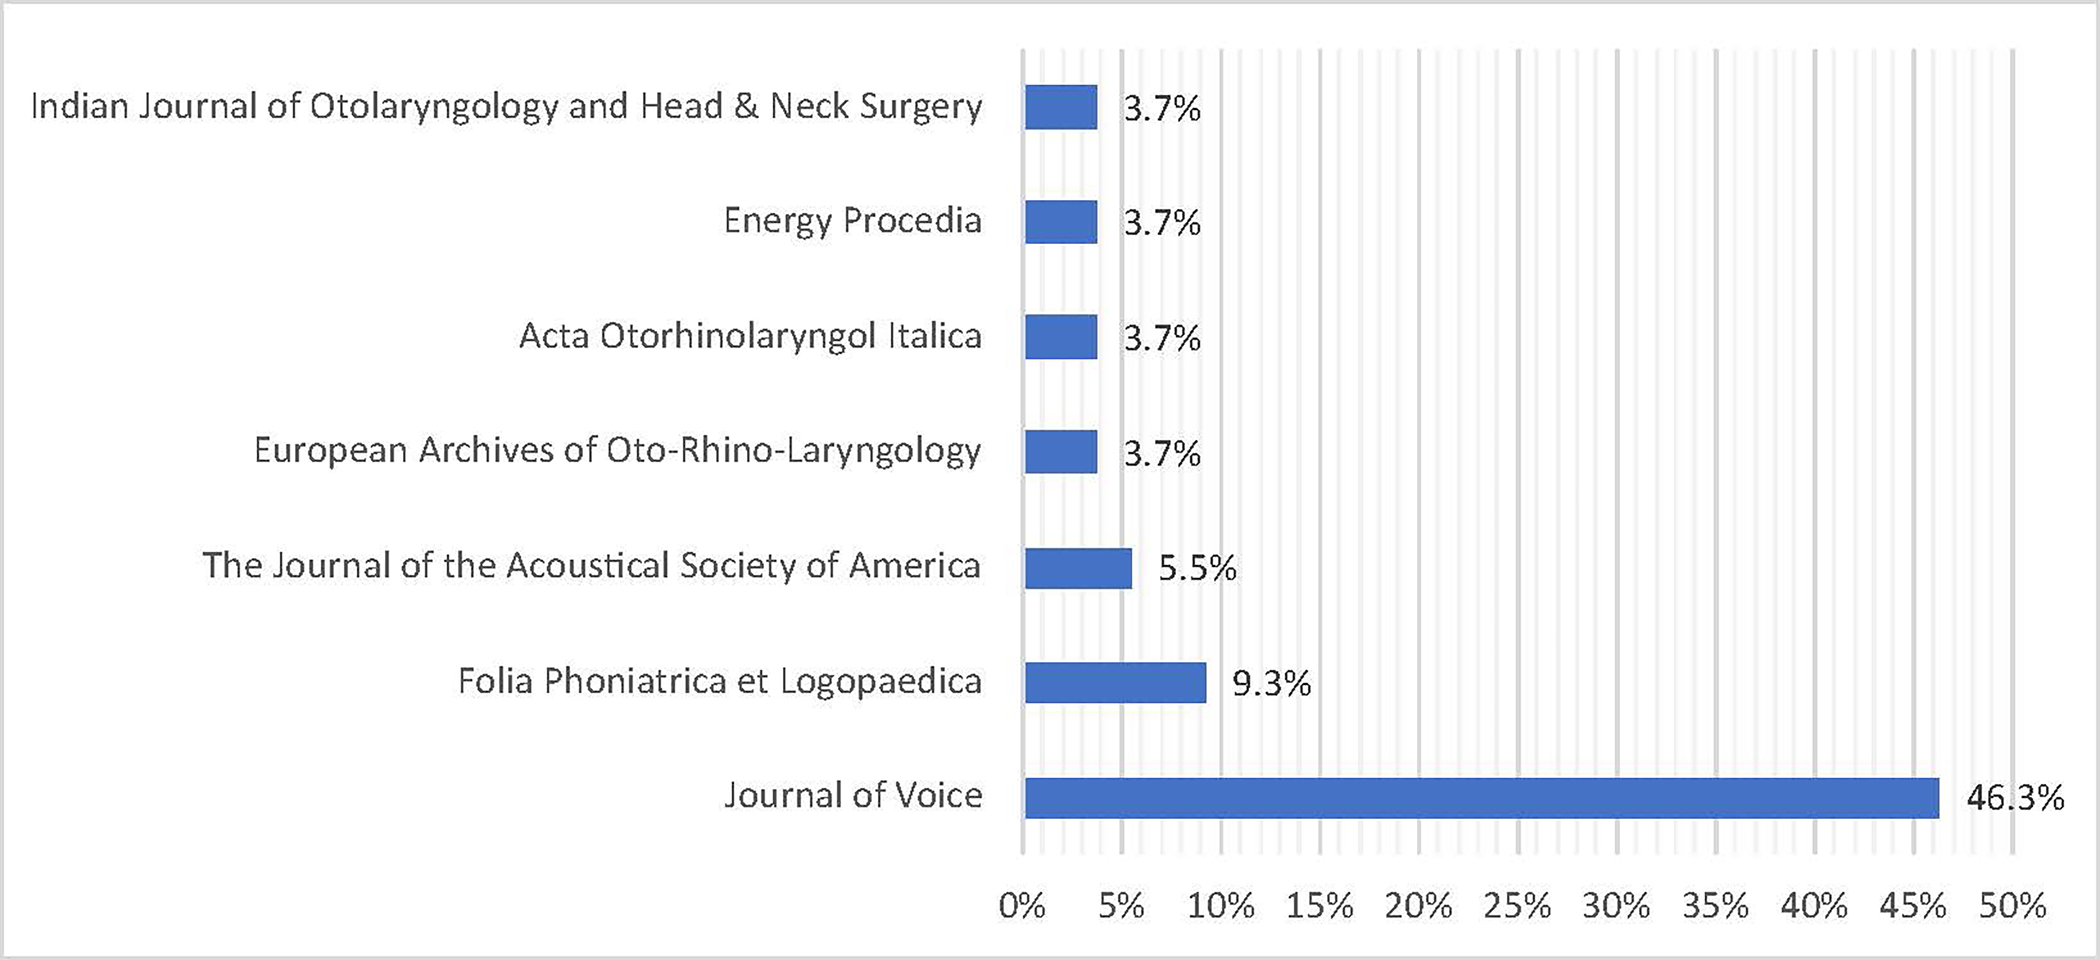
Distribution of publications per journal.
Figure 3 shows the evolution of publications by year (from 2009 to 2021). Most of the included manuscripts were published in 2014, with an average of four publications per year. Figure 4 shows that most of the published papers were written by authors working in universities located in the United States of America (n=12), followed by Sweden (n=7), Germany (n=5), India (n=5), and Belgium (n=5).
Figure 3.
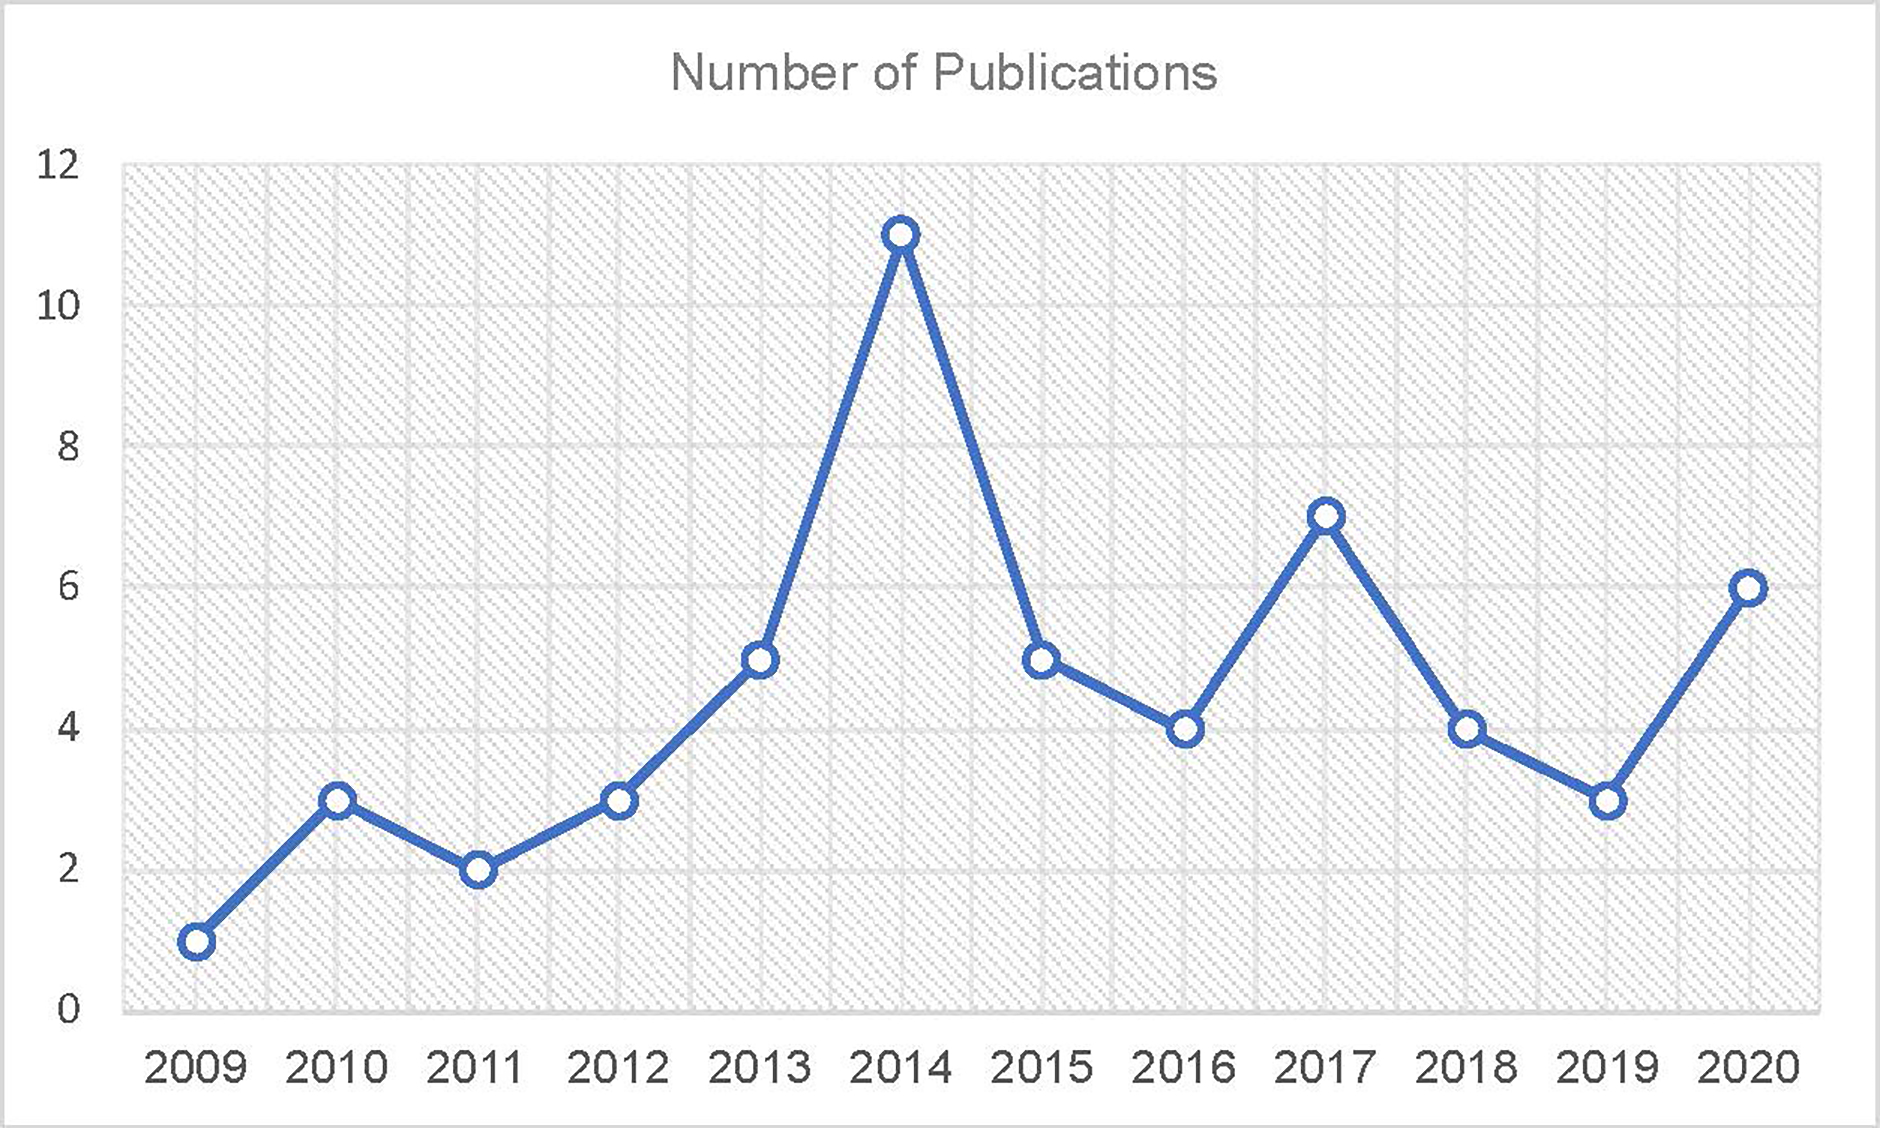
Evolution of publications per year.
Figure 4.

Location of affiliations of published manuscripts.
Co-occurrence analysis
The metadata of the 54 selected articles was used to build a co-occurrence network using VosViewer software. This intellectual network shows that vocal load is strongly associated with distance dose, ambulatory phonation monitor, and variation (blue cluster). Although the focus of the analysis in this review was on vocal load, other findings were also observed: (1) vocal effort was strongly associated with a voice problem, vocal demand, and voice use (green cluster); and (2) vocal fatigue was associated with shimmer and cepstral peak prominence.
Quality assessment
A high percentage of reviewed papers scored high on the quality assessment. Around 64.29% of the studies obtained a high-quality score (score=1), 10.36% were rated as moderate quality (score=2), and 5.36% were identified as weak quality (score=3) (Table 3). In general, 91% of papers reported data related to the measurements based on instrumental, standardized assessments.
Table 3.
Quality assessment scores
| # | SELECTION | STUDY DESIGN | CONFOUNDERS | BLINDING | DATA COLLECTION | WITHDRAWALS AND DROPOUTS | GLOBAL_RATING |
|---|---|---|---|---|---|---|---|
|
| |||||||
| 1 | 2 | 2 | 1 | 2 | 1 | 1 | 1 |
| 2 | 1 | 1 | 1 | 1 | 1 | 1 | 1 |
| 3 | 1 | 2 | 1 | 1 | 1 | 1 | 1 |
| 4 | 1 | 2 | 1 | 2 | 1 | 1 | 1 |
| 5 | 1 | 2 | 1 | 2 | 1 | 1 | 1 |
| 6 | 1 | 2 | 1 | 1 | 1 | 1 | 1 |
| 7 | 1 | 2 | 1 | 2 | 1 | 1 | 1 |
| 9 | 3 | 2 | 3 | 3 | 1 | 3 | 3 |
| 10 | 1 | 2 | 1 | 1 | 1 | 1 | 1 |
| 11 | 1 | 2 | 1 | 2 | 1 | 1 | 1 |
| 12 | 3 | 3 | 3 | 3 | 3 | 3 | 3 |
| 13 | 1 | 1 | 1 | 3 | 1 | 1 | 2 |
| 14 | 1 | 2 | 1 | 2 | 1 | 1 | 1 |
| 15 | 1 | 1 | 1 | 2 | 1 | 1 | 1 |
| 16 | 2 | 2 | 1 | 1 | 1 | 1 | 1 |
| 17 | 3 | 3 | 3 | 3 | 1 | 3 | 3 |
| 18 | 1 | 2 | 1 | 1 | 1 | 1 | 1 |
| 19 | 1 | 2 | 1 | 1 | 1 | 1 | 1 |
| 20 | 1 | 1 | 1 | 1 | 1 | 1 | 2 |
| 21 | 1 | 2 | 1 | 1 | 1 | 1 | 1 |
| 22 | 1 | 2 | 1 | 2 | 1 | 1 | 1 |
| 23 | 1 | 1 | 1 | 1 | 1 | 1 | 1 |
| 24 | 1 | 2 | 1 | 1 | 1 | 1 | 1 |
| 25 | 1 | 2 | 1 | 1 | 1 | 1 | 1 |
| 26 | 1 | 1 | 1 | 1 | 1 | 1 | 1 |
| 27 | 1 | 1 | 1 | 2 | 1 | 1 | 1 |
| 28 | 2 | 2 | 1 | 2 | 1 | 1 | 1 |
| 29 | 1 | 1 | 1 | 1 | 1 | 1 | 1 |
| 30 | 1 | 2 | 3 | 2 | 1 | 2 | 2 |
| 31 | 1 | 2 | 2 | 2 | 1 | 1 | 1 |
| 32 | 1 | 2 | 1 | 1 | 1 | 1 | 1 |
| 33 | 1 | 2 | 1 | 1 | 1 | 1 | 1 |
| 34 | 1 | 2 | 1 | 1 | 1 | 1 | 1 |
| 35 | 1 | 1 | 1 | 2 | 1 | 1 | 1 |
| 36 | 1 | 1 | 1 | 2 | 1 | 1 | 1 |
| 37 | 2 | 1 | 3 | 2 | 1 | 2 | 2 |
| 38 | 1 | 2 | 1 | 1 | 1 | 2 | 2 |
| 39 | 1 | 2 | 1 | 3 | 1 | 1 | 2 |
| 40 | 1 | 2 | 1 | 1 | 1 | 1 | 1 |
| 41 | 1 | 2 | 1 | 2 | 2 | 2 | 1 |
| 42 | 3 | 2 | 1 | 3 | 1 | 3 | 3 |
| 43 | 2 | 2 | 3 | 2 | 1 | 1 | 2 |
| 44 | 1 | 2 | 2 | 2 | 1 | 2 | 1 |
| 45 | 1 | 1 | 1 | 2 | 1 | 1 | 1 |
| 46 | 1 | 1 | 1 | 1 | 1 | 1 | 1 |
| 47 | 1 | 1 | 1 | 1 | 1 | 2 | 1 |
| 48 | 1 | 1 | 2 | 1 | 1 | 1 | 2 |
| 49 | 3 | 3 | 3 | 3 | 1 | 3 | 3 |
| 50 | 1 | 2 | 1 | 2 | 1 | 1 | 1 |
| 51 | 1 | 1 | 1 | 3 | 1 | 1 | 2 |
| 52 | 1 | 1 | 2 | 1 | 1 | 1 | 2 |
| 53 | 1 | 2 | 1 | 1 | 2 | 1 | 1 |
| 54 | 1 | 2 | 1 | 2 | 1 | 1 | 1 |
Part Two
Content analysis
Content analysis was performed based on the definitions of vocal load identified in each document (Table 4). The conceptual framework of the search was consolidated into three subsections: (1) physiological explanations, (2) reported measurements, and (3) associated factors (vocal demands).
Table 4.
Definitions of vocal load in the included publications
| # | Last Name, Year, Country | Definition of vocal load (vocal demand response) |
|---|---|---|
|
| ||
| 1 | Anand et al., 2019, USA | Alteration or modification in the combination of the three vocal parameters: fundamental frequency, intensity, and voice quality for a duration relatively less than 30 minutes |
| 2 | Jeremy et al., 2019, USA | Dose of time, dose of cycle, dose of distance, conditions of a place (room, living room), excessive noise and habits that add to health conditions that affect the vocal quality of a person |
| 3 | Okşan et al., 2020, Turkey | Use of the voice for long periods of time with a close relationship in cricoarytenoid constriction and stiffness |
| 4 | Ali et al., 2020, India | Prolonged use of voice |
| 5 | Swathy et al., 2017, India | Extensive use of the voice. Voice acoustic parameters used are fundamental frequency, disturbance measurements (jitter and shimmer), intensity (SPL) and harmonic ratio to noise during a workday |
| 6 | Xue et al., 2018, China | Several intrinsic factors, such as the duration of voice use, intensity of voice production, fundamental frequency. Extrinsic factors, such as room acoustics and ambient noise |
| 7 | Herndon et al., 2017, USA | Included aspects such as hydration level, background noise, vocal tone, and intensity |
| 8 | Rollins et al., 2019, USA | Vocal effort made according to environmental and organizational conditions to modify the voice in a communication context |
| 9 | Astolfi, 2018, Italy | Consequence of prolonged voice use under critical conditions, with contextual factors such as the number of people to be addressed and environmental factors, which generates a tendency to increase the loudness |
| 10 | Schiller et al., 2017, Belgium | Number of vocal demands for the phonatory system. Possibly determined mainly by the sound pressure level of the voice (SPL), fundamental frequency (FO) and phonation time |
| 11 | Pirilä et al., 2017, Finland | Occurs when a speaker unconsciously reacts to a noisy environment by changing the behavior of his voice |
| 12 | Mahalakshmi et al., 2018, India | Pollution of the environment, changes in temperature, energy, and noise, which the speaker must overcome by modifying his voice projection |
| 13 | Whitlinget al., 2016, Sweden | Vocal loading is said not only to be dependent on long phonation time at high intensity levels, but also appears to be dependent on long phonation time at high fundamental frequencies |
| 14 | Brinton et al., 2016, USA | The vocal load produces adverse changes in the aerodynamic, acoustic and perception measures of the listener, at the level of self-perceptual measures, which are related to vocal fatigue and has a significant impact on phonation |
| 15 | Boaz et al., 2015, Israel | Prolonged and intense use of the voice |
| 16 | Lima et al., 2015, Brazil | Use of the voice for long periods of time combined with internal and external factors of the participants |
| 17 | Puglisi et al., 2015, Italy | Related to room acoustics and noise in busy environments. Vocal load is also related to the time of the day, subject taught and number of students to whom voice is projected |
| 18 | Durup et al., 2015, Great Britain | Defined as related with the context and noise exposure |
| 19 | Cortes et al., 2014, Brazil | Use of the voice for a long time responding to an environment and its needs |
| 20 | Franca et al., 2014, USA | As excessive vocal use |
| 21 | Remacle et al., 2013, Belgium | The amount of voice that is used to perform in different scenarios. Vocal load is likely to contribute to the development of vocal fold damage due to potentially damaging tissue exposure to repeated vibrations |
| 22 | Acurio et al., 2014, Chile | Combination of prolonged use of the voice and additional factors, such as background noise, acoustics, and air quality, which affect the fo, mode and intensity of phonation, as well as the external frame of the larynx |
| 23 | Kankare et al., 2013, Egypt | It is the impact stress (force per unit area) that has been considered as the main load factor in the production of voice and has been reported to increase with adduction, the frequency fundamental (fo) and sound pressure level (SPL) |
| 24 | Franca, 2012, USA | Vocal loading is said not only to be dependent on long phonation time at high intensity levels, but also appears to be dependent on long phonation time at high fundamental frequencies |
| 25 | Astolfi et al., 2012, Italy | Amount of voice that the speakers make overtime |
| 26 | Remacle et al., 2011, Belgium | Acoustic vocal power integrated over time. The duration and the level of voice intensity are two knowns as load factors |
| 27 | Gaskill et al., 2011, USA | Accumulation of load that is due to prolonged time using the voice |
| 28 | Bottalico et al, 2011, Italy | Amount of voice over time |
| 29 | Morrow and Connor, 2010, USA | Demand placed on the vocal apparatus, due to the needs of the voice use, implying an integral calculation of the total phonation time and the total distance traveled by the vocal folds during their oscillation |
| 30 | Morrow and Connor, 2010, USA | Amount of vocal work quantify by the vibration of the vocal folds during phonation, including the phonation time, the fundamental frequency, and the amplitude of vibration of the vocal folds |
| 31 | Bottalico et al., 2010, Italy | Using your voice for long periods |
| 32 | Lei et al., 2020, Canada | Prolonged use of the voice in different tasks, imposing changes in its performance |
| 33 | Echternach et al., 2020, Germany | Use of the voice in diverse types of tasks at a given time, reflecting changes in the left and right symmetry, the opening and closing dynamics in the vocal folds, the vocal load being important for the health of the voice |
| 34 | Sundarrajan et al., 2017, India | Duration of voice production considering the environment, it is also seen in the use of voice tasks that stress the larynx and compromise its function |
| 35 | Abi and Santosh, 2020, India | Referred to stress conditions that challenge proper laryngeal functioning, leading to changes and physiological limits through the manipulation of external and internal factors |
| 36 | Pacheco and Behlau, 2018, Brazil | Using your voice for long periods |
| 37 | Whitling et al., 2014, Sweden | Combination of prolonged use of the voice with added load factors, such as high phonation at high sound pressure levels |
| 38 | Järvinen and Laukkanen, 2015, Finland | Result of a combination of factors in the excessively prolonged use of the voice, the high tone and intensity and a type of pressed phonation, implying a greater impact tension in the tissue of the strings vowels |
| 39 | Fornhammar et al., 2020, Germany | Using your voice for extended periods or at extremely high pitches |
| 40 | Echternach et al., 2013, Germany | Time of production of the voice for prolonged periods of time giving demand to a context or a situation |
| 41 | Grillo et al., 2016, USA | Continuous repetition of postures of the vocal folds or excessive vibration of the tissues, especially in people who use their voice in a professional way, due to an intense high of vocal activity |
| 42 | Nacci et al., 2013, Italy | Combination of prolonged use of the voice and additional load factors (background noise, acoustics, air quality) that affect the fundamental frequency, the type and volume of phonation and the vibratory characteristics of the vocal folds |
| 43 | Remacle et al., 2014, Belgium | Amount of work done by the laryngeal mechanism over time, determined mainly by the duration, intensity, and frequency of the vocalization |
| 44 | Enflo et al., 2013, Sweden | Intensive and prolonged use of the voice without rest, including phonotraumatic behaviors |
| 45 | Mozzanica et al., 2017, Switzerland | Intensive use of the voice for an extended period of time |
| 46 | Lira et al., 2014, Italy | Combination of the duration of use of the voice and the environmental characteristics |
| 47 | Soedersten et al., 2014, Sweden | Long-term prolonged use of the voice including vocal symptoms |
| 48 | Delgado et al., 2017, Spain | Abuse of the qualities of the voice for very long periods of time |
| 49 | Ternström et al., 2016, Sweden | Abuse and misuse of the voice for extended periods of time |
| 50 | Buckley et al., 2014, Australia | Using your voice for extended periods of time |
| 51 | Lyberg et al., 2014, Belgium | Increased activities in voice function including increased SPL and decreased jitter and brightness |
| 52 | Phyland et al., 2014, USA | Effect of increasing the loudness and/or tone in the vocal folds, generating increased vibratory amplitude, describing phonatory activities at levels higher than usual |
| 53 | Szabo et al., 2013, Sweden | Use of the voice at elevated levels of fundamental frequency and phonation time during work, including comparisons with free time |
| 54 | Hanschmann et al., 2010, Germany | Exposure of the voice for extended periods, experienced by people with greater professional use of the voice |
Vocal demand response’s physiology/psychology/emotional state
The literature reports intrinsic physiological factors, such as excessive mucus production in the vocal folds, which may affect the vibratory characteristics. Changes in viscosity in the phonatory system could result in a decrease or increase of added load factors during daytime, moreover, it can cause discomfort in vocal production(34). Such factors as viscosity impacts highlighted the importance of studying long-term vocal load effects for quantification of voice use (35). The emotional state influences in terms of stress, anxiety, depression, and humor changes were identified as intrinsic or extrinsic factors that cause significant alterations during voice production (36).
The vocal load was also described as the intensive use of voice related to the so-called phonotraumatic behaviors, which can cause lesions or disorders in the tissue of the vocal folds (37). This causes a change in viscosity and stiffness, and biomechanical properties of vocal folds, leading to an increase in phonation threshold pressure and SPL. The result is an increased vibration rate of vocal folds and, therefore, an increase in fundamental frequency and potential phonotrauma(36). Vocal fold tissue trauma is caused by strong or prolonged vocal use, and it can be considered a cumulative time exposure problem. Other studies report vocal load as a cause of extensive or prolonged use of the voice at high loudness levels(38). Another factor that may contribute to phonotraumatic behavior is an increase in vocal fold viscoelastic properties, influenced by the tissue hydration level. There should be a balance between systemic and superficial mechanisms (i.e., between systemic hydration and vocal load, which is conducive to reducing adverse effects on vocal production)(21). Whitling (39) mentions that vocal load is also sensitive to age. There are also voice symptoms reported in the literature, such as neck and shoulder stiffness, exhaustion, and extra vocal work(40).
The literature shows different studies on physiological factors connected to the definition of vocal load. Greene (41) indicates a relationship between vocal load and cricoarytenoid muscle stiffness, which results in changes in vocal qualities. Other studies affirm that vocal load causes disorders in vocal folds due to highly damaging exposures caused by repetitive vibrations of vocal tissue(42). This has also been reported in studies conducted by Titze(43) and Remacle(44). When performing vocal load tasks, some studies report a negative influence of vocal load on laryngeal function, which also causes changes in voice quality(45). It has also been related to incorrect body posture, difficulties in breathing technique, and sleep disturbances(36). Vocal load denotes a demand response that is imposed on the phonatory system, with evident changes in sound pressure level (SPL), fundamental frequency (f0), and phonation time(46). These physiological characteristics cause effort in the laryngeal mechanism which produces elevated levels of impact stress, as a consequence of prolonged phonation time at high fundamental frequency(39). Vocal loading tasks produce vocal load represented in changes in aerodynamic, acoustic, and vocal self-perception measures, as well as listener perception(21).
Voice parameters used to describe vocal load (vocal demand response)
Table 2 shows the vocal parameters reported as used to determine voice production and vocal load in the included publications. For the assessment of physiological and biomechanical parameters, examinations such as laryngoscopy (invasive), allow detailed identification of vocal fold alterations; whereas electroglottography (non-invasive) provides evidence of biomechanical variation of vocal fold contact during phonation, and could provide information indirectly related to vocal folds impact stress, which allows a voice quality distinction(47). The literature also reports the implementation of non-conventional equipment such as the VoxLog and other ambulatory devices, to measure the vocal load of individuals during a specific time(46).
Among the acoustic parameters used to assess the vocal load, the most reported were Sound Pressure Level (SPL), Fundamental Frequency (f0), Cepstral Peak Prominence (CPP), jitter, shimmer, amplitude variation, Voice Turbulence Index (VTi), Soft Phonation Index (SPI), Frequency Tremor Index (FTri), Amplitude Tremor Index (ATri), degree of voice pauses (dVB), and degree of subharmonics (dSh). These parameters were analyzed for statistical metrics, assessing the variation of vocal behavior and quality(48). Typically, such measures are assessed before and after vocal loading tasks and have been used with low and high loading conditions. These parameters are good proxies for different voice qualities that are based on the time, frequency, and amplitude of a quasi-periodic acoustic signal and are usually measured through sustained vowels or connected speech(36). One crucial element when measuring voice acoustic parameters of vocal load (vocal demand response) is the instrument used (microphone, accelerometer, software, etc.). One study assessed the within-subject variability of voice measures captured using different recording devices (i.e., smartphones and head-mounted microphones) and software (i.e., Analysis of Dysphonia in Speech and Voice (ADSV), Multi-dimensional Voice Program (MDVP), and Praat). The authors reported no significant within-subject variability across devices and software and that some of the parameters were highly correlated across software. Moreover, even though different algorithms are used to compute voice parameters across software, there are some standards across programs and parameters(21,45).
Among the physiological parameters that allow analyzing the biomechanics of vibration in the vocal folds, the literature reports: H1-H2, which indirectly determines the time that the vocal folds are open during a phonation cycle; and open quotient (OQ) related to the presence of breathiness in vocal quality(49).
Aerodynamic measurements were also reported to characterize vocal load. These measurements are related to air pressure and airflow across the vocal folds during phonation(50). According to (17), Phonation Pressure Threshold (PTP) measures biomechanical changes that are affected by subglottal pressure on the vocal folds. Analysis with this measure includes functional and structural voice difficulties, from variation in vocal fold thickness, pre-phonatory glottal width, and mucosal wave velocity. PTP is consistently sensitive to vocal load effects in healthy voices(37). Aerodynamic and myoelastic interaction at the level of the vocal folds allows for estimating the mechanical loading of the epithelium. Therefore, it could enrich voice diagnostics, especially for voice professionals. However, as normative PTP data are still lacking, it is not possible to make comparisons between individuals to establish differences in vocal load(51).
In addition to parameters describing mechanics and aerodynamic processes, questionnaires have been also used to identify voice symptoms associated with high vocal demands, and therefore vocal demand responses. These instruments also help the clinician/researcher to determine possible associated factors of vocal load. This review identified that self-reports vary according to the objective of each research. For example, while some surveys seek to obtain voice health indicators by eliciting daily answers from the participants after a clinical or in situ loading activity(52), others are used as questionnaires in the search for voice intensity, environmental noise, manifestations of vocal symptoms (throat pain, dysphonia, stridency, neck stiffness, headache, and general illness), which become key indicators to identify vocal characteristics of each subject(38).
Vocal demands (factors) associated with vocal demand response
Analysis of vocal demands reported in the literature included two main groups: (1) environmental factors, and (2) occupational voice use.
1. Environmental factors
The literature suggests an association between vocal load, work performance, and work environment. Acoustics, background noise, humidity, and social environment may increase vocal sound pressure levels(53),(45), as well as vocal effort associated with occupational voice use(54). These factors affect the fundamental frequency and vibratory properties of the vocal folds, which implies a further increase in impact stress (46),(55),(56).
2. Occupational voice use
The literature on vocal demand response in the occupational context identified 5 occupations with higher vocal demands, and therefore, VDRs: (1) teachers, (2) student teachers, (3) singers, street sellers, and broadcasters, (4) physicians, and (5) commercial consultants.
Teachers represented one of the occupations with higher vocal demands and less training on voice use (1,5,34,35,38,44,46–48,53,56–69) compared to other occupations and the general population (70),(52),(71). Studies have highlighted the effect of classroom acoustics, lower self-monitoring of voice production, and poor implementation of voice disorders preventive programs on teachers’ vocal effort (34,48,70).
Another important group of occupational voice users is the student teachers(53,72). These students compared with students from other fields have higher vocal demands associated with psychological factors (stress and anxiety), social factors (family and friends), and extended voice use in different contexts(52).
A third group of occupational voice users included singers, street sellers, and broadcasters(5,36,42,49,51,51,57,72–75). Singing is considered a task with high vocal demand. Therefore, singers have an increased risk of developing voice disorders due to vocal demands that include physical and psychological aspects. Reports of inadequate vocal demand responses with an excessive phonatory effort at the beginning of their training are common(73).
Physicians conformed the fourth, and less represented group(42). Among these workers, the occupational voice used during their direct interactions with patients (mediated by oral communication, expository speeches, and high voice demand) determines their occupational vocal demands. Length of career, the number of external consultations worked during the week, and medical specialty area has been also found associated with vocal fatigue(42).
Commercial consultants conformed to the fifth group(76). Commonly reported symptoms among these workers are hoarseness, decreased brightness, vocal fatigue, odynophagia, and the general sensation of tension. The above respond to possible changes in the laryngeal tissue. Frequent signs and symptoms of vocal fatigue are observed in this population, due to excessive and inadequate use of voice(76).
Part Three
Meta-analysis
Figure 6 shows the Forest plot of fundamental frequency among teachers with different vocal demands. The results indicate a trend towards slightly higher values of fundamental frequency among teachers with higher vocal demands; however, this difference was not found to be statistically significant. The heterogeneity analysis revealed substantial heterogeneity among the included studies, with an I2 value of 97% and a statistically significant p-value.
Figure 6.

Forest plot of fundamental frequency among teachers with different vocal demands
In Figure 7, the Forest plot displays the synthesis of sound pressure levels among teachers with different vocal demands. The results indicate that teachers with higher vocal demands tend to speak slightly softer (−1.11 mean difference) compared to those with lower vocal demands. However, similar to the fundamental frequency analysis, this difference was not statistically significant, and there was a high level of heterogeneity observed (82%).
Figure 7.
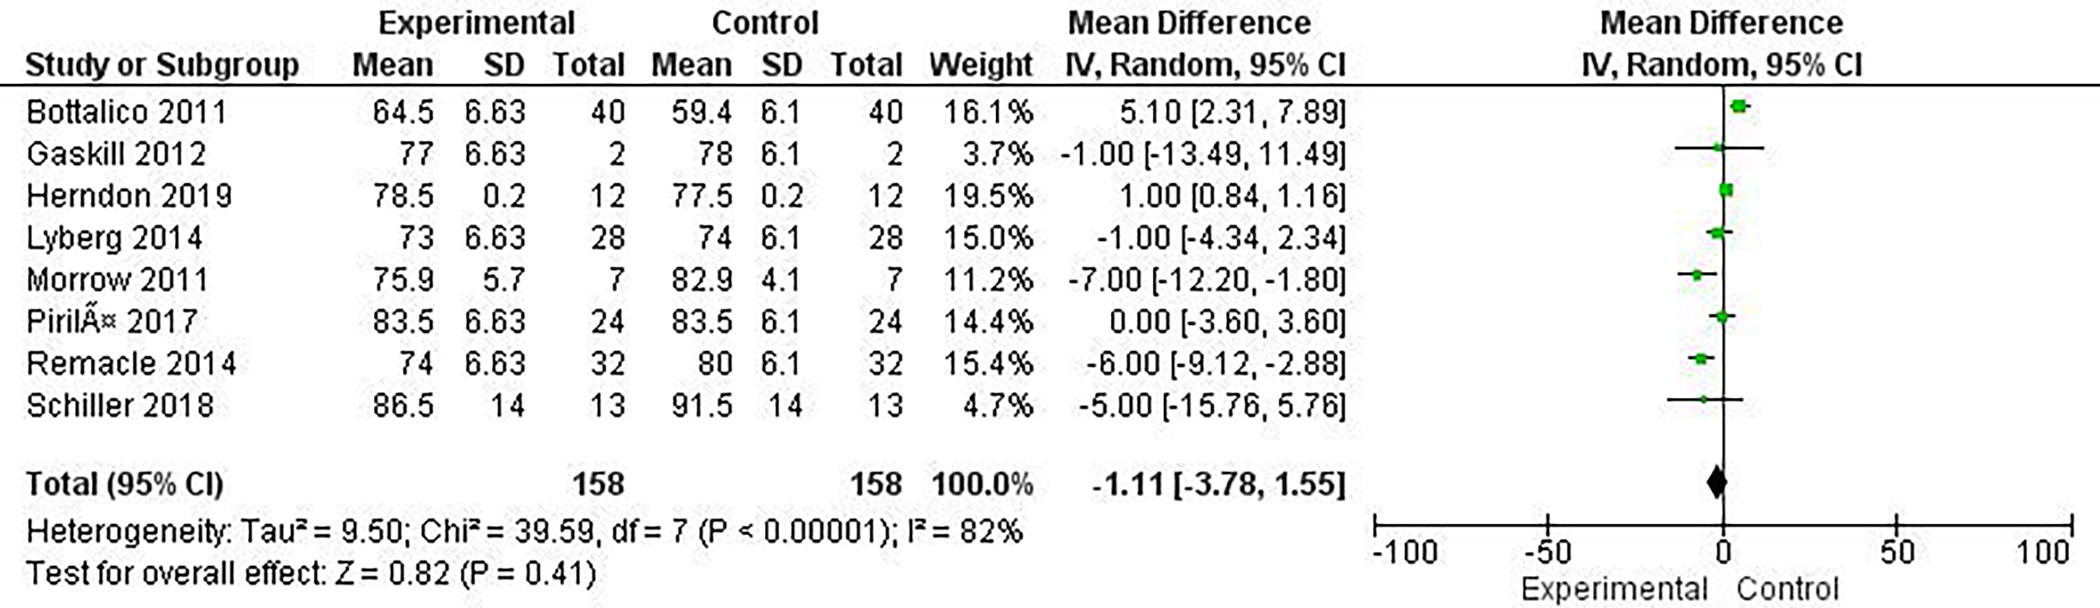
Forest plot of Sound Pressure Levels among teachers with different vocal demands
A sensitivity analysis was conducted to evaluate the robustness and stability of the findings and to assess the potential influence of specific studies or methodological factors on the results. This analysis allowed for a thorough examination of the impact of individual studies on the overall results, suggesting the reliability and validity of the synthesized findings.
Risk assessment
Publication bias was evaluated in the meta-analysis through the examination of funnel plots (Figures 8 and 9). The funnel plots visually depict the relationship between the estimated effects of vocal demand from individual studies and a measure of study size. In both figures, no clear asymmetry is observed, indicating no significant publication bias. However, it is worth noting that several studies focusing on fundamental frequency analysis were located outside the funnel plot, suggesting potential publication bias or other sources of heterogeneity. Further exploration and consideration of these studies’ characteristics are warranted to better understand their impact on the overall findings.
Figure 8.

Funnel plot of fundamental frequency among teachers with different vocal demands
Figure 9.
Funnel plot of Sound Pressure Levels among teachers with different vocal demands
Discussion
The aim of this study was to conduct a systematic review of the literature, in order to identify physiological explanations, reported measurements, and associated factors (vocal demands) concerning a vocal demand response. The results insights into the understanding of vocal demand response, encompassing the physiology, measurements, and associated factors in the existing literature. However, it is important to acknowledge and address certain limitations that emerged during this research. In the following, we discuss these limitations, focusing on the high heterogeneity observed, segmented bias assessment, language restrictions, and the lack of clarity and standardization in the concept of vocal load, which justify the utilization of the proposed concept of “vocal demand” and highlight the challenges in defining protocols and unifying criteria for quantitative evaluation within this field of knowledge.
Not all papers were included in the meta-analysis due to the high heterogeneity observed among the studies included in this research. This heterogeneity arises from variations in sample sizes and the different vocal demands assessed in the studies. Additionally, each study employed specific established methods to address the vocal response to demand, further contributing to the observed variability. Although exhaustive efforts were made to include as many relevant studies as possible, this limitation underscores the need to carefully consider heterogeneity when interpreting the results of the meta-analysis.
A bias assessment was conducted on the included articles in the systematic review; however, this assessment was performed in a segmented manner. While adhering to the established PRISMA protocol, it is important to highlight that bias evaluation can be subjective in certain aspects and is reliant on the availability and quality of information reported in the primary studies. Therefore, despite efforts made to minimize bias in study selection and evaluation, it is acknowledged that there exist some limitations in the comprehensive assessment of bias.
On the other hand, the systematic review was limited to studies published in Spanish and English. This may have excluded relevant research published in other languages that could contribute to the state of the art regarding vocal response to demand. We acknowledge that there may be a wealth of information in other languages, and the investigators’ lack of proficiency in these languages restricted the inclusion of such studies. Therefore, it is suggested that future research consider the inclusion of articles in other languages to obtain a more comprehensive understanding of the topic.
Finally, it is important to note, the high heterogeneity found in the meta-analysis highlights the lack of clarity and standardization in the concepts of “vocal load” and “vocal loading” used in the literature. This lack of consensus hampers the definition of protocols and the establishment of criteria for quantitative evaluation of the literature in this field of knowledge. To address this limitation, the concept of “vocal demand” and “vocal demand response”, was proposed and utilized as an alternative that encompasses and clarifies the various aspects related to “vocal load”. However, it is acknowledged that this definition may still be subject to discussion and refinement in future research.
Conclusion
As would be expected since vocal demand response is a relatively new term and not yet commonly used in literature when discussing the way that the speakers respond to the communicative scenarios, most of the studies reviewed (both historical and recent) still use the term of vocal load and vocal loading. Although there is a broad variety of literature discussing a wide range of vocal demands and voice parameters used to characterize the vocal demand response, results show that there is consistency across the studies. While vocal demand response is unique and intrinsic to the talker, associated factors that contribute to this response include both internal talker and external talker factors. Internal factors include muscle stiffness, viscosity in the phonatory system, vocal fold tissue damage, high sound pressure levels during occupational voice use, long periods of voice use, incorrect body posture, difficulties in breathing technique, and sleep disturbances. External factors include the working environment (noise, acoustics, temperature, humidity). In conclusion, although vocal demand response is intrinsic to the speaker, the communication process determines that this response is affected by external vocal demands. However, due to the wide methods to evaluate vocal demand response, it has been difficult to establish its contribution to voice disorders in the general population, and specifically, among occupational voice users. This literature review identified commonly reported parameters and factors that may help clinicians and researchers to define vocal demand response. A review of the physiological, psychological, and emotional features associated with vocal demand response, allows a better understanding of vocal behavior among clinicians. Recognizing the parameters used to describe VDR results in improved clinical practice for the assertive diagnosis and treatment of vocal disorders under quality therapeutic principles. Finally, a conceptual framework of the environmental factors and occupational use of the voice associated with VDR allows us to make correct decisions in the health and safety framework of people who use the voice as a work tool.
Figure 5.

Co-occurrence network
Acknowledgment
The authors would like to thank Pahola Valenzuela for her help with this project.
Funding Sources
The research reported in this publication was in part supported by Corporación Universitaria Iberoamericana – Dirección de Investigaciones, under research grant number 202110D035 “Parameters for quantifying vocal demand response”, and the National Institute of Deafness and Other Communication Disorders of the National Institutes of Health under Award Number R01DC012315. The content is solely the responsibility of the authors and does not necessarily represent the official views of the National Institutes of Health.
Footnotes
Conflict of Interest Statement
The authors have no conflicts of interest to declare.
Statement of Ethics
An ethics statement is not applicable because this study is based exclusively on published literature. The authors have no ethical conflicts to disclose.
Data Availability Statement
All data generated or analyzed during this study are included in this paper. For more information, please contact the corresponding author.
References
- 1.Alexander SA, Shetty PP, Mathew K. Acoustic Analysis of Indian Teachers’ Voice: Pre and Post Teaching Circumstances. Indian Journal of Otolaryngology and Head and Neck Surgery. 2019;71:100–3. [DOI] [PMC free article] [PubMed] [Google Scholar]
- 2.Hunter EJ, Cantor-Cutiva LC, van Leer E, van Mersbergen M, Nanjundeswaran CD, Bottalico P, et al. Toward a Consensus Description of Vocal Effort, Vocal Load, Vocal Loading, and Vocal Fatigue. J Speech Lang Hear Res. 2020. Feb 26;63(2):509–32. [DOI] [PMC free article] [PubMed] [Google Scholar]
- 3.Patel Rita R, Awan Shaheen N, Julie Barkmeier-Kraemer, Mark Courey, Dimitar Deliyski, Tanya Eadie, et al. Recommended Protocols for Instrumental Assessment of Voice: American Speech-Language-Hearing Association Expert Panel to Develop a Protocol for Instrumental Assessment of Vocal Function. American Journal of Speech-Language Pathology. 2018. Aug 6;27(3):887–905. [DOI] [PubMed] [Google Scholar]
- 4.Whitling S, Rydell R, Lyberg Åhlander V. Design of a Clinical Vocal Loading Test With Long-Time Measurement of Voice. Journal of Voice. 2015. Mar;29(2):261.e13–261.e27. [DOI] [PubMed] [Google Scholar]
- 5.Pacheco C, Behlau M. Immediate Impact of Vocal Demand on Musical Theater Singers in Brazil. J Voice. 2019. Sep;33(5):804.e13–804.e22. [DOI] [PubMed] [Google Scholar]
- 6.Crow KM, van Mersbergen M, Payne AE. Vocal Congruence: The Voice and the Self Measured by Interoceptive Awareness. J Voice. 2021. Mar;35(2):324.e15–324.e28. [DOI] [PubMed] [Google Scholar]
- 7.Roy N, Bless DM, Heisey D. Personality and voice disorders: a multitrait-multidisorder analysis. J Voice. 2000. Dec;14(4):521–48. [DOI] [PubMed] [Google Scholar]
- 8.Hunter EJ, Berardi ML, van Mersbergen M. Relationship Between Tasked Vocal Effort Levels and Measures of Vocal Intensity. J Speech Lang Hear Res. 2021. Jun 4;64(6):1829–40. [DOI] [PMC free article] [PubMed] [Google Scholar]
- 9.Solomon NP. Vocal fatigue and its relation to vocal hyperfunction. International Journal of Speech-Language Pathology. 2008. Jan;10(4):254–66. [DOI] [PubMed] [Google Scholar]
- 10.Pearl Solomon N, Stemmle DiMattia M. Effects of a vocally fatiguing task and systemic hydration on phonation threshold pressure. Journal of Voice. 2000. Sep;14(3):341–62. [DOI] [PubMed] [Google Scholar]
- 11.Beckford Wassink A, Wright RA, Franklin AD. Intraspeaker variability in vowel production: An investigation of motherese, hyperspeech, and Lombard speech in Jamaican speakers. Journal of Phonetics. 2007. Jul 1;35(3):363–79. [Google Scholar]
- 12.Amazi DK, Garber SR. The Lombard sign as a function of age and task. J Speech Hear Res. 1982. Dec;25(4):581–5. [DOI] [PubMed] [Google Scholar]
- 13.Vilkman E. Occupational Safety and Health Aspects of Voice and Speech Professions. Folia Phoniatr Logop. 2004;56(4):220–53. [DOI] [PubMed] [Google Scholar]
- 14.Fryd AS, Van Stan JH, Hillman RE, Mehta DD. Estimating Subglottal Pressure From Neck-Surface Acceleration During Normal Voice Production. J Speech Lang Hear Res. 2016. Dec 1;59(6):1335–45. [DOI] [PMC free article] [PubMed] [Google Scholar]
- 15.Niebudek-Bogusz E, Kotyło P, Politański P, Śliwińska-Kowalska M. Acoustic Analysis with Vocal Loading Test in Occupational Voice Disorders: Outcomes Before and After Voice Therapy. International Journal of Occupational Medicine and Environmental Health [Internet]. 2008. Jan 1 [cited 2021 Nov 24];21(4). Available from: http://www.imp.lodz.pl/home_en/publishing_office/journals_/_ijomeh/&articleId=20989&l=PL [DOI] [PubMed] [Google Scholar]
- 16.Laukkanen AM, Ilomäki I, Leppänen K, Vilkman E. Acoustic Measures and Self-reports of Vocal Fatigue by Female Teachers. Journal of Voice. 2008. May;22(3):283–9. [DOI] [PubMed] [Google Scholar]
- 17.Xue C, Kang J, Hedberg C, Zhang Y, Jiang JJ. Dynamically Monitoring Vocal Fatigue and Recovery Using Aerodynamic, Acoustic, and Subjective Self-Rating Measurements. Journal of Voice. 2019;33(5):809.e11–809.e18. [DOI] [PubMed] [Google Scholar]
- 18.Hashimoto PT, Pagan-Neves L de O, Teixeira de Jesus LM, Wertzner HF. Aerodynamic, eletroglottographic and acoustic measures of the voiced postalveolar fricative. CODAS. 2018;30(3). [DOI] [PubMed] [Google Scholar]
- 19.Dastolfo C, Gartner-Schmidt J, Yu L, Carnes O, Gillespie AI. Aerodynamic Outcomes of Four Common Voice Disorders: Moving Toward Disorder-Specific Assessment. JOURNAL OF VOICE. 2016. May;30(3):301–7. [DOI] [PubMed] [Google Scholar]
- 20.Iwarsson J, Thomasson M, Sundberg J. Effects of lung volume on the glottal voice source. Journal of Voice. 1998. Jan 1;12(4):424–33. [DOI] [PubMed] [Google Scholar]
- 21.Fujiki RB, Chapleau A, Sundarrajan A, McKenna V, Sivasankar MP. The Interaction of Surface Hydration and Vocal Loading on Voice Measures. Journal of Voice. 2017;31(2):211–7. [DOI] [PubMed] [Google Scholar]
- 22.Chan RW, Tayama N. Biomechanical effects of hydration in vocal fold tissues. Otolaryngol Head Neck Surg. 2002. May;126(5):528–37. [DOI] [PubMed] [Google Scholar]
- 23.Santana ER, Masson MLV, Araujo TM. The Effect of Surface Hydration on Teachers’ Voice Quality: An Intervention Study. J Voice. 2017. May;31(3):383.e5–383.e11. [DOI] [PubMed] [Google Scholar]
- 24.Salturk Z, Kumral TL, Aydoğdu I, Arslanoğlu A, Berkiten G, Yildirim G, et al. Psychological effects of dysphonia in voice professionals. Laryngoscope. 2015. Aug;125(8):1908–10. [DOI] [PubMed] [Google Scholar]
- 25.Suire A, Raymond M, Barkat-Defradas M. Male Vocal Quality and Its Relation to Females’ Preferences. Evol Psychol. 2019. Sep;17(3):1474704919874675. [DOI] [PMC free article] [PubMed] [Google Scholar]
- 26.Rubin AD, Praneetvatakul V, Gherson S, Moyer CA, Sataloff RT. Laryngeal hyperfunction during whispering: reality or myth? J Voice. 2006. Mar;20(1):121–7. [DOI] [PubMed] [Google Scholar]
- 27.Richter B, Nusseck M, Spahn C, Echternach M. Effectiveness of a Voice Training Program for Student Teachers on Vocal Health. Journal of Voice. 2016;30(4):452–9. [DOI] [PubMed] [Google Scholar]
- 28.Project EPHP. Quality assessment tool for quantitative studies. National Collaborating Centre for Methods and Tools, McMaster University, Hamilton, Ontario. 1998; [Google Scholar]
- 29.Deeks JJ. Issues in the selection of a summary statistic for meta-analysis of clinical trials with binary outcomes. Stat Med. 2002. Jun 15;21(11):1575–600. [DOI] [PubMed] [Google Scholar]
- 30.The Nordic Cochrane Centre, The Cochrane Collaboration. Review Manager (RevMan) [Internet]. Copenhagen; 2014. Available from: https://community.cochrane.org/help/tools-and-software/revman-5 [Google Scholar]
- 31.Ryan R. Cochrane Consumers and Communication Review Group. Heterogeneity and subgroup analyses in Cochrane Consumers and Communication Group reviews: planning the analysis at protocol stage [Internet]. 2016. Available from: http://cccrg.cochrane.org
- 32.Sterne JAC, Becker BJ, Egger M. The Funnel Plot. In: Publication Bias in Meta-Analysis: Prevention, Assessment and Adjustments. United States: John Wiley & Sons, Inc; 2006. p. 73–98. [Google Scholar]
- 33.Sedgwick P. Meta-analyses: how to read a funnel plot. BMJ. 2013. Mar 1;346:f1342. [DOI] [PubMed] [Google Scholar]
- 34.Astolfi A, Bottalico P, Accornero A, Garzaro M, Nadalin J, Giordano C. Relationship between vocal doses and voice disorders on primary school teachers. In: Proceedings - European Conference on Noise Control [Internet]. 2012. p. 55–60. Available from: https://www.scopus.com/inward/record.uri?eid=2-s2.0-84865998640&partnerID=40&md5=46c313f89c4f2a9b4b6ad9505f887952 [Google Scholar]
- 35.Nacci A, Fattori B, Mancini V, Panicucci E, Ursino F, Cartaino FM, et al. The use and role of the Ambulatory Phonation Monitor (APM) in voice assessment. Acta Otorhinolaryngol Ital. 2013. Feb;33(1):49–55. [PMC free article] [PubMed] [Google Scholar]
- 36.Anand S, Bottalico P, Gray C. Vocal Fatigue in Prospective Vocal Professionals. Journal of Voice. 2021;35(2):247–58. [DOI] [PubMed] [Google Scholar]
- 37.Enflo L, Sundberg J, McAllister A. Collision and phonation threshold pressures before and after loud, prolonged vocalization in trained and untrained voices. J Voice. 2013. Sep;27(5):527–30. [DOI] [PubMed] [Google Scholar]
- 38.Bottalico P, Astolfi A, Bronuzzi F, La Malva F. Vocal load investigations on primary school teachers. In: Proceedings of Forum Acusticum [Internet]. 2011. p. 61–6. Available from: https://www.scopus.com/inward/record.uri?eid=2-s2.0-84866052903&partnerID=40&md5=d0fd0b3ccfebe4dac10278243feb3c20 [Google Scholar]
- 39.Whitling S, Lyberg-Åhlander V, Rydell R. Long-Time Voice Accumulation During Work, Leisure, and a Vocal Loading Task in Groups With Different Levels of Functional Voice Problems. Journal of Voice. 2017;31(2):246.e1–246.e10. [DOI] [PubMed] [Google Scholar]
- 40.Ali I, Hussain RT, Wagay FA, Ahmad R. Muscle Tension Dysphonia: Experience from a Conflict Zone. Indian Journal of Otolaryngology and Head and Neck Surgery [Internet]. 2020; Available from: https://www.scopus.com/inward/record.uri?eid=2-s2.0-85088971541&doi=10.1007%2fs12070-020-02007-4&partnerID=40&md5=070cf5828df2eeaf08f7e019ba629769 [DOI] [PMC free article] [PubMed]
- 41.Mathieson L, ProQuest (Firm). Greene and Mathieson’s the voice and its disorders [Internet]. 6th ed, Lesley Mathieson. London: Whurr; 2001. [cited 2021 Nov 18]. Available from: http://find.shef.ac.uk/openurl/44SFD/44SFD_services_page?u.ignore_date_coverage=true&rft.mms_id=9982603602301441 [Google Scholar]
- 42.Erkan SO, Tuhanioglu B. Vocal fatigue in doctors: evaluation with subjective and objective acoustic parameters. Logopedics Phoniatrics Vocology. 2021;46(1):35–41. [DOI] [PubMed] [Google Scholar]
- 43.Titze IR, Švec JG, Popolo PS. Vocal Dose Measures: Quantifying Accumulated Vibration Exposure in Vocal Fold Tissues. J Speech Lang Hear Res. 2003. Aug;46(4):919–32. [DOI] [PMC free article] [PubMed] [Google Scholar]
- 44.Remacle A, Morsomme D, Finck C. Comparison of vocal loading parameters in kindergarten and elementary school teachers. Journal of Speech, Language, and Hearing Research. 2014;57(2):406–15. [DOI] [PubMed] [Google Scholar]
- 45.Sundarrajan A, Fujiki RB, Loerch SE, Venkatraman A, Sivasankar MP. Vocal Loading and Environmental Humidity Effects in Older Adults. J Voice. 2017. Nov;31(6):707–13. [DOI] [PubMed] [Google Scholar]
- 46.Schiller IS, Morsomme D, Remacle A. Voice Use Among Music Theory Teachers: A Voice Dosimetry and Self-Assessment Study. Journal of Voice. 2018;32(5):578–84. [DOI] [PubMed] [Google Scholar]
- 47.Portela AS, Hammarberg B, Sodersten M. Speaking Fundamental Frequency and Phonation Time during Work and Leisure Time in Vocally Healthy Preschool Teachers Measured with a Voice Accumulator. FOLIA PHONIATRICA ET LOGOPAEDICA. 2013;65(2):84–90. [DOI] [PubMed] [Google Scholar]
- 48.Astolfi A. Trajectories in classroom acoustics: Vocal behavior of teachers. Canadian Acoustics - Acoustique Canadienne. 2019;47(1):87–90. [Google Scholar]
- 49.Nascimento CL, Constantini AC, Mourão LF. Vocal Effects in Military Students Submitted to an Intense Recruit Training: A Pilot Study. Journal of Voice. 2016;30(1):61–9. [DOI] [PubMed] [Google Scholar]
- 50.Bottalico P, Garcia DP, Astolfi A, Brunskog J. Measurement of vocal doses in virtual classrooms. In: 39th International Congress on Noise Control Engineering 2010, INTER-NOISE 2010 [Internet]. 2010. p. 913–22. Available from: https://www.scopus.com/inward/record.uri?eid=2-s2.0-84868662776&partnerID=40&md5=97646751b2b8e014cf881230b8e0717b [Google Scholar]
- 51.Fornhammar L, Sundberg J, Fuchs M, Pieper L. Measuring Voice Effects of Vibrato-Free and Ingressive Singing: A Study of Phonation Threshold Pressures. J Voice. 2020. Oct 15; [DOI] [PubMed] [Google Scholar]
- 52.Manternach JN, Schloneger MJ. Vocal Dose of Preservice Music Therapists, Preservice Music Teachers, and Other Undergraduate Students. Journal of Voice. 2021;35(2):328.e1–328.e10. [DOI] [PubMed] [Google Scholar]
- 53.Echternach M, Nusseck M, Dippold S, Spahn C, Richter B. Fundamental frequency, sound pressure level and vocal dose of a vocal loading test in comparison to a real teaching situation. Eur Arch Otorhinolaryngol. 2014. Dec;271(12):3263–8. [DOI] [PubMed] [Google Scholar]
- 54.Côrtes Gama AC, Camargo Z, Rocha Santos MA, Carlos Rusilo L. Discriminant capacity of acoustic, perceptual, and vocal self: The effects of vocal demands. Journal of Voice. 2015;29(2):260.e45–260.e50. [DOI] [PubMed] [Google Scholar]
- 55.Järvinen K, Laukkanen AM. Vocal Loading in Speaking a Foreign Language. Folia Phoniatr Logop. 2015;67(1):1–7. [DOI] [PubMed] [Google Scholar]
- 56.Thomas SA, Maruthy S. Comparison of Habitual and High Pitch Phonation in Teachers With and Without Vocal Fatigue. J Voice. 2020. May 13; [DOI] [PubMed] [Google Scholar]
- 57.Herndon NE, Sundarrajan A, Sivasankar MP, Huber JE. Respiratory and Laryngeal Function in Teachers: Pre- and Postvocal Loading Challenge. Journal of Voice. 2019;33(3):302–9. [DOI] [PubMed] [Google Scholar]
- 58.Pirilä S, Pirilä P, Ansamaa T, Yliherva A, Sonning S, Rantala L. Relationship between Activity Noise, Voice Parameters, and Voice Symptoms among Female Teachers. Folia Phoniatrica et Logopaedica. 2018;69(3):94–102. [DOI] [PubMed] [Google Scholar]
- 59.Puglisi GE, Cantor Cutiva LC, Pavese L, Castellana A, Bona M, Fasolis S, et al. Acoustic comfort in high-school classrooms for students and teachers. In: Energy Procedia [Internet]. 2015. p. 3096–101. Available from: https://www.scopus.com/inward/record.uri?eid=2-s2.0-84962573541&doi=10.1016%2fj.egypro.2015.11.763&partnerID=40&md5=db0630074c376c6eb46d70877a6b07d1
- 60.Durup N, Shield BM, Dance S, Sullivan R. Vocal strain in UK teachers: An investigation into the acoustic causes and cures. In: Proceedings of Meetings on Acoustics [Internet]. 2013. Available from: https://www.scopus.com/inward/record.uri?eid=2-s2.0-84878984919&doi=10.1121%2f1.4799474&partnerID=40&md5=18c7c2a00413f1238565f4bf5d65c477 [Google Scholar]
- 61.Acurio J, Celis C, Perez J, Escudero C. Acoustic parameters and salivary IL-6 levels in overweight and obese teachers. Journal of Voice. 2014;28(5):574–81. [DOI] [PubMed] [Google Scholar]
- 62.Kankare E, Liu D, Laukkanen AM, Geneid A. EGG and acoustic analyses of different voice samples: Comparison between perceptual evaluation and voice activity and participation profile. Folia Phoniatrica et Logopaedica. 2014;65(2):98–104. [DOI] [PubMed] [Google Scholar]
- 63.Remacle A, Morsomme D, Berrué E, Finck C. Vocal Impact of a Prolonged Reading Task in Dysphonic Versus Normophonic Female Teachers. Journal of Voice. 2012. Nov;26(6):820.e1–820.e13. [DOI] [PubMed] [Google Scholar]
- 64.Gaskill CS, O’Brien SG, Tinter SR. The effect of voice amplification on occupational vocal dose in elementary school teachers. Journal of Voice. 2012;26(5):667.e19–667.e27. [DOI] [PubMed] [Google Scholar]
- 65.Morrow SL, Connor NP. Voice amplification as a means of reducing vocal load for elementary music teachers. Journal of Voice. 2011;25(4):441–6. [DOI] [PubMed] [Google Scholar]
- 66.Morrow SL, Connor NP. Comparison of voice-use profiles between elementary classroom and music teachers. Journal of Voice. 2011;25(3):367–72. [DOI] [PubMed] [Google Scholar]
- 67.Echternach M, Richter B, Traser L, Nusseck M. [Change of vocal capacity due to different vocal loading tests]. Laryngorhinootologie. 2013. Jan;92(1):34–40. [DOI] [PubMed] [Google Scholar]
- 68.Lira Luce F, Teggi R, Ramella B, Biafora M, Girasoli L, Calori G, et al. Voice disorders in primary school teachers. Acta Otorhinolaryngol Ital. 2014. Dec;34(6):412–8. [PMC free article] [PubMed] [Google Scholar]
- 69.Ahlander VL, Garcia DP, Whitling S, Rydell R, Lofqvist A. Teachers’ Voice Use in Teaching Environments: A Field Study Using Ambulatory Phonation Monitor. JOURNAL OF VOICE. 2014. Nov;28(6). [DOI] [PubMed] [Google Scholar]
- 70.Durap N, Shield B, Dance S, Sullivan R, Gomez-Agustina L. How classroom acoustics affect the vocal load of teachers. In: Energy Procedia [Internet]. 2015. p. 3084–9. Available from: https://www.scopus.com/inward/record.uri?eid=2-s2.0-84962495795&doi=10.1016%2fj.egypro.2015.11.761&partnerID=40&md5=1c9b3bef44235e23397d57df1f673c8b
- 71.Roy RA, Boucher JP, Comtois AS. COMPARISON OF PARASPINAL CUTANEOUS TEMPERATURE MEASUREMENTS BETWEEN SUBJECTS WITH AND WITHOUT CHRONIC LOW BACK PAIN. JOURNAL OF MANIPULATIVE AND PHYSIOLOGICAL THERAPEUTICS. 2013. Jan;36(1):44–50. [DOI] [PubMed] [Google Scholar]
- 72.Manternach JN, Schloneger MJ. Vocal Dose of Preservice Music Therapists, Preservice Music Teachers, and Other Undergraduate Students. J Voice. 2019. Nov 15; [DOI] [PubMed] [Google Scholar]
- 73.Franca MC, Wagner JF. Effects of vocal demands on voice performance of student singers. Journal of Voice. 2015;29(3):324–32. [DOI] [PubMed] [Google Scholar]
- 74.Buckley KL, O’Halloran PD, Oates JM. Occupational Vocal Health of Elite Sports Coaches: An Exploratory Pilot Study of Football Coaches. JOURNAL OF VOICE. 2015. Jul;29(4):476–83. [DOI] [PubMed] [Google Scholar]
- 75.Phyland DJ, Pallant JF, Thibeault SL, Benninger MS, Vallance N, Smith JA. Measuring Vocal Function in Professional Music Theater Singers: Construct Validation of the Evaluation of the Ability to Sing Easily (EASE). FOLIA PHONIATRICA ET LOGOPAEDICA. 2014;66(3):100–8. [DOI] [PubMed] [Google Scholar]
- 76.Ben-David BM, Icht M. Voice Changes in Real Speaking Situations during a Day, with and Without Vocal Loading: Assessing Call Center Operators. Journal of Voice. 2016;30(2):247.e1–247.e11. [DOI] [PubMed] [Google Scholar]
Associated Data
This section collects any data citations, data availability statements, or supplementary materials included in this article.
Data Availability Statement
All data generated or analyzed during this study are included in this paper. For more information, please contact the corresponding author.