

Abstract
Background
Malignant cells may arise from dedifferentiation of mature cells and acquire features of the progenitor cells. Definitive endoderm from which liver is derived, expresses glycosphingolipids (GSLs) such as stage-specific embryonic antigen 3 (SSEA3), Globo H, and stage-specific embryonic antigen 4 (SSEA4). Herein, we evaluated the potential prognosis value of the three GSLs and biological functions of SSEA3 in hepatocellular carcinoma (HCC).
Methods
The expression of SSEA3, Globo H, and SSEA4 in tumor tissues obtained from 328 patients with resectable HCC was examined by immunohistochemistry staining. Epithelial mesenchymal transition (EMT) and their related genes were analyzed by transwell assay and qRT-PCR, respectively.
Results
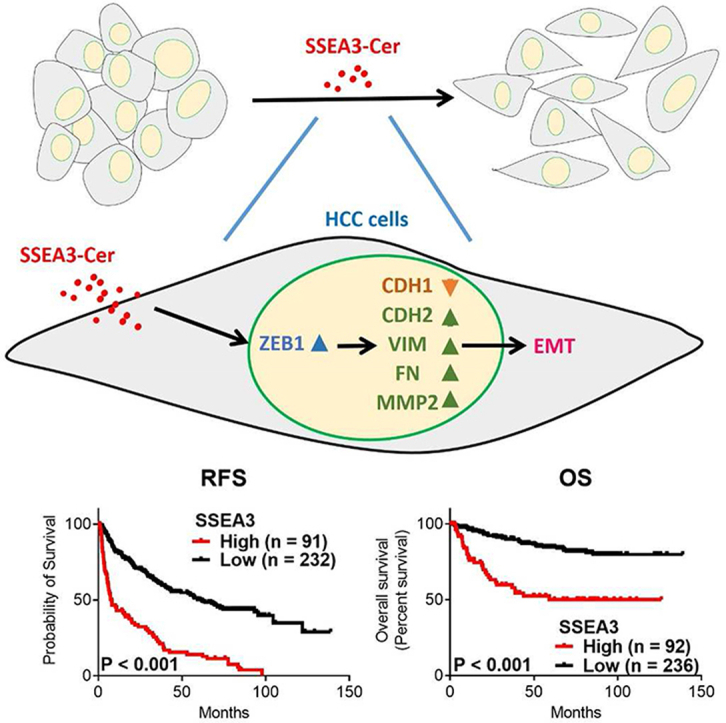
Kaplan Meier survival analysis showed significantly shorter relapse-free survival (RFS) for those with higher expression of SSEA3 (p < 0.001), Globo H (p < 0.001), and SSEA4 (p = 0.005) and worse overall survival (OS) for those with high expression of either SSEA3 (p < 0.001) or SSEA4 (p = 0.01). Furthermore, multivariable Cox regression analysis identified the SSEA3 as an independent predictor for RFS (HR: 2.68, 95% CI: 1.93–3.72, p < 0.001) and OS (HR: 2.99, 95% CI: 1.81–4.96, p < 0.001) in HCC. Additionally, SSEA3-ceramide enhanced the EMT of HCC cells, as reflected by its ability to increase migration, invasion and upregulate the expression of CDH2, vimentin, fibronectin, and MMP2, along with ZEB1. Moreover, ZEB1 silencing abrogated the EMT-enhancing effects of SSEA3-ceramide.
Conclusions
Higher expression of SSEA3 was an independent predictor for RFS and OS in HCC and promoted EMT of HCC via upregulation of ZEB1.
Keywords: SSEA3, Globo H, Hepatocarcinoma, Prognosis, EMT
Graphical abstract
At a glance of commentary.
Scientific background on the subject
Previous study demonstrated the hepatocellular carcinoma (HCC) patients with high mRNA expression level of Beta-1,3-galactosyltransferase 5 (B3GALT5), fucosyltransferase 1 (FUT1) or fucosyltransferase 2 (FUT2) had poor outcome. These genes encode key enzymes for the biosynthesis of stage-specific embryonic antigen 3 (SSEA3), Globo H, and stage-specific embryonic antigen 4 (SSEA4).
What this study adds to the field
Using immunohistochemical staining, we showed that HCC patients with high expression of either SSEA3, Globo H, or SSEA4 had poor clinical outcome. Multivariable Cox regression analysis identified SSEA3 expression as an independent predictor for relapse-free survival (RFS) and overall survival (OS) in HCC. To understand the biological role of SSEA3 in HCC, we synthesized SSEA3-ceramide (SSEA3Cer), and showed that incubation of HCC cells with SSEA3Cer enhanced the EMT of HCC cells, along with upregulation of CDH2, vimentin, fibronectin, MMP2, and ZEB1. SSEA3Cer-induced EMT was mediated by ZEB1 signaling. These data provided potential immunotherapeutic options for HCC patients with higher expression of SSEA3, Globo H, and SSEA4.
Liver cancer is the second leading cause of cancer-related deaths worldwide [1]. Hepatocellular carcinoma (HCC) is the most common type of primary malignancy of the liver and a major cause of death in many countries [2]. The risk of HCC was positively correlated with exposure to aflatoxin B, hepatitis B virus (HBV), and hepatitis C virus (HCV) infection [3]. Although the morbidity and mortality have improved with surgical resection, the tumor recurrence rates remain high, leading to poor outcome [4]. Clinically, α-fetoprotein, serum albumin, creatinine, bilirubin, alkaline phosphatase levels, presence of ascites, tumor size, tumor number, metastases and vascular invasion are major prognostic factor after hepatectomy in HCC [5]. With the advancement of various molecular biotechnologies, such as quantitative polymerase chain reaction (qPCR), mass spectrometry, enzyme-linked immunoassay and microarray based technology, several molecular profiles associated with HCC recurrence have been reported [6]. But these markers have yet to be put into clinical use. In recent years, the use of a multi-targeted kinase inhibitor, Sorafenib, has increased the survival of patients with advanced HCC [7]. The addition of immune checkpoint inhibitors, Nivolumab, Pembrolizumab, and Atezolizumab has also shown survival benefit [[8], [9], [10]]. Despite such advances, recurrence of HCC after surgical resection remains to be a challenge and contributes to a gloomy outcome. Therefore, it is important to investigate new markers for prognostication and therapy of patients with resectable HCC.
In general, malignant cells may arise from dedifferentiation of mature cells and acquire features of the progenitor cells. During embryonic development, the expression of complex globo-series glycosphingolipids (GSLs) including stage-specific embryonic antigen 3 (SSEA3), stage-specific embryonic antigen 4 (SSEA4), and Globo H is highly restricted to the primed state of human embryonic stem cells which disappear upon their differentiation into embryoid bodies, but re-emerged in definitive endoderm from which liver is derived [11]. Thus, it is highly likely that HCC may express these globosides. Indeed, in our previous report, mass spectrometry and IHC analyses showed the presence of SSEA3, Globo H, and SSEA4 in a few HCC specimens [12]. We had also demonstrated the adverse prognostic impacts of the expression of key biosynthetic enzymes for their biosynthesis in HCC, including Beta-1,3-galactosyltransferase 5 (B3GALT5), which generate SSEA3 from Gb4 [13], fucosyltransferase 1 (FUT1) or fucosyltransferase 2 (FUT2), which add a terminal fucose moiety to SSEA3, giving rise to Globo H [14]. These findings suggest that the expression levels of these globo-series GSLs may have prognostic significance in HCC.
In the present study, 328 HCC specimens were examined for the expression levels of SSEA3, Globo H, and SSEA4 by IHC staining and correlated with clinical variables and survival of patients. Our data demonstrated for the first time that higher expression of SSEA3, Globo H, or SSEA4 correlated with poorer clinical outcome in HCC patients after surgical resection. Notably, higher expression of SSEA3 was an independent prognostic factor for poor relapse-free survival (RFS) and overall survival (OS) in HCC. We further provided evidence of a key role of SSEA3-ceramide (SSEA3Cer) in promoting EMT of HCC cells.
Materials and methods
Clinical specimens
Individual tissue slides prepared from paraffin-embedded tumor specimens and associated clinical and pathological information from 328 patients with resectable stage I to IV HCC (Stage was classified by Guideline of American Joint committee on Cancer) were obtained from Tissue Bank of Linkou Chang Gung Memorial Hospital (Taoyuan, Taiwan) and Taiwan Liver Cancer Network. All 328 samples investigated are primary tumors obtained from treatment-naïve patients. Written Informed consent was obtained from all subjects before their tissues were deposited. All studies were performed in accordance with relevant guidelines and regulations and were approved by Institutional Review Board of Chang Gung Medical Foundation (IRB number: 201304758B0), Review Board of Tri-Service General Hospital, and Biobank Ethics Committee of National Health Research Institutes.
Synthesis of SSEA3-ceramide (SSEA3Cer) and globo H ceramide (GHCer)
SSEA3Cer with fatty acid tail 16:0 were prepared by modification of previously reported methods [15]. In brief, lactosyl sphingosine was assembled with sugars by chemo-enzymatic synthesis to generate globo H-sphingosine, which were then coupled with a fatty acid, respectively, to yield Globo H ceramide (GHCer) [16]. To prepare SSEA3Cer, GHCer was digested with α1, 2-fucosidase according to the manufacturer’s instructions. Briefly, GHCer was mixed with fucosidase in 1X GlycoBuffer1 (New England Biolabs, Ipswich, MA, USA) and incubated at 37 °C for 2 h. After incubation, the enzyme was inactivated at 100 °C for 10 min. Then, the digested GHCer was subjected to MS spectral analysis without further purification. SSEA3Cer and Glucosylceramide (GlcCer) with fatty acid tail 16:0 (860539P, Sigma–Aldrich, St. Louis, MO, USA) were dissolved in PBS to a concentration of 2 mg/mL. The Glycosphingolipids were aliquoted and stored at 4 °C until use.
Cell culture
Human HCC cell line Hep3B, HA22T, and HA59T were purchased from Bioresource Collection and Research Center (BCRC, Hsinchu, Taiwan). All cells were grown in MEM supplemented with 10% fetal bovine serum, 2 mM of l-glutamine, 100 U/mL of penicillin and 100 μg/mL of streptomycin in a humidified incubator containing 5% CO2 at 37 °C.
Immunohistochemistry
The primary antibodies used included the following: anti-SSEA3 (MC-631, R&D Systems, Minneapolis, MN), anti-Globo H, (VK9, hybridoma provided by Dr. Govindaswami Ragupathi, Memorial Sloan-Kettering Cancer Center, New York, NY), and anti-SSEA4 (MAB-1435, R&D Systems, Minneapolis, MN). IHC analysis was performed by LEICA BOND RXm stainer (Leica Biosystems, Vista, CA) according to the user protocols. Briefly, 3 μm formalin-fixed, paraffin-embedded tissue sections on coated slides were deparaffinized and rehydrated, then subjected to antigen retrieval by autoclave at 100 °C for 40 min in antigen Retrieval ER1 solution (Leica Biosystems, Vista, CA). Sections were treated with H2O2 and then incubated with primary antibodies at 37 °C overnight for 45 min, followed by staining with Polymer-HRP Detection System (DS9800 kit, Leica Biosystems, Vista, CA) a. Slides were counter-stained with hematoxylin (DS9800 kit, Leica Biosystems, Vista, CA) and mounted. Sections were examined by pathologists and digital images were captured by Aperio Scope AT Turbo Slide Scanner (Leica Biosystems, Vista, CA) at 40× magnification. The IHC was read by a certified pathologist, Dr. Yenlin Huang to determine the H score by the formula: 3 × percentage of strong staining + 2 × percentage of moderate staining + percentage of weak staining, giving a range of 0–300.
In vitro transwell assay
Transwell assay was assessed by cell migration chamber (#3422, Corning Incorporated Costar, Tewksbury, USA). Tumor Cells were suspended in serum free medium containing GlcCer control, SSEA3Cer, or SSEA3Cer/SSEA3 antibody and seeded (1 × 10⁵ cells per well) into upper chambers coated with or without Matrigel® (BD Biosciences, Franklin Lakes, NJ, USA) for invasion or migration assay, respectively. The complete medium was loaded in the lower chamber. After 24 h incubation at 5% CO2 and 37 °C, the migrated or invaded cells passing through the Transwell membrane were fixed in 4% paraformaldehyde for 15 min and stained with 1% crystal violet at room temperature for 20 min. The migrated or invaded cells were quantified by counting the number of cells on the Transwell membrane pores from five randomly selected different fields per sample detected by a light microscope (100× magnification).
EMT assays
HA22T, HA59T and Hep3B cells were cultured in 6-well plates in complete culture medium. After 24 h, cells were incubated with 30 μM GlcCer or SSEA3-Cer for 24 h to investigate their effects on EMT. Cell morphology changes were assessed by Phase contrast image captured by Leica DMI3000 B inverted microscope. The cell elongation ratios of sixty cells in each experiment was determined by calculating the ratio of cell length to cell width using ImageJ.
Flow cytometry
SSEA3Cer treated HA22T, HA59T, and Hep3B cells were stained with mAbSSEA3 (MC-631, R&D Systems, Minneapolis, MN) followed by FITC-conjugated goat anti-rat IgM as secondary antibody (Biolegend). SSEA3+ cells were analyzed by flow cytometry using SA3800 Spectral Cell Analyzer (Sony, Tokyo, Japan).
Reverse-transcription quantitative real-time polymerase chain reaction
HA22T, HA59T and Hep3B cells were incubated with GlcCer, SSEA3-Cer, SSEA3 antibody at the indicated concentration and time point. Total RNA was isolated using the WelPrep cell/tissue RNA kit (Welgene, Daegu, Korea) according to the manufacturer instructions. One microgram total RNA collected from HCC cells were converted to cDNA using high capacity cDNA reverse transcription kit (ref. 4368813, Thermo Fisher Scientific, NY, USA) according to the manufacturer’s instructions. Expression of mRNA, including CDH1, CDH2, VIM, FN, MMP2, SNAIL, TWIST1, and ZEB1, was determined by Fast SYBR Green Master Mix (Applied Biosystems, CA, USA). Primer pairs for CDH1 (HP207683), CDH2 (HP205580), VIM (HP206907), FN (HP234005), MMP2 (HP207826), SNAIL (SNAI1, HP209016), TWIST1 (HP200446), ZEB1 (HP215380) and GAPDH (HP205798) were purchased from OriGene (Rockville, MD, USA). The primer sets for PCR amplification are listed in Supplementary Table S1. All PCR condition were performed on an Applied Biosystems 7500 fast real-time PCR system with the reaction conditions of pre-incubation at 95 °C for 10 s to activate HotStart Taq DNA polymerase, followed by 40 cycles of 15 s at 95 °C and 1 min at 60 °C. Nuclease-free water was used to replace cDNA in each run as a negative control in PCR amplification. Glyceraldehyde-3-phosphate dehydrogenase (GAPDH) was an endogenous control. Ten nanograms of cDNA sample were used for the RT-qPCR reaction following the manufacturer’s instructions. The fluorescent signals were analyzed by 7500 software v2.06. The relative mRNA expression was calculated by using the △△Ct method [17].
Western blot assay
Cells were lysed in Pro-PREP protein extraction buffer (iNtRON Biotechnology, Korea) according to manufacturer’s instructions, and protein samples were boiled 5 min after mixing with protein loading buffer. Equal amounts of total protein samples were loaded on 8–12% sodium dodecyl sulfate-polyacrylamide gel (SDS-PAGE) for electrophoresis, and proteins were then transferred to PVDF membranes. Blots were incubated with Tris-buffered saline (TBS) blocking buffer containing 3% BSA for 1 h at room temperature, followed by the respective primary antibodies diluted in TBST (containing 0.1% Tween20 and 3% BSA) overnight at 4 °C. Subsequently, blots were washed and incubated with appropriate secondary antibodies in TBST. The western blotting result was quantified by measuring the band intensity ratios of target genes to GAPDH using ImageJ. Antibodies for E-Cadherin (GTX100443), N-Cadherin (GTX127345) Fibronectin (GTX112794), MMP2 (GTX104577), ZEB1 (GTX105278), SNAI1 (GTX125918) and GAPDH (GTX100118) were purchased from GeneTex Inc (USA). Anti-Vimentin (sc-6260) and TWIST (sc-15393) were from Santa Cruz Biotechnology (USA).
Small interfering RNA and transfection
Small interfering RNA oligonucleotides (siRNA) against ZEB1 (HSS110548) and scrambled negative control siRNA were purchased from ThermoFisher (Thermo Fisher Scientific, CA, USA). The siRNA transfection experiments were carried out using lipofectamine 3000 reagent (Thermo Fisher, CA, USA) with 100 nM siRNA according to the manufacturer’s instructions. After siRNA transfection for 24 h, cells were used for, quantification PCR, migration and invasion assays.
Statistical analysis
The prognostic performance of glycosphingolipid expression by IHC H-score was calculated by the receiver operating characteristic (ROC) curve. The area under the ROC curve was used to determine sensitivity and specificity of H-score of glycosphingolipid expression for predicting relapse. Youden index method was applied to choose best cut-off value calculation of H-score of glycosphingolipid. Kaplan–Meier Survival curves were plotted using log-rank test for comparison. The Cox proportional-hazards regression model was employed to identify the independent prognostic factors in all clinical parameters. p-values < 0.05 were considered statistically significant. The statistical analyses were performed with SPSS software ver 22.0 (IBM, Armonk, NY, USA) or Prism 6.0 (GraphPad Software, La Jolla, CA, USA).
Results
Clinical characteristic in hepatocellular carcinoma (HCC) tissues
The expression levels of the SSEA3, Globo H, and SSEA4 were determined by Immunohistochemical staining in 328 patients with resectable HCC. Their clinical information and patient characteristics were listed in Table 1. The mean age of HCC patients was 56.5 ± 13.9 (range: 19–87). Of this cohort, 81.4% were male, 71% were HBV positive, and 5.5% were HBV and HCV double positive. The mean of tumor size was 6.3 cm (range: 0.8–20.5 cm), but 51.8% of patients had tumor size less than 5 cm. Additionally, 156 patients (52.4%) had low grade tumors, 149 patients (45.4%) possessed vascular invasion in tumors, and 156 patients (47.6%) had liver cirrhosis. In accordance with the tumor-node-metastasis (TNM) staging system, 217 patients (66.2%) were stage I and II. The median follow-up time was 27.4 months (range: 0.6–138.8 months). Twenty-one percent (69/328) of patients died at the time of this study.
Table 1.
Clinical and pathological characteristics of 328 hepatocellular carcinoma (HCC) patients.
| Characteristics | N (%) |
|---|---|
| Age (Mean ± SD and range) (years) | 56.5 ± 13.9 (19–87) |
| Gender | |
| Male | 267 (81.4%) |
| Female | 61 (18.6%) |
| Drinking historya | |
| Yes | 106 (32.5%) |
| No | 220 (67.5%) |
| Virus infection | |
| None | 23 (7.0%) |
| HBV | 233 (71.0%) |
| HCV | 54 (16.5%) |
| HBV + HCV | 18 (5.5%) |
| Tumor size (Mean ± SD and range) (cm) | 6.3 ± 4.3 (0.8–20.5) |
| ≦5 | 170 (51.8%) |
| >5 | 158 (48.2%) |
| Serum AFP (ng/mL)b | |
| ≦200 | 215 (66.4%) |
| >200 | 109 (33.6%) |
| Edmondson Grade | |
| 1 + 2 | 156 (52.4%) |
| 3 + 4 | 172 (47.6%) |
| TNM stage | |
| I + II | 217 (66.2%) |
| III + IV | 111 (33.8%) |
| Vascular invasion | |
| Absent | 179 (54.6%) |
| Present | 149 (45.4%) |
| Tumor number | |
| Solitary | 192 (58.5%) |
| Multiple | 136 (41.5%) |
| Cirrhosis | |
| No | 172 (52.4%) |
| Yes | 156 (47.6%) |
| Metastasis | |
| No | 277 (84.5%) |
| Yes | 51 (15.5%) |
| Relapsec | |
| No | 130 (40.2%) |
| Yes | 193 (59.8%) |
| RFS duration median (range) | 27.4 (0.6–138.8 months) |
| Outcome | |
| Alive | 259 (79.0%) |
| Dead | 69 (21.0%) |
| OS duration median (range) | 53.2 (0.8–138.8 months) |
Data missing in two samples.
Data missing in four samples.
Data missing in five samples.
Correlation of clinicopathological parameters with the expression levels of stage-specific embryonic antigen 3 (SSEA3), Globo H, and stage-specific embryonic antigen 4 (SSEA4) in hepatocellular carcinoma(HCC) patients
Representative positive IHC staining of HCC specimens for each glycan antigen are shown in Fig. 1. Staining patterns of SSEA3, Globo H, and SSEA4 were in line with our previous report [12] showing membranous, cytoplasmic, and nuclear staining patterns. Next, we examined the association of the higher expression levels of SSEA3, Globo H, and SSEA4 as reflected by H scores≧3 with clinical pathological characteristics of 328 patients with HCC [Table 2]. When compared to patients with lower SSEA3 expression, those with higher SSEA3 expression were more likely to have large tumor size (OR: 2.64, 95% CI: 1.60–4.36, p < 0.001), higher serum Alpha-Fetoprotein (AFP) (OR: 2.66, 95% CI: 1.61–4.39, p < 0.001), TNM III + IV stages (OR: 2.99, 95% CI: 1.82–4.94, p < 0.001), presence of vascular invasion (OR: 2.55, 95% CI: 1.55–4.18, p < 0.002), multiple tumors (OR: 1.84, 95% CI: 1.13–2.99, p = 0.02), existence of metastasis (OR: 2.03, 95% CI: 1.09–3.77, p = 0.03), occurrence of relapse (OR: 5.50, 95% CI: 2.94–10.27, p < 0.001), and death (OR: 3.65, 95% CI: 2.09–6.36, p < 0.001) [Table 2]. Higher Globo H expression showed a significant association with tumor size (OR: 1.81, 95% CI: 1.09–3.01, p = 0.03), serum AFP (OR: 2.06, 95% CI: 1.22–3.45, p = 0.009), TNM stage (OR: 1.71, 95% CI: 1.02–2.87, p = 0.04), vascular invasion (OR: 2.25, 95% CI: 1.35–3.76, p = 0.002), and relapse (OR: 2.06, 95% CI: 1.18–3.58, p = 0.01). Higher expression of SSEA4 showed association with vascular invasion (OR: 2.43, 95% CI: 1.42–4.17, p = 0.001), relapse (OR: 2.52, 95% CI: 1.38–4.59, p = 0.002), and death (OR: 2.56, 95% CI: 1.43–4.59, p = 0.003).
Fig. 1.

Expression of stage-specific embryonic antigen 3 (SSEA3), Globo H, and stage-specific embryonic antigen 4 (SSEA4) in hepatocellular carcinoma (HCC). Expression of SSEA3, Globo H, and SSEA4 in formalin-fixed, paraffin-embedded tumor sections was determined by IHC staining. Representative positive stainings (original magnification 40X) for each of the 3 globosides and their isotype controls were shown. Scale bars indicate 60 μm.
Table 2.
Association of stage-specific embryonic antigen 3 (SSEA3), Globo H, and stage-specific embryonic antigen 4 (SSEA4) expression with clinical–pathological parameters in 328 patients with hepatocellular carcinoma (HCC).
| Variable | N | SSEA3 (n = 328) |
Globo H (n = 328) |
SSEA4 (n = 328) |
|||||||||
|---|---|---|---|---|---|---|---|---|---|---|---|---|---|
| Low | High | p value | OR(95% CI) | Low | High | p value | OR(95% CI) | Low | High | p value | OR(95% CI) | ||
| Age | |||||||||||||
| ≦55 | 146 | 104 | 42 | 0.806 | 1 | 108 | 38 | 0.7 | 1 | 114 | 32 | 1,00 | 1 |
| >55 | 182 | 132 | 50 | 0.94 (0.58–1.52) | 139 | 43 | 0.88 (0.53–1.46) | 142 | 40 | 1.00 (0.59–1.70) | |||
| Gender | |||||||||||||
| Female | 61 | 42 | 19 | 0.53 | 1 | 44 | 17 | 0.51 | 1 | 48 | 13 | 1.00 | 1 |
| Male | 267 | 194 | 73 | 0.83 (0.45–1.52) | 203 | 64 | 0.82 (0.44–1.53) | 208 | 59 | 1.05 (0.53–2.06) | |||
| Drinking historya | |||||||||||||
| Had or Has | 220 | 165 | 55 | 0.11 | 1 | 162 | 58 | 0.34 | 1 | 172 | 48 | 0.89 | 1 |
| no | 106 | 70 | 36 | 1.54 (0.93–2.56) | 84 | 22 | 0.73 (0.42–1.28) | 82 | 24 | 1.05 (0.60–1.83) | |||
| Virus infection | |||||||||||||
| None | 23 | 16 | 7 | 0.81 | 1 | 19 | 4 | 0.62 | 1 | 21 | 2 | 0.19 | 1 |
| HBV/HCV | 305 | 220 | 85 | 0.88 (0.35–2.22) | 228 | 77 | 1.60 (0.53–4.86) | 235 | 70 | 3.13 (0.72–13.67) | |||
| Tumor size (cm) | |||||||||||||
| ≦5 | 170 | 138 | 32 | <0.001 | 1 | 137 | 33 | 0.03 | 1 | 130 | 40 | 0.51 | 1 |
| >5 | 158 | 98 | 60 | 2.64 (1.60–4.36) | 110 | 48 | 1.81 (1.09–3.01) | 126 | 32 | 0.83 (0.48–1.39) | |||
| Serum AFP (ng/ml)b | |||||||||||||
| ≦200 | 215 | 170 | 45 | <0.001 | 1 | 172 | 43 | 0.009 | 1 | 174 | 41 | 0.06 | 1 |
| >200 | 109 | 64 | 45 | 2.66 (1.61–4.39) | 72 | 37 | 2.06 (1.22–3.45) | 78 | 31 | 1.69 (0.99–2.89) | |||
| Edmondson Grade | |||||||||||||
| 1 + 2 | 156 | 112 | 44 | 1 | 1 | 123 | 33 | 0.16 | 1 | 116 | 40 | 0.14 | 1 |
| 3 + 4 | 172 | 124 | 48 | 0.99 (0.61–1.59) | 124 | 48 | 1.44 (0.86–2.39) | 140 | 32 | 0.66 (0.39–1.12) | |||
| TNM stage | |||||||||||||
| I + II | 217 | 173 | 44 | <0.001 | 1 | 171 | 46 | 0.04 | 1 | 173 | 44 | 0.33 | 1 |
| III + IV | 111 | 63 | 48 | 2.99 (1.82–4.94) | 76 | 35 | 1.71 (1.02–2.87) | 83 | 28 | 1.33 (0.77–2.28) | |||
| Vascular invasion | |||||||||||||
| Absent | 179 | 144 | 35 | <0.001 | 1 | 147 | 32 | 0.002 | 1 | 152 | 27 | 0.001 | 1 |
| Present | 149 | 92 | 57 | 2.55 (1.55–4.18) | 100 | 49 | 2.25 (1.35–3.76) | 104 | 45 | 2.43 (1.42–4.17) | |||
| Tumor number | |||||||||||||
| Solitary | 192 | 148 | 44 | 0.02 | 1 | 149 | 43 | 0.29 | 1 | 150 | 42 | 1 | 1 |
| Multiple | 136 | 88 | 48 | 1.84 (1.13–2.99) | 98 | 38 | 1.34 (0.81–2.23) | 106 | 30 | 1.01 (0.59–1.72) | |||
| Cirrhosis | |||||||||||||
| No | 172 | 117 | 55 | 0.11 | 1 | 131 | 41 | 0.79 | 1 | 131 | 41 | 0.42 | 1 |
| Yes | 156 | 119 | 37 | 0.66 (0.41–1.08) | 116 | 40 | 21.12 (0.67–1.82) | 125 | 31 | 0.79 (0.47–1.34) | |||
| Metastasis | |||||||||||||
| No | 277 | 206 | 71 | 0.03 | 1 | 210 | 67 | 0.6 | 1 | 215 | 62 | 0.72 | 1 |
| Yes | 51 | 30 | 21 | 2.03 (1.09–3.77) | 37 | 14 | 1.19 (0.61–2.33) | 41 | 10 | 0.85 (0.40–1.79) | |||
| Relapsec | |||||||||||||
| No | 130 | 116 | 14 | <0.001 | 1 | 108 | 22 | 0.01 | 1 | 113 | 17 | 0.002 | 1 |
| Yes | 193 | 116 | 77 | 5.50 (2.94–10.27) | 136 | 57 | 2.06 (1.18–3.58) | 140 | 53 | 2.52 (1.38–4.59) | |||
| Survivald | |||||||||||||
| Alive | 259 | 202 | 57 | <0.001 | 1 | 199 | 60 | 0.21 | 1 | 212 | 47 | 0.003 | 1 |
| Dead | 69 | 34 | 25 | 3.65 (2.09–6.36) | 48 | 21 | 1.45 (0.81–2.61) | 44 | 25 | 2.56 (1.43–4.59) | |||
Based on the expression levels of SSEA3, Globo H, and SSEA4 HCC patients were divided into higher (H-score ≧3) or lower (H-score <3) expression groups.
Two patients without drinking history data.
Four patients without AFP data.
Five patients without relapse data.
Follow up duration median (range): 53.2 (0.6–138.8 months).
Higher expression levels of stage-specific embryonic antigen 3 (SSEA3), globo H, and stage-specific embryonic antigen 4 (SSEA4) correlate with poor clinical outcome in hepatocellular carcinoma (HCC) patients
We further examined whether higher expression of SSEA3, Globo H, or SSEA4 were significant predictors of OS or RFS of HCC. Kaplan–Meier survival curve revealed that OS in HCC patients with higher expression of SSEA3 (mean: 71.9, 95% CI: 58.9–85.0 months) was significantly shorter than those with lower expression of SSEA3 (mean: 119.7, 95% CI: 113.8–125.5 months; p < 0.001) [Fig. 2A]. The OS in HCC patients with higher expression of Globo H (mean: 89.9, 95% CI: 77.3–102.5 months) was also shorter than those with lower expression of Globo H, albeit with borderline significance (mean: 112.3, 95% CI: 105.7–118.9 months; p = 0.05) [Fig. 2B]. Furthermore, OS in HCC patients with higher expression of SSEA4 (mean: 88.5, 95% CI: 76.7–100.3 months) was significantly shorter than those with lower expression of SSEA4 (mean: 113.7, 95% CI: 107.1–120.4 months; p = 0.01) [Fig. 2C]. In addition, RFS in HCC patients with higher expression of SSEA3, Globo H, and SSEA4 were significantly shorter than those with lower expression of SSEA3 (median: 7.9, 95% CI: 4.2–11.7 months vs. median: 61.9, 95% CI: 42.8–81.0 months; p < 0.001), Globo H (median: 14.1, 95% CI: 5.2–22.4 months vs. median: 43.4, 95% CI: 27.6–59.1 months; p < 0.001), and SSEA4 (median: 21.7, 95% CI: 14.5–29.1 months vs. median: 42.7, 95% CI: 28.9–56.4 months; p = 0.005) [Fig. 2D–F].
Fig. 2.

Kaplan–Meier survival analyses of recurrence-free survival (RFS) (A–C) and overall survival (OS) (D–F) of HCC patients in relation to higher (H-score ≧3) or lower (H-score <3) expression of stage-specific embryonic antigen 3 (SSEA3) (A, D), Globo H (B, E), and stage-specific embryonic antigen 4 (SSEA4) (C, F). Tumors with either nuclear, cytoplasmic, or membranous staining were considered to be positive for each marker.
Higher expression of stage-specific embryonic antigen 3 (SSEA3) is an independent prognostic factor for hepatocellular carcinoma (HCC)
To appraise the potential value of higher expression levels of SSEA3, Globo H, and SSEA4 for predicting HCC RFS and OS, univariate Cox regression analyses were performed. As expected, the results indicated that RFS correlated with tumor size greater than 5 cm (HR: 1.78, 95% CI: 1.34–2.37, p < 0.001), AFP level more than 200 ng/mL (HR: 1.48, 95% CI: 1.10–1.99, p = 0.009), presence of vascular invasion (HR: 1.99, 95% CI: 1.50–2.66, p < 0.001), and presence of metastasis (HR: 2.99, 95% CI: 2.16–4.15, p < 0.001). In addition, RFS duration of HCC patients was significantly associated with higher expression of SSEA3 (HR: 3.48, 95% CI: 2.59–4.67, p < 0.001), Globo H (HR: 1.91, 95% CI: 1.39–2.61, p < 0.001), and SSEA4 (HR: 1.57, 95% CI: 1.14–2.15, p = 0.005) [Fig. 3A]. On the other hand, our data showed that OS correlated with the patient tumor size greater than 5 cm (HR: 2.0, 95% CI: 1.25–3.26, p = 0.004), presence of vascular invasion (HR: 2.65, 95% CI: 1.61–4.35, p < 0.001), and presence of metastasis (HR: 3.62, 95% CI: 2.19–5.98, p < 0.001). In addition, OS duration of HCC patients was significantly associated with higher expression of SSEA3 (HR: 4.19, 95% CI: 2.60–6.75, p < 0.001), and SSEA4 (HR: 1.87, 95% CI: 1.15–3.06, p = 0.01) [Fig. 3B].
Fig. 3.

Univariate analysis of higher expression of stage-specific embryonic antigen 3 (SSEA3), Globo H, and stage-specific embryonic antigen 4 (SSEA4) as prognostic factors. Forest plot of univariate analysis is shown. Covariates tested in univariate cox models were age, gender, hepatitis virus infection, cirrhosis, tumor size, alpha-fetoprotein (AFP), tumor number, grade metastasis, vascular invasion, SSEA3 expression, Globo H expression, and SSEA4 expression for (A) recurrence-free survival (RFS) and (B) overall survival (OS). p values were calculated using the Cox regression model.
Next, to identify independent variables associated with poor RFS and OS, we selected covariates with p value < 0.1 from the univariate analysis for multivariable Cox regression analysis in a stepwise manner. Our data indicated that tumor size was an independent risk factor for RFS (HR: 1.43, 95% CI: 1.04–1.95, p = 0.02). Metastasis was also an independent risk factor for RFS (HR: 2.57, 95% CI: 1.84–3.59, p < 0.001) and OS (HR: 2.67, 95% CI: 1.57–4.55, p < 0.001). Notably, the higher expression of SSEA3 was the independent risk factor for RFS (HR: 2.68, 95% CI: 1.93–3.72, p < 0.001) and OS (HR: 2.99, 95% CI: 1.81–4.96, p < 0.001) [Fig. 4]. These data identified higher expression of SSEA3 as an important and independent prognostic factor for poor RFS and OS in HCC, with the advantage that it could be easily detected by immunohistochemical staining of readily available paraffin embedded tissue slides.
Fig. 4.

Multivariate analysis of higher expression of stage-specific embryonic antigen 3 (SSEA3), Globo H, and stage-specific embryonic antigen 4 (SSEA4) as prognostic factors. Forest plot of multivariate analysis is shown. Covariates tested in multivariate cox models were age, tumor size, alpha-fetoprotein (AFP), metastasis, vascular invasion, SSEA3 expression, Globo H expression, and SSEA4 expression for (A) recurrence-free survival (RFS) and (B) overall survival (OS). p values were calculated using the Cox regression model.
SSEA3-ceramide (SSEA3Cer) increased the ability of hepatocellular carcinoma (HCC) cells in migration and invasion
In view of the important prognostic significance of SSEA3 expression in HCC, we sought to investigate the biological functions of SSEA3Cer in cancer, which remained largely unknown. Upon incubation of SSEA3 negative HA22T, HA59T, and Hep3B cells with synthetic SSEA3Cer for 24 h, we found expression of SSEA3 on the surface of these cells by flow cytometry [Supplementary Fig. 1]. We also noticed altered morphology of these cells from cuboidal or oval shape into fibroblast-like cells with tapering ends, reminiscent of epithelial mesenchymal transition (EMT) [Fig. 5A]. We next examined the effects of SSEA3Cer on transwell migration and invasion of these HCC cell lines after incubation with SSEA3Cer for 24 h. Compared with GlcCer controls, a monosaccharide precursor of the glycolipids SSEA3, incubation of HCC cells with 30 μM SSEA3Cer showed 2.7–3.4 folds increases in the numbers of migrated cells [Figs. 5B], and 2.7–3.3 folds increases in the number of invading cell [Fig. 5C]. The increased migration and invasion induced by SSEA3Cer were dampened by the addition of anti-SSEA3 [Fig. 5B and C]. We also examined the impacts of SSEA3Cer on the expression of genes involved in migration and invasion [18], including Cadherin-1 (CDH1), Cadherin-2 (CDH2), Vimentin (VIM), Fibronectin (FN), matrix metalloproteinase-2 (MMP2) in HCC cells. As shown in Fig. 5D, CDH1 was down-regulated to ∼0.5-fold of ctrl. The downregulation of CDH1 in HCC cells by SSEA3Cer was abolished by co-culture with anti-SSEA3 antibody [Fig. 5D]. In contrast, >2-fold up-regulation (vs ctrl) of CDH2, VIM, FN, and MMP2 was observed in HA22T, HA59T, and Hep3B cells incubated with 30 μM SSEA3Cer for 24 h [Fig. 5D]. The upregulation of these genes in HCC cells by SSEA3Cer was abolished by the addition of anti-SSEA3 antibody [Fig. 5D]. The expression of proteins determined by western blotting agreed with qRT-PCR results in general [Supplementary Fig. 2]. These findings suggested that SSEA3Cer promoted EMT process in HCC cells.
Fig. 5.

Effect of SSEA3-ceramide (SSEA3Cer) on hepatocellular carcinoma (HCC) cancer cell migration and invasion. (A) Phase contrast photographs of HA22T, HA59T, and Hep3B cells incubated with 30 μM glucosylceramide (GlcCer) or SSEA3Cer for 24 h. Scale bar 100 μm. Quantification of the cell elongation ratio using Phase contrast photographs of HCC cells after treatment with GlcCer or SSEA3Cer (B–C) Boyden chamber assay was employed to examine the (B) migration and (C) invasion ability of HA22T, HA59T, and Hep3B cells. The cells were incubated with 30 μM GlcCer (Upper, left panel), SSEA3Cer (middle panel), or SSEA3Cer plus SSEA3 Ab (5 μg/100 μl) (lower panel) for 24 h. (D) Effect of SSEA3Cer on gene expression related to migration and invasion. HA22T, HA59T, and Hep3B cells were incubated with 30 μM GlcCer (Ctrl, left panel), SSEA3Cer (middle panel) or SSEA3Cer plus SSEA3 Ab (5 μg/100 μl) (right panel) for 24 h. Total RNA was extracted for quantitation of CDH1, CDH2, VIM, FN, and MMP2 by quantitative real-time PCR. The mRNA levels were normalized to Glyceraldehyde-3-phosphate dehydrogenase (GAPDH) level and compared to the control cells. The data were presented as mean ± SD of triplicate determination. The results were from three independent experiments (∗p < 0.05 and ∗∗p < 0.001, One-way ANOVA test).
SSEA3-ceramide (SSEA3Cer) enhanced hepatocellular carcinoma (HCC) cell migration and invasion was mediated by ZEB1 signal pathway
Next, we evaluated the effects of SSEA3Cer on the expression of transcription factors [19] that regulated EMT process including SNAIL, TWIST1, and ZEB1. Upon incubation of HCC cell lines with SSEA3Cer for 24 h, we noticed that the ZEB1 expression at RNA [Fig. 6A] and protein levels [Supplementary Fig. 3] increased to 2–4 fold of control. We further confirmed that the up-regulation (vs. ctrl) of ZEB1 by SSEA3Cer was obliterated by the addition of anti-SSEA3 antibody [Fig. 6B and Supplementary Fig. 4]. To investigate the role of ZEB1 in SSEA3Cer-induced EMT property, we assessed the migration and invasion of ZEB1 knockdown cell lines upon incubation with SSEA3Cer. In the cells transfected with si-Control, SSEA3Cer significantly promoted migration and invasion [Fig. 6C and D]. However, such promotion effect was lost in the ZEB1 knockdown cells [Fig. 6C and D and Supplementary Fig. 5]. We also observed that SSEA3-induced downregulation of CDH1 (∼0.5-fold of GlcCer control) was observed in HCC cells transfected with si-Control transfection but not in the ZEB1 knockdown cells [Fig. 6E and Supplementary Fig. 6]. Similarly, SSEA3Cer induced upregulation of EMT related gene such as CDH2, VIM, FN, and MMP2 (>2-fold, vs. GlcCer control) in HCC cells transfected with si-Control transfection, but not in the ZEB1 knockdown HCC cells [Fig. 6E and Supplementary Fig. 6]. These results suggest that promotion of EMT property by SSEA3Cer was mediated by upregulation of ZEB1.
Fig. 6.

SSEA3Cer-enhanced hepatocellular carcinoma (HCC) cancer cell migration and invasion were inhibited by ZEB1 silencing. (A) Effect of SSEA3Cer on expression level of transcription factors regulating migration and invasion related genes. HA22T, HA59T, and Hep3B cells were incubated with glucosylceramide (GlcCer) (Ctrl, left panel), 30 μM SSEA3Cer (middle panel) for 24 h. Total RNA was extracted for quantitation of SNAIL, TWIST1, and ZEB1 by quantitative real-time PCR. The mRNA levels were normalized to the level of Glyceraldehyde-3-phosphate dehydrogenase (GAPDH and compared to the control cells. (B) HA22T, HA59T, and Hep3B cells were incubated with GlcCer (Ctrl, left panel), 30 μM SSEA3Cer (middle panel) or SSEA3Cer (30 μM)/SSEA3 Ab (5 μg) (right panel) for 24 h. Total RNA was extracted for quantitation of ZEB1 by quantitative real-time PCR. The mRNA levels were normalized to the level of GAPDH and compared to the control cells. (C–E) Boyden chamber assay was employed to examine the migration and invasion ability of HA22T, HA59T, and Hep3B cells. The cells were transfected with control siRNA (si-Ctrl) or ZEB1 siRNA (si-ZEB1) for 24 h. Then, the migration (C), invasion (D), and quantitative real-time PCR (E) assays were performed in the cells incubated with GlcCer or 30 μM SSEA3Cer for 24 h. Total RNA was extracted for quantitation of CDH1, CDH2, VIM, FN, MMP2, and ZEB1 by quantitative real-time PCR. The mRNA levels were normalized to the level of GAPDH and compared to the siCtrl/GlcCer cells. The data were presented as mean ± SD of triplicate determination. The results were from three independent experiments (∗p < 0.05, One-way ANOVA test).
Discussion
In this study, we observed the expression of SSEA3 in 28.0%, Globo H in 24.7%, and SSEA4 in 21.9% of HCC by IHC. Higher expression levels of SSEA3, Globo H, and SSEA4 were associated with significantly worse outcome of HCC patients. Furthermore, expression levels of SSEA3, SSEA4, and Globo H were associated with vascular invasion in HCC patients. Importantly, SSEA3 was an independent prognostic marker to predict HCC patients with poor RFS and OS. This is the first study to demonstrate the prognostic significance of these 3 globosides in HCC. Moreover, they can be easily assessed by IHC using paraffin embedded tumor tissues.
SSEA3 has been considered as a marker for embryonic stem cells [20], but its biological role is still unclear. Chuang et at., reported that SSEA3 positive breast cancer cells displayed greater migration and invasion abilities in vitro and tumorigenicity in vivo, likely involving binding of SSEA3Cer to a FAK/CAV1/AKT/RIP complex [21]. In this study, we found that SSEA3Cer significantly increased migration and invasion as well as upregulated expression of EMT-related genes, including CDH2, VIM, FN, and MMP2, in HCC cells. Importantly, SSEA3Cer-induced EMT was ZEB1 dependent. Besides, in our previous report, we found that a key enzyme for the biosynthesis of SSEA3, B3GALT5, can upregulate ZEB1 in breast cancer [22]. In light of the findings in this study, this might be attributed to an increased expression of SSEA3Cer by B3GALT5. ZEB1 can directly or indirectly regulate the genes involved in EMT. For example, transcription of VIM [23] and FN [24] could be directly regulated by the ZEB1, which bound to their promoters. ZEB1 could indirectly regulate EMT through St3gal5 (GM3 synthase). Upregulated St3gal5 should increase the expression of a-series of GSLs [25], which might promote EMT. However, the mechanism of ZEB1 upregulation by SSEA3Cer remain to be elucidate in the future.
Several reports indicated that expression of GSLs highly correlated with EMT. Overexpression of Gb3 synthase in noncancerous polarized epithelial cells induced cell invasiveness [26]. Inhibition of SSEA3 synthase, B3GALT5 reduced the migration and invasion ability of MDA-MB-231 breast cancer cells [21]. SSEA-4 expression was increased in the noncancerous MCF-10A mammary epithelial cells undergoing EMT induced by TGF-β1 [27]. The ovarian cancer cell line with higher expression of glycosphingolipid P1 displayed increased migration rate [28]. GM3 synthase overexpression increased the migration ability of murine breast cancer cell [29]. Overexpression of GD3 synthase in small cell lung cancer and melanoma cells enhanced their invasion ability [30,31]. On the other hand, other studies indicated that GSLs might inhibit EMT in cancer cells. Treatment of human cells with GlcCer synthase inhibitor, D-threo-1-(3′,4′-ethylenedioxy)phenyl-2-palmitoylamino-3-pyrrolidino-1-propanol (EtDO-P4) which depleted all GSL derived from GlcCer, promoted EMT. But, the effects of the inhibitor was abrogated by the addition of GM2 or Cg4 [32]. ST3GAL5 and its downstream gangliosides were involved in the inhibition TGF-β-induced EMT in A549 [33]. Deletion of ST8SIA1 in ovarian cancer cells induced epithelial cell features, whereas loss of globosides in ΔA4GALT cells, resulted in EMT [34,35]. Since some of these experiments were performed by deletion or overexpression of GSL synthase, which may affect global GSLs profile as well as glycosylation of proteins, it is difficult to dissect the biological role of specific GSL in these studies.
Our study provided the first evidence for expression of Globo H and SSEA3 as poor prognostic factors in HCC. This is consistent with our previous report that high expression of B3GALT5 and FUT1, key biosynthetic enzymes for SSEA3 and Globo H, is an independent predictor for the survival of HCC patients [12]. Similarly, Globo H expression is a poor prognostic indicator in intrahepatic cholangiocarcinoma [36]. In addition, we showed association of Globo H expression with vascular invasion in HCC. Vascular invasion is a poor prognosis factor for patients with HCC [7]. Increased vascular invasion in Globo H positive HCC might result from Globo H ceramide-induced angiogenesis [37].
As to the clinical relevance of SSEA4 expression, we found higher SSEA4 expression to be correlated with shorter RFS and OS in HCC. Similarly, SSEA4 positive patients had poor outcome in basaloid non-small cell lung cancer [38]. Furthermore, joint effects of higher SSEA4 expression level in cancer cells and detectable SSEA4 on tumor-infiltrating immune cells was an independent predictor for recurrence after prostatectomy [39]. In addition, SSEA4 expression in astrocytoma is positively correlated with high grade IV astrocytoma, glioblastoma multiforme [40]. Interestingly, increasing expression of SSEA4 was noted from borderline cystadenoma to serous and mucinous ovarian adenocarcinoma, but its expression was lost in patients with advanced stage or poor differentiated ovarian cancer [41]. Moreover, SSEA4 positive cells showed EMT characteristics in breast and prostate cancers [27,42]. Thus, SSEA4 might play a role during tumor progression.
Altered expression of GSLs on tumor cells may serve as targets for cancer therapy. Abnormal fucosylated GSLs including Globo H were identified by mass spectrometry in HCC in a previous study [43], consistent with our findings by immunohistochemistry. Indeed, we showed significant therapeutic efficacy of a Globo H antibody in rats with thioacetamide-induced cholangiocarcinoma [36]. Moreover, in a phase II clinical trial of Globo H-KLH vaccine in breast cancer, those patients who mounted Globo H-specific IgG and IgM antibodies had significantly better progression free survival [44,45]. Furthermore, Globo H vaccine could induce antibodies targeting not only Globo H but also SSEA3 [14]. Besides, an anti-SSEA4 antibody could exert complement dependent cytotoxicity against human glioma cell lines [40], and SSEA4 antibody conjugated immunotoxin reduced cell viability of breast cancer cells [46]. These data provided potential therapeutic options for HCC patients with higher expression of SSEA3, Globo H, and SSEA4.
Alternatively, inhibition of B3GALT5 expression by inhibitor of sirtuin 1 (SIRT1), a nicotinamide adenine dinucleotide-dependent protein lysine deacetylase, has been proposed as a potential strategy to target SSEA3. SIRT1 promoted cancer progression [47,48], and its inhibition induced STAT3 activation, leading to inhibition of the activity of B3GALT5-LTR promoter, thereby decreased SSEA3 expression [49]. However, expression of B3GALT5 is not limited to cancer cells. It was also detected in some normal tissues, such as gastrointestinal tract [50]. Additionally, SIRT1 inhibition does not selectively target B3GALT5. Inhibition of SIRT1 also enhances several pathways such as P53 and PTEN signaling in cancers [51]. Thus, doubts remain on the use of SIRT1 inhibitor for treating SSEA3 positive cancers.
Conclusion
There is a great need for developing biomarkers that can predict recurrence of HCC after surgery. In this study, we have identified high expression of SSEA3, SSEA4, and Globo H as poor prognostic factors for postoperative RFS and OS of HCC. Importantly, SSEA3 is an independent predictor for clinical outcome. If confirmed in a larger cohort study, these globo-series GSLs which can be easily detected by immunohistochemical staining of HCC tissue slides may serve as valuable markers for prognostication. In addition, these GSLs could serve as potential therapeutic targets for HCC.
Ethics approval and consent to participate
Written Informed consent was obtained from all subjects before their tissues were deposited. All studies were performed in accordance with relevant guidelines and regulations and were approved by Institutional Review Board of Chang Gung Medical Foundation (IRB number: 201304758B0), Review Board of Tri-Service General Hospital, and Biobank Ethics Committee of National Health Research Institutes.
Consent for publication
Not applicable.
Availability of data and materials
Not applicable.
Funding sources
This work was supported by grants from the Chang Gung Medical Foundation (OMRPG3C0048 for ALY), Ministry of Science and Technology (MOST 110-2622-B-182A-001 for ALY; MOST 111-2321-B-182-002 for JY), Chang Gung Memorial Hospital at LinKuo of Taiwan (CMRPG3J0311-3 and CMRPG3N0181 for JTH; CMRPG3M1231 for THH).
Conflicts of interest
The authors declare that there is no competing interests.
Acknowledgement
We are indebted to Taiwan Liver Cancer Network and Tissue Bank and Biobank of Linkou Chang Gung Memorial Hospital for providing the HCC samples and related clinical data for our study.
Footnotes
Peer review under responsibility of Chang Gung University.
Supplementary data to this article can be found online at https://doi.org/10.1016/j.bj.2023.100612.
Contributor Information
Jung-Tung Hung, Email: felixhjt@gmail.com.
Alice L. Yu, Email: a1yu@health.ucsd.edu.
Appendix A. Supplementary data
The following is the Supplementary data to this article.
Multimedia component 1
References
- 1.Sung H, Ferlay J, Siegel RL, Laversanne M, Soerjomataram I, Jemal A, et al. Global cancer statistics 2020: GLOBOCAN estimates of incidence and mortality worldwide for 36 cancers in 185 countries. CA Cancer J Clin. 2021;;71(3):209–249. doi: 10.3322/caac.21660. [DOI] [PubMed] [Google Scholar]
- 2.Giannini EG, Farinati F, Ciccarese F, Pecorelli A, Rapaccini GL, Di Marco M, et al. Prognosis of untreated hepatocellular carcinoma. Hepatology. 2015;61(1):184–190. doi: 10.1002/hep.27443. [DOI] [PubMed] [Google Scholar]
- 3.Chu YJ, Yang HI, Wu HC, Lee MH, Liu J, Wang LY, et al. Aflatoxin B1 exposure increases the risk of hepatocellular carcinoma associated with hepatitis C virus infection or alcohol consumption. Eur J Cancer. 2018;94:37–46. doi: 10.1016/j.ejca.2018.02.010. [DOI] [PMC free article] [PubMed] [Google Scholar]
- 4.Tabrizian P, Jibara G, Shrager B, Schwartz M, Roayaie S. Recurrence of hepatocellular cancer after resection: patterns, treatments, and prognosis. Ann Surg. 2015;261(5):947–955. doi: 10.1097/SLA.0000000000000710. [DOI] [PubMed] [Google Scholar]
- 5.Selcuk H. Prognostic factors and staging systems in hepatocellular carcinoma. Exp Clin Transplant. 2017;15(Suppl 2):45–49. doi: 10.6002/ect.TOND16.L11. [DOI] [PubMed] [Google Scholar]
- 6.Zhao Y, Gao Q, Pei L, Wang C, Jin L, Liao F. Current status and future prospects of biomarkers in the diagnosis of hepatocellular carcinoma. Int J Biol Markers. 2017;32(4):e361–9. doi: 10.5301/ijbm.5000299. [DOI] [PubMed] [Google Scholar]
- 7.Llovet JM, Ricci S, Mazzaferro V, Hilgard P, Gane E, Blanc JF, et al. Sorafenib in advanced hepatocellular carcinoma. N Engl J Med. 2008;359(4):378–390. doi: 10.1056/NEJMoa0708857. [DOI] [PubMed] [Google Scholar]
- 8.El-Khoueiry AB, Sangro B, Yau T, Crocenzi TS, Kudo M, Hsu C, et al. Nivolumab in patients with advanced hepatocellular carcinoma (CheckMate 040): an open-label, non-comparative, phase 1/2 dose escalation and expansion trial. Lancet. 2017;389(10088):2492–2502. doi: 10.1016/S0140-6736(17)31046-2. [DOI] [PMC free article] [PubMed] [Google Scholar]
- 9.Finn RS, Ryoo BY, Merle P, Kudo M, Bouattour M, Lim HY, et al. Pembrolizumab as second-line therapy in patients with advanced hepatocellular carcinoma in KEYNOTE-240: a randomized, double-blind, phase III trial. J Clin Oncol. 2020;38(3):193–202. doi: 10.1200/JCO.19.01307. [DOI] [PubMed] [Google Scholar]
- 10.Finn RS, Qin S, Ikeda M, Galle PR, Ducreux M, Kim TY, et al. Atezolizumab plus bevacizumab in unresectable hepatocellular carcinoma. N Engl J Med. 2020;382(20):1894–1905. doi: 10.1056/NEJMoa1915745. [DOI] [PubMed] [Google Scholar]
- 11.Lin RJ, Kuo MW, Yang BC, Tsai HH, Chen K, Huang JR, et al. B3GALT5 knockout alters glycosphingolipid profile and facilitates transition to human naive pluripotency. Proc Natl Acad Sci USA. 2020;117(44):27435–27444. doi: 10.1073/pnas.2003155117. [DOI] [PMC free article] [PubMed] [Google Scholar]
- 12.Kuo HH, Lin RJ, Hung JT, Hsieh CB, Hung TH, Lo FY, et al. High expression FUT1 and B3GALT5 is an independent predictor of postoperative recurrence and survival in hepatocellular carcinoma. Sci Rep. 2017;7(1) doi: 10.1038/s41598-017-11136-w. [DOI] [PMC free article] [PubMed] [Google Scholar]
- 13.Abbas SA, Barlow JJ, Matta KL. Synthesis of benzyl 2-acetamido-3-O- and -6-O-(2-acetamido-2-deoxy-beta-D-glucopyranosyl)-2-deoxy-alpha-D-galactopyranoside. Carbohydr Res. 1983;112(2):201–211. doi: 10.1016/0008-6215(83)88285-8. [DOI] [PubMed] [Google Scholar]
- 14.Chang WW, Lee CH, Lee P, Lin J, Hsu CW, Hung JT, et al. Expression of Globo H and SSEA3 in breast cancer stem cells and the involvement of fucosyl transferases 1 and 2 in Globo H synthesis. Proc Natl Acad Sci USA. 2008;105(33):11667–11672. doi: 10.1073/pnas.0804979105. [DOI] [PMC free article] [PubMed] [Google Scholar]
- 15.Yu H, Santra A, Li Y, McArthur JB, Ghosh T, Yang X, et al. Streamlined chemoenzymatic total synthesis of prioritized ganglioside cancer antigens. Org Biomol Chem. 2018;16(22):4076–4080. doi: 10.1039/c8ob01087k. [DOI] [PMC free article] [PubMed] [Google Scholar]
- 16.Tsai TI, Lee HY, Chang SH, Wang CH, Tu YC, Lin YC, et al. Effective sugar nucleotide regeneration for the large-scale enzymatic synthesis of Globo H and SSEA4. J Am Chem Soc. 2013;135(39):14831–14839. doi: 10.1021/ja4075584. [DOI] [PubMed] [Google Scholar]
- 17.Schmittgen TD, Livak KJ. Analyzing real-time PCR data by the comparative C(T) method. Nat Protoc. 2008;3(6):1101–1108. doi: 10.1038/nprot.2008.73. [DOI] [PubMed] [Google Scholar]
- 18.Nowak E, Bednarek I. Aspects of the epigenetic regulation of EMT related to cancer metastasis. Cells. 2021;10(12):3435. doi: 10.3390/cells10123435. [DOI] [PMC free article] [PubMed] [Google Scholar]
- 19.Ansieau S, Collin G, Hill L. EMT or EMT-promoting transcription factors, where to focus the light? Front Oncol. 2014;4:353. doi: 10.3389/fonc.2014.00353. [DOI] [PMC free article] [PubMed] [Google Scholar]
- 20.Brimble SN, Sherrer ES, Uhl EW, Wang E, Kelly S, Merrill AH, Jr., et al. The cell surface glycosphingolipids SSEA-3 and SSEA-4 are not essential for human ESC pluripotency. Stem Cell. 2007;25(1):54–62. doi: 10.1634/stemcells.2006-0232. [DOI] [PubMed] [Google Scholar]
- 21.Chuang PK, Hsiao M, Hsu TL, Chang CF, Wu CY, Chen BR, et al. Signaling pathway of globo-series glycosphingolipids and beta1,3-galactosyltransferase V (beta3GalT5) in breast cancer. Proc Natl Acad Sci USA. 2019;116(9):3518–3523. doi: 10.1073/pnas.1816946116. [DOI] [PMC free article] [PubMed] [Google Scholar]
- 22.Liao YM, Wang YH, Hung JT, Lin YJ, Huang YL, Liao GS, et al. High B3GALT5 expression confers poor clinical outcome and contributes to tumor progression and metastasis in breast cancer. Breast Cancer Res. 2021;23(1):5. doi: 10.1186/s13058-020-01381-9. [DOI] [PMC free article] [PubMed] [Google Scholar]
- 23.Qin Y, Yu J, Zhang M, Qin F, Lan X. ZEB1 promotes tumorigenesis and metastasis in hepatocellular carcinoma by regulating the expression of vimentin. Mol Med Rep. 2019;19(3):2297–2306. doi: 10.3892/mmr.2019.9866. [DOI] [PubMed] [Google Scholar]
- 24.Gao Y, Wang B, Luo H, Zhang Q, Xu M. miR-217 represses TGF-beta1-induced airway smooth muscle cell proliferation and migration through targeting ZEB1. Biomed Pharmacother. 2018;108:27–35. doi: 10.1016/j.biopha.2018.09.030. [DOI] [PubMed] [Google Scholar]
- 25.Mathow D, Chessa F, Rabionet M, Kaden S, Jennemann R, Sandhoff R, et al. Zeb1 affects epithelial cell adhesion by diverting glycosphingolipid metabolism. EMBO Rep. 2015;16(3):321–331. doi: 10.15252/embr.201439333. [DOI] [PMC free article] [PubMed] [Google Scholar]
- 26.Kovbasnjuk O, Mourtazina R, Baibakov B, Wang T, Elowsky C, Choti MA, et al. The glycosphingolipid globotriaosylceramide in the metastatic transformation of colon cancer. Proc Natl Acad Sci USA. 2005;102(52):19087–19092. doi: 10.1073/pnas.0506474102. [DOI] [PMC free article] [PubMed] [Google Scholar]
- 27.Aloia A, Petrova E, Tomiuk S, Bissels U, Deas O, Saini M, et al. The sialyl-glycolipid stage-specific embryonic antigen 4 marks a subpopulation of chemotherapy-resistant breast cancer cells with mesenchymal features. Breast Cancer Res. 2015;17(1):146. doi: 10.1186/s13058-015-0652-6. [DOI] [PMC free article] [PubMed] [Google Scholar]
- 28.Jacob F, Anugraham M, Pochechueva T, Tse BW, Alam S, Guertler R, et al. The glycosphingolipid P(1) is an ovarian cancer-associated carbohydrate antigen involved in migration. Br J Cancer. 2014;111(8):1634–1645. doi: 10.1038/bjc.2014.455. [DOI] [PMC free article] [PubMed] [Google Scholar]
- 29.Gu Y, Zhang J, Mi W, Yang J, Han F, Lu X, et al. Silencing of GM3 synthase suppresses lung metastasis of murine breast cancer cells. Breast Cancer Res. 2008;10(1):R1. doi: 10.1186/bcr1841. [DOI] [PMC free article] [PubMed] [Google Scholar]
- 30.Yoshida S, Fukumoto S, Kawaguchi H, Sato S, Ueda R, Furukawa K, et al. (D2) in small cell lung cancer cell lines: enhancement of cell proliferation and mediation of apoptosis. Cancer Res. 2001;61(10):4244–4252. [PubMed] [Google Scholar]
- 31.Hamamura K, Furukawa K, Hayashi T, Hattori T, Nakano J, Nakashima H, et al. Ganglioside GD3 promotes cell growth and invasion through p130Cas and paxillin in malignant melanoma cells. Proc Natl Acad Sci USA. 2005;102(31):11041–11046. doi: 10.1073/pnas.0503658102. [DOI] [PMC free article] [PubMed] [Google Scholar]
- 32.Guan F, Handa K, Hakomori SI. Specific glycosphingolipids mediate epithelial-to-mesenchymal transition of human and mouse epithelial cell lines. Proc Natl Acad Sci USA. 2009;106(18):7461–7466. doi: 10.1073/pnas.0902368106. [DOI] [PMC free article] [PubMed] [Google Scholar]
- 33.Zhang J, van der Zon G, Ma J, Mei H, Cabukusta B, Agaser CC, et al. ST3GAL5-catalyzed gangliosides inhibit TGF-beta-induced epithelial-mesenchymal transition via TbetaRI degradation. EMBO J. 2023;42(2) doi: 10.15252/embj.2021110553. [DOI] [PMC free article] [PubMed] [Google Scholar]
- 34.Jacob F, Alam S, Konantz M, Liang CY, Kohler RS, Everest-Dass AV, et al. Transition of mesenchymal and epithelial cancer cells depends on alpha1-4 galactosyltransferase-mediated glycosphingolipids. Cancer Res. 2018;78(11):2952–2965. doi: 10.1158/0008-5472.CAN-17-2223. [DOI] [PubMed] [Google Scholar]
- 35.Cumin C, Huang YL, Rossdam C, Ruoff F, Cespedes SP, Liang CY, et al. Glycosphingolipids are mediators of cancer plasticity through independent signaling pathways. Cell Rep. 2022;40(7) doi: 10.1016/j.celrep.2022.111181. [DOI] [PubMed] [Google Scholar]
- 36.Hung TH, Hung JT, Wu CE, Huang Y, Lee CW, Yeh CT, et al. Globo H is a promising theranostic marker for intrahepatic cholangiocarcinoma. Hepatol Commun. 2022;6(1):194–208. doi: 10.1002/hep4.1800. [DOI] [PMC free article] [PubMed] [Google Scholar]
- 37.Cheng JY, Wang SH, Lin J, Tsai YC, Yu J, Wu JC, et al. Globo-H ceramide shed from cancer cells triggers translin-associated factor X-dependent angiogenesis. Cancer Res. 2014;74(23):6856–6866. doi: 10.1158/0008-5472.CAN-14-1651. [DOI] [PubMed] [Google Scholar]
- 38.Gottschling S, Jensen K, Warth A, Herth FJ, Thomas M, Schnabel PA, et al. Stage-specific embryonic antigen-4 is expressed in basaloid lung cancer and associated with poor prognosis. Eur Respir J. 2013;41(3):656–663. doi: 10.1183/09031936.00225711. [DOI] [PubMed] [Google Scholar]
- 39.Nakamura Y, Miyata Y, Matsuo T, Shida Y, Hakariya T, Ohba K, et al. Stage-specific embryonic antigen-4 is a histological marker reflecting the malignant behavior of prostate cancer. Glycoconj J. 2019;36(5):409–418. doi: 10.1007/s10719-019-09882-2. [DOI] [PMC free article] [PubMed] [Google Scholar]
- 40.Lou YW, Wang PY, Yeh SC, Chuang PK, Li ST, Wu CY, et al. Stage-specific embryonic antigen-4 as a potential therapeutic target in glioblastoma multiforme and other cancers. Proc Natl Acad Sci USA. 2014;111(7):2482–2487. doi: 10.1073/pnas.1400283111. [DOI] [PMC free article] [PubMed] [Google Scholar]
- 41.Ye F, Li Y, Hu Y, Zhou C, Hu Y, Chen H. Stage-specific embryonic antigen 4 expression in epithelial ovarian carcinoma. Int J Gynecol Cancer. 2010;20(6):958–964. doi: 10.1111/IGC.0b013e3181e6fee1. [DOI] [PubMed] [Google Scholar]
- 42.Sivasubramaniyan K, Harichandan A, Schilbach K, Mack AF, Bedke J, Stenzl A, et al. Expression of stage-specific embryonic antigen-4 (SSEA-4) defines spontaneous loss of epithelial phenotype in human solid tumor cells. Glycobiology. 2015;25(8):902–917. doi: 10.1093/glycob/cwv032. [DOI] [PMC free article] [PubMed] [Google Scholar]
- 43.Zhu J, Wang Y, Yu Y, Wang Z, Zhu T, Xu X, et al. Aberrant fucosylation of glycosphingolipids in human hepatocellular carcinoma tissues. Liver Int. 2014;34(1):147–160. doi: 10.1111/liv.12265. [DOI] [PubMed] [Google Scholar]
- 44.Huang CS, Yu AL, Tseng LM, Chow LWC, Hou MF, Hurvitz SA, et al. Globo H-KLH vaccine adagloxad simolenin (OBI-822)/OBI-821 in patients with metastatic breast cancer: phase II randomized, placebo-controlled study. J Immunother Cancer. 2020;8(2) doi: 10.1136/jitc-2019-000342. [DOI] [PMC free article] [PubMed] [Google Scholar]
- 45.Hung JT, Chen IJ, Ueng SH, Huang CS, Chen SC, Chen MY, et al. The clinical relevance of humoral immune responses to Globo H-KLH vaccine adagloxad simolenin (OBI-822)/OBI-821 and expression of Globo H in metastatic breast cancer. J Immunother Cancer. 2022;10(6) doi: 10.1136/jitc-2021-004312. [DOI] [PMC free article] [PubMed] [Google Scholar]
- 46.Ruggiero FM, Rodriguez-Walker M, Daniotti JL. Exploiting the internalization feature of an antibody against the glycosphingolipid SSEA-4 to deliver immunotoxins in breast cancer cells. Immunol Cell Biol. 2020;98(3):187–202. doi: 10.1111/imcb.12314. [DOI] [PubMed] [Google Scholar]
- 47.Hu J, Jing H, Lin H. Sirtuin inhibitors as anticancer agents. Future Med Chem. 2014;6(8):945–966. doi: 10.4155/fmc.14.44. [DOI] [PMC free article] [PubMed] [Google Scholar]
- 48.Carafa V, Altucci L, Nebbioso A. Dual tumor suppressor and tumor promoter action of sirtuins in determining malignant phenotype. Front Pharmacol. 2019;10:38. doi: 10.3389/fphar.2019.00038. [DOI] [PMC free article] [PubMed] [Google Scholar]
- 49.Cai BH, Lee HY, Chou CK, Wu PH, Huang HC, Chao CC, et al. SSEA3 and sialyl lewis a glycan expression is controlled by B3GALT5 LTR through lamin A-NFYA and SIRT1-STAT3 signaling in human ES cells. Cells. 2020;9(1):177. doi: 10.3390/cells9010177. [DOI] [PMC free article] [PubMed] [Google Scholar]
- 50.Karlsson M, Zhang C, Mear L, Zhong W, Digre A, Katona B, et al. A single-cell type transcriptomics map of human tissues. Sci Adv. 2021;7(31):eabh2169. doi: 10.1126/sciadv.abh2169. [DOI] [PMC free article] [PubMed] [Google Scholar]
- 51.Chen J, Chen H, Pan L. SIRT1 and gynecological malignancies (Review) Oncol Rep. 2021;45(4):43. doi: 10.3892/or.2021.7994. [DOI] [PMC free article] [PubMed] [Google Scholar]
Associated Data
This section collects any data citations, data availability statements, or supplementary materials included in this article.
Supplementary Materials
Multimedia component 1
Data Availability Statement
Not applicable.