

Summary
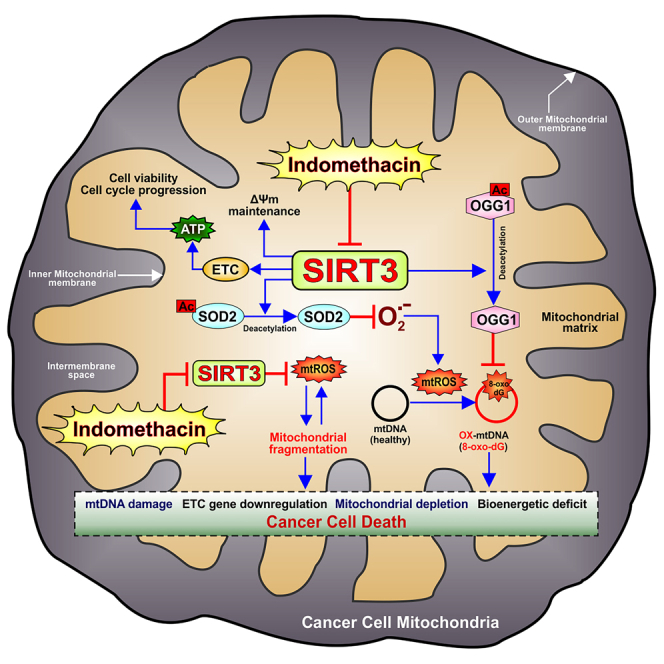
Gastric cancer (GC) is a deadly malignancy that demands effective therapeutic intervention capitalizing unique drug target/s. Here, we report that indomethacin, a cyclooxygenase non-selective non-steroidal anti-inflammatory drug, arrests GC cell growth by targeting mitochondrial deacetylase Sirtuin 3 (SIRT3). Interaction study revealed that indomethacin competitively inhibited SIRT3 by binding to nicotinamide adenine dinucleotide (NAD)-binding site. The Cancer Genome Atlas data meta-analysis indicated poor prognosis associated with high SIRT3 expression in GC. Further, transcriptome sequencing data of human gastric adenocarcinoma cells revealed that indomethacin treatment severely downregulated SIRT3. Indomethacin-induced SIRT3 downregulation augmented SOD2 and OGG1 acetylation, leading to mitochondrial redox dyshomeostasis, mtDNA damage, respiratory chain failure, bioenergetic crisis, mitochondrial fragmentation, and apoptosis via blocking the AMPK/PGC1α/SIRT3 axis. Indomethacin also downregulated SIRT3 regulators ERRα and PGC1α. Further, SIRT3 knockdown aggravated indomethacin-induced mitochondrial dysfunction as well as blocked cell-cycle progression to increase cell death. Thus, we reveal how indomethacin induces GC cell death by disrupting SIRT3 signaling.
Subject areas: Cell biology, Cancer
Graphical abstract
Highlights
-
•
Indomethacin arrests gastric cancer cell growth and induces apoptosis by targeting SIRT3
-
•
Indomethacin inhibits SIRT3 deacetylase activity via binding-site overlap with NAD
-
•
SIRT3 reduction by indomethacin augments intra-mitochondrial O2.- and 8-oxo-dG level
-
•
Indomethacin blocks AMPK-PGC1α signaling pathway to downregulate SIRT3 expression
Cell biology; Cancer
Introduction
Gastric cancer (GC) is the 5th most commonly (5.6%) diagnosed cancer and 4th most leading (7.7%) cause of cancer deaths1 with a low 5-year overall survival (OS) rate.2 Despite much advances in experimental and clinical anti-cancer research, treatment options for advanced-stage GC are still inadequate owing to the molecular heterogeneity and complex pathogenesis.3 Thus, precisely understanding the pathological basis along with identifying potential anti-GC strategies is warranted. Further, rampantly escalating anti-neoplastic drug resistance in gastric malignancies alarmingly underscores the urgency for identifying convenient druggable targets as well as associated low-cost therapeutic options/drugs which can also tame down the financial burden of expensive immunotherapy modalities. Repurposing of already Food and Drug Administration (FDA)-approved drugs as effective neo-adjuvant anti-cancer agents is therefore increasingly exploited to overcome anti-cancer multidrug resistance as well as in cancer stem cell therapeutics. Contextually, non-steroidal anti-inflammatory drugs (NSAIDs) have emerged, of late, as promising anti-neoplastic agents against diverse high-risk malignancies.4,5,6,7
Mitochondrial DNAs (mtDNAs) in cancer cells are highly susceptible to oxidative genotoxic stress by anti-cancer drugs.8 Contextually, 8-oxoguanine DNA glycosylase (OGG1) and superoxide dismutase 2 (SOD2), the major mitochondrial proteins mitigating oxidative damage, are regulated by deacetylation-dependent stabilization.9 Further, diverse proteins involved in glycolysis, tricarboxylic acid (TCA) cycle, lipid and amino acid metabolism, and redox homeostasis as well as regulators of mitochondrial biogenesis, dynamics, mitochondrial permeability transition pore opening, and components of electron transport chain (ETC) are also regulated by deacetylation.10 This highlights the importance of deacetylation as a crucial regulator of cellular pathophysiology. In this regard, longevity-promoting NAD+-dependent mitochondrial deacetylase sirtuin 3 (SIRT3), popularly referred to as the “guardian of mitochondria,” is critically implicated in myriad diseases including cancer.11 Although toxic effects of NSAIDs in cancer cells were suggested,5,7 it is yet unexplored whether SIRT3 deacetylase is targeted by these age-old wonder drugs in GC cells as a part of their cytotoxic effect, if at all.
Here, we report with mechanistic details that indomethacin, a known cyclooxygenase (COX) non-selective anti-inflammatory drug, induces human gastric adenocarcinoma (AGS) cell death by negatively targeting both the activity and expression of SIRT3 thereby causing mitochondrial pathology. Moreover, indomethacin was also found to directly suppress SIRT3 regulators, PGC1α and ERRα, as well as affect AMP-activated protein kinase (AMPK) activation to block the AMPK-PGC1α-SIRT3 signaling axis. This study certainly provides novel therapeutic insights into indomethacin-based anti-neoplastic treatment modalities wherein targeted SIRT3 inhibition can be strategically exploited to optimize the benefits toward anti-cancer therapeutics.
Results
Indomethacin triggers GC cell death by inflicting mitochondrial pathology
Indomethacin was found to induce GC cell death in both dose- and time-dependent manner (Figures 1A–1C). We subsequently ventured to explore the detailed mechanism through which it induces GC cell death. As mitochondrial integrity is essential for maintaining cellular health, we immediately checked mitochondrial functional parameters. Contextually, mitochondrial dysfunction was clearly evident from significant mitochondrial depolarization (Figure 1D) and ATP depletion in indomethacin-treated AGS cells (Figure 1E). Next, we checked mitochondrial dynamics and quality control as mitochondrial fission-fusion homeostasis is essential for maintaining cellular metabolic integrity. Interestingly, upon indomethacin treatment significant upregulation of fissogenic regulators such as phospho-DRP1ser616 and total DRP1 and depletion of fusogenic mediators including OPA1 and MFN1 as well as phospho-DRP1ser637 were observed indicating that mitochondrial dynamics trajected more toward fission (Figure 1F). To check whether this hyperfission is associated with mitophagy, we followed the protein expression profiles of key mitophagy regulators like PINK1 and PARKIN. To this extent, upregulation of PINK1 and PARKIN clearly indicated elevation of mitophagy upon indomethacin treatment (Figure 1G). Moreover, reduction of TOM20 expression also validated the depletion of mitochondrial copy number as a logical consequence of elevated mitophagy (Figure 1G). Further, we evaluated cell-cycle parameters to understand the impact of mitochondrial dysfunction on cell proliferation. In this regard, indomethacin-induced mitochondrial dysfunction was found to be associated with altered expression of crucial components of cell cycle (Figure 1H). Indomethacin treatment drastically reduced the expression of CDK4, CDK2, cyclin D1, and cyclin D3 implying the suppressive effect of indomethacin on AGS cell-cycle progression. Flow cytometry analysis further revealed the overall impact of indomethacin on the different stages of cell cycle wherein it was clearly evident that there was a significant elevation in the sub-G0 population along with a considerable reduction in the S and G2/M phase population in the indomethacin-treated cells (Figure 1I). Finally, it was observed that indomethacin triggered the activation of apoptosis as evident from the elevation of Bcl-2 associated X-protein (BAX) and poly (ADP-ribose) polymerase (PARP) cleavage but depletion of BCL-xL (Figure 1J). Direct mitochondrial involvement, via activation of intrinsic apoptosis, was reflected as elevation of cleaved caspase-9 and caspase-3 as well as cytochrome c (Figure 1K).
Figure 1.

Indomethacin detrimentally affects gastric cancer (AGS) cell viability by inducing mitochondrial dysfunction and cell death
(A) Bar graph showing dose response pattern of indomethacin, checked as AGS cell viability by following MTT reduction.
(B) Phase-contrast micrographs (representative images) of AGS cells treated with indicated indomethacin for the indicated duration (in hours).
(C) Kinetic evaluation of AGS cell viability as measured by MTT reduction assay in indomethacin-treated cells.
(D) Flow cytometric detection of mitochondrial transmembrane potential change (ΔΨm) in AGS cells upon indomethacin treatment. 10,000 cells were checked per set and numerical values within the quadrants indicate the percentage of cells therein.
(E) Bar graph showing ATP content in “Con”- and “Indo”-treated AGS cells for 24 h.
(F‒H) Immunoblots of pDRP1ser637, DRP1, pDRP1ser616, OPA1, and MFN1 (F), PINK1, PARKIN, and TOM 20 (G), Cyclin D1, Cyclin D3, CDK4, CDK2 (H).
(I) Flow cytometry analysis of cell cycle in “Con”- and “Indo”-treated cells. 10,000 cells were checked per set; pie charts are presented as insets of the respective histograms.
(J and K) Immunoblots of BAX, BCL-xL and cleaved PARP (J), cleaved caspase-9, cytochrome c, and cleaved caspase-3 (K) in “con”- and “indo”-treated AGS cells with 0.5 mM indomethacin for 24 h. ACTIN was used as the loading control for all the immunoblots. Representative blot alongside of bar graph (F–H, J–K). (A, C) Data are mean ± SD. ∗∗p < 0.01; ∗∗∗p < 0.001; ∗∗∗∗p < 0.0001 versus “indomethacin 0 h” calculated by one-way ANOVA followed by Bonferroni’s post hoc test. (E–H, J–K), Data are mean ± SD. ∗p < 0.05; ∗∗p < 0.01 versus control calculated by unpaired Student’s t test with Welch correction. ns: non-significant. The number of independently repeated experiments is 3 in every experiment.
Indomethacin inhibited mitochondrial deacetylase SIRT3 and interacted with the NAD-binding site
As indomethacin induces mitochondrial dysfunction and it has myriad COX-independent effects, we zoomed into the intricacies of mitochondrial metabolism and checked whether indomethacin affects the function of SIRT3, the guardian of mitochondria that regulates several aspects of mitochondrial functions by virtue of its deacetylase activity. By in silico screening, we primarily checked whether indomethacin at all interacts with SIRT3 using accurate molecular docking. Thermodynamic stability of SIRT3-indomethacin complex and binding free energy of indomethacin were obtained by screening against SIRT3 conformers using molecular docking studies using a stochastic algorithm (randomly screening through several possible configurations and repeating the process until convergence is achieved). 31 crystal structures (retrieved 1 Sept 2022) of SIRT3 (UniProtKB: SIR3_HUMAN) were obtained (Table S1) from the Protein Data Bank (PDB) or the PDB-REDO repositories.12 Based on the model qualities (according to the Worldwide Protein Data Bank [wwPDB] validation report available at the PDB website), 22 crystal structures with good geometries and electron density map fitting were selected for docking studies with indomethacin (Table S2). Indomethacin indeed appeared to be a potent ligand with fairly low binding energy (−10.06 kcal/mol) with SIRT3 (Figure S1; Table S2). Mean binding energy of indomethacin across different conformers of SIRT3 was found to be −8.43 ± 0.89 kcal/mol, indicating a strong interaction with a binding dissociation constant of 1.77 ± 2.8 μM. Computed binding energy for the control ligands, 5-bromo resveratrol (PDB ID: BVB in 4C7B) and (S)-selisistat (PDB ID: OCZ in 4BV3), was found to be −6.21 kcal/mol and −9.23 kcal/mol, respectively. Thus, indomethacin binding with SIRT3 is better than BVB and comparable to OCZ. However, the binding site of indomethacin does not overlap with that of BVB or OCZ (Figure S2). Based on the clustering of binding patterns, most probable binding modes for indomethacin are presented (Figure S1). When compared with NAD binding (Figure S2), indomethacin binding indicates competitive mode of interaction with NAD because of binding-site overlap. Binding energies for NAD and ADP-D-ribose are −10.14 kcal/mol and −9.07 kcal/mol, respectively, which are similar to binding energy of indomethacin suggesting plausible competition for binding site between indomethacin and NAD.
Molecular dynamics simulation was further performed with four low-energy/high-frequency-bound conformers (Figure S1) of indomethacin as obtained by docking to probe the stability of the binding modes and understand the specific interactions involved. Apo- and NAD-bound holo-conformations of SIRT3 were studied as controls. Snapshots of protein/protein-ligand complex structures at 2.4 ns intervals and superimposed for comparison are presented (Figures 2A–2F) for qualitative understanding of the stability of apo-, holo-, and indomethacin-bound complexes. Further, quantitative depiction is presented (Figures 2G–2I) in terms of time-correlated or time-averaged standard deviations (root-mean-square deviation [RMSD] and root-mean-square fluctuation [RMSF], respectively). Apoprotein as well as the NAD-bound holoprotein shows impeccable structural integrity in water. Initial 2–3 Å increase in RMSD is observed due to the relaxation of crystal structure in solvent environment (Figure 2G). Once equilibrated, both the apoprotein and holoprotein maintained a stable conformation throughout the simulation timescale. Out of the four probable complexes of indomethacin, 5z94 complex was the most stable followed by 3glt complex. In the case of the 4bvf complex, the ligand moved to the distal end of the NAD-binding tunnel and attained a stable conformation. However, in 4jt8, the ligand dissociated from the binding site (marked by sudden increase in RMSD at around 80 ns [Figure 2H]). No stable interaction could be observed in the rest of the simulation trajectory although the ligand remained bound to the surface of the enzyme. Ligand binding in all the cases was found to induce perturbations in the helical module in the zinc-binding domain (Figure S3). This is also reflected in the increased Cα RMSF (Figure 2I).
Figure 2.

Indomethacin inhibits deacetylase activity of SIRT3 and shows competitive inhibition by binding to NAD-binding site
(A) Apoenzyme (PDB: 3glu) control in SPC water under OPLS-AA force field for 240 ns. 100 snapshots at 2.4 ns intervals are superimposed. Protein is shown in ribbon representation and N-terminal to C-terminal is colored in rainbow (blue to red). Active site is labeled.
(B) NAD+-bound holoenzyme (PDB: 4bv3) control. NAD+ in white stick model is labeled, and the binding region is encircled with white dashed line.
(C) 4jt8 indomethacin complex. Indomethacin is shown in white stick model, and the binding region is encircled with white dashed line.
(D) 3glt indomethacin complex.
(E) 4bvf indomethacin complex.
(F) 5z94 indomethacin complex.
(G) Protein backbone Cα RMSD for apoenzyme, holoenzyme, and all the indomethacin-bound complexes of apoenzyme with respect to the initial conformations.
(H) RMSD of indomethacin in all the four bound complexes with respect to the initial conformation of the complexes.
(I) Residue-wise fluctuations (RMSFs) in protein backbone for apo, holo, and indomethacin-bound conditions.
(J‒L) Time average interaction of indomethacin with sirtuin 3 (5z94, 3glt. 5bvf) as obtained from molecular dynamics simulations. Three possible conformations are shown. 5z94 and 3glt show binding near the active site. His248. 4bvf shows binding in the distal part of NAD+ binding channel. (J) In 5z94, catalytic His248 forms a hydrogen bond (pink arrow from H donor to acceptor) with the amide carbonyl moiety of indomethacin. Phe180 showed pi-stacking interaction (green lines) with the indole ring of indomethacin. Carboxylate group of indomethacin formed two water bridges through H bonds (pink arrows) with Glu177 and a salt bridge (red/blue line) with the positively charged Arg158. Phe157, Phe294, and Ile230 formed hydrophobic contacts with chlorobenzene, indole, and methoxy moieties, respectively. (K) 3glt shows another stable bound conformation of indomethacin within the active site of the enzyme. In this conformation catalytic His248 forms pi-stacking with chlorobenzene moiety of indomethacin along with Phe180 (green lines). Positively charged Arg158 forms cation-pi interaction (red line) with chlorobenzene. Phe294 forms pi-pi stacking (green line) with the indole moiety of indomethacin. Gly295 forms a hydrogen bond (pink arrow from H donor to acceptor). (L) 4bvf shows yet another stable bound conformation in the distal part of NAD+ binding tunnel. In this conformation, the carboxylate group of indomethacin forms water bridges with Thr320 and Glu323 and a direct hydrogen bond (pink arrows) with Ser321. Arg345 forms a cation-pi interaction with the indole and an H bond with the amide carbonyl of indomethacin. Val366 forms hydrophobic contacts with chlorobenzene moiety.
(M) Isothermal titration plot for rhSIRT3-indomethacin interaction.
(N) SIRT3 deacetylase activity in mitochondrial extract treated with 0.5 mM indomethacin. Data are mean ± SD. ∗∗∗p < 0.001 versus indomethacin 0 mM calculated by unpaired Student’s t test with Welch correction.
(O) Dose-dependent inhibition of rhSIRT3 deacetylase activity by indomethacin. Data are mean ± SD. ∗∗∗∗p < 0.0001 versus indomethacin 0 mM calculated using one-way ANOVA with Bonferroni’s post hoc test. See also Figures S1–S5.
Further, interacting amino acid residues and the important functional groups of indomethacin were identified by analyzing the protein ligand contacts over the simulation trajectory (Figures S4 and S5). Significant SIRT3-ligand contacts were observed at least 20% of times during the simulation for three most stable conformers (5z94, 3glt, and 4bvf) (Figures 2J‒2L). In 5z94 and 3glt, binding occurs near the catalytic His248 residue with similar interactions. His248 can form a hydrogen bond with the amide carbonyl (57%) or a pi-stacking interaction (42%) with the chlorobenzene moiety of indomethacin. Phe180 and Phe294 are also involved in pi-stacking interaction with the indole ring (44%) or chlorobenzene (29%) of indomethacin. Arg158 is an important NAD-binding residue that was found to form a salt bridge (24%) with the carboxylate group of indomethacin. It can also form a cation-pi interaction (23%) with the chlorobenzene group. The carboxylate group of indomethacin was found to interact with Glu177 of the protein via two water bridges (36%). Gly295 can stabilize the methoxy group by donating a hydrogen bond (38%). Apart from these specific interactions, Phe157, Phe294, and Ile230 formed hydrophobic contacts with chlorobenzene, indole, and methoxy moieties, respectively (Figures 2J and 2K). On the other hand, 4bvf shows a stable bound conformation of indomethacin in the distal part of NAD-binding tunnel (Figure 2L). In this conformation, the carboxylate group of indomethacin forms water bridges with Thr320 and Glu323 and a direct hydrogen bond with Ser321. Arg345 forms a cation-pi interaction with the indole and a hydrogen bond with the amide carbonyl of indomethacin. Val366 forms hydrophobic contacts with chlorobenzene moiety. Thus, the amide carbonyl, indole, carboxylate, chlorobenzene, and the methoxy moiety of indomethacin were found to play significant roles in the interaction with SIRT3. SIRT3-indomethacin interaction, observed in silico, was next validated using isothermal calorimetry (ITC). Recombinant human SIRT3 (rhSIRT3) was gradually titrated with indomethacin, and the detectable heat changes were measured using a sensitive micro-calorimeter (Figure 2M). A series of initial indomethacin injections were made wherein the micro-calorimeter measured the heat release. The quantity of heat measured, as depicted in the isotherm, was found to be directly proportional to the amount of rhSIRT3-indomethacin binding (measured in μJ/s). The molar ratio between indomethacin and rhSIRT3 was gradually increased through a series of indomethacin injections whereupon rhSIRT3 got more and more saturated, thereby resulting less binding of indomethacin. Consequently, the heat change (enthalpy) started to decrease which was documented (Figure 2M). Finally, to explore the fate of SIRT3-indomethacin interaction, we measured the deacetylase activity of SIRT3 in the mitochondrial extract from AGS cells treated with indomethacin (used at a dose that triggered mitochondrial pathology and cell death mentioned in the precious data). It was clearly observed that indomethacin significantly reduced the deacetylase activity of SIRT3 (Figure 2N). Further, to check whether indomethacin per se or any of its metabolic by-product causes this SIRT3 inhibition, we directly measured the activity of rhSIRT3 deacetylase in presence/absence of different concentrations of indomethacin. Fluorescence, generated by rhSIRT3 deacetylase-dependent modification of the fluorescent-labeled acetylated substrate peptide, indicated that indomethacin significantly inhibited the deacetylase activity of rhSIRT3 (Figure 2O).
Human dataset mining revealed the prognostic relevance of SIRT3 in GC
Before delving deeper into further exploring the mechanistic basis of indomethacin-SIRT3 interaction and its effect on AGS cells, we checked whether SIRT3 abundance has any direct clinical impact on GC. The Cancer Genome Atlas (TCGA) data for normal and patient-derived stomach adenocarcinom (STAD) samples were analyzed. Difference in SIRT3 expression between primary gastric tumor (n = 415) and normal tissues (n = 34) was followed (Figure 3A). The University of Alabama at Birmingham Cancer data analysis portal (UALCAN) analysis revealed that tumor samples have significantly higher median (40.549 transcript per million) SIRT3 transcripts compared to normal (19.018 transcript per million). Further, we checked the concordance of the gene expression pattern with SIRT3 protein expression. Immunohistochemical archives of representative normal and GC samples in the Human Protein Atlas database (stained with the antibody CAB037142) revealed high expression of SIRT3 in the tumor cells compared to medium expression in the glandular cells (Figure 3B). The representative image of the patient sample, in the figure, indicates intestinal-type GC. Next, UALCAN analysis of SIRT3 expression based on pathological staging of GC revealed that SIRT3 expression is higher in the late-stage tumors implying its plausible association with tumor progression and invasion (Figure 3C). Moreover, high SIRT3 expression was also documented in the various histological subtypes of GC as evident in the TCGA patient data (Figure 3D). Because the predominance of GC varies in the different races, we checked SIRT3 expression in the patient data from Caucasian, African American, and Asian samples and found that, while there is significant difference in SIRT3 expression between normal and tumor samples, there was no apparent significant difference between the races implying elevated SIRT3 expression as a general property of gastric malignancies (Figure 3E). All these associations logically warranted to explore the prognostic relevance of elevated SIRT3 transcripts. Kaplan-Meier survival curves indeed revealed that high SIRT3 expression is associated with low median OS of 24.6 months, compared to 99.4 months in low SIRT3 expression (hazard ratio [HR] = 1.99, log rank P = 3e-11) (Figure 3F), thereby suggesting bad prognosis. Cumulatively, TCGA data indicate that SIRT3 expression can be a prognostic indicator of mortality risk in GC.
Figure 3.

High SIRT3 expression is associated with poor prognosis of GC
(A) UALCAN analysis for the correlation between SIRT3 mRNA expression and human gastric adenocarcinoma; p < 1E-12 for Normal-vs-Primary tumor.
(B) SIRT3 expression in gastric cancer and normal tissues from the Human Protein Atlas (HPA) database. Immunohistochemical staining done with antibody CAB037142.
(C) UALCAN analysis for the correlation between SIRT3 mRNA expression and pathological stages of human gastric adenocarcinoma; N-vs-S1 6.417E-04, N-vs-S2 <1E-12, N-vs-S3 1.624E-12, N-vs-S4 6.911E-11.
(D) UALCAN analysis for the correlation between Sirt3 mRNA expression and histological subtypes (Adenocarcinoma NOS, Adenocarcinoma Diffuse, Adenocarcinoma SignetRing, Intestinal Adenocarcinoma NOS, Intestinal Adenocarcinoma Tubular, Intestinal Adenocarcinoma Mucinous, Intestinal Adenocarcinoma Papillary) of human gastric adenocarcinoma; p 1.62458935193399E-12 for Normal-vs-Adenocarcinoma (NOS), 5.06639175057444E-12 for Normal-vs-Adenocarcinoma (Diffuse), 1.16906484493029E-13 for Normal-vs-Adenocarcinoma (Signet Ring), 1.63247193540883E-12 for Normal-vs-Intestinal Adenocarcinoma (NOS), 1.6251444634463E-12 for Normal-vs-Intestinal Adenocarcinoma(Tubular), 1.756760E-04 for Normal-vs-Intestinal Adenocarcinoma(Mucinous), 8.439600E-03 for Normal-vs-Intestinal Adenocarcinoma(Papillary).
(E) UALCAN analysis for the correlation between SIRT3 mRNA expression and human races (Caucasian, African American, and Asian); p 1.62436730732907E-12 for Normal-vs-Caucasian, 7.583800E-03 for Normal-vs-African American, 1.62447832963153E-12 for Normal-vs-Asian.
(F) Kaplan-Meier survival curve comparing the high and low expressions of SIRT3 (n = 875) in overall survival (OS) checked with mRNA gene chip Affy ID: 221913_at; HR: 1.99 (1.62–2.44), log rank P: 3.0E-11, FDR: 1%.
Transcriptome analysis revealed SIRT3 as a major hub gene targeted by indomethacin to detrimentally affect multiple metabolic pathways in AGS cells
So far, it was found that indomethacin directly inhibited the deacetylated activity of SIRT3. Now we were interested to know whether it only inhibits the activity or it has any effect on the expression of SIRT3 in human GC cells. To check the status of SIRT3 upon indomethacin treatment, high-depth next-generation transcriptome sequencing of control and indomethacin-treated AGS cells was performed for an overall probing of SIRT3 and associated genes as well as signaling pathways/gene expression programs affected by indomethacin. Heatmap (Figure 4A) showing the differentially expressed genes (DEGs), analyzed with a log fold change (FC) cutoff of 1.5 (false discovery rate [FDR] ≤0.05), revealed clear separate sample clustering, with 3,984 upregulated and 4,474 downregulated genes in indomethacin-treated cells compared to “control” (File S1A–S1C) (GSE202140). Gene enrichment analysis with IPA (ingenuity pathway analysis) identified gene expression programs among which “Sirtuin signaling pathway” and associated DEGs drew special attention owing to their association with myriad cellular events (Figures 4B and 4C). We subsequently used MCODE13 plugin in Cytoscape14 to build the gene interaction network and screened the hub gene/s regulating mitochondrial metabolism and cellular integrity. Notably, SIRT3 appeared as one of the top hub genes controlling myriad signaling pathways. Other crucial regulators of mitochondrial metabolism including ETC complex subunits, SOD, FOXO3/1, voltage-dependent anion channel 1 (VDAC1), mammalian target of rapamycin (MTOR), and nuclear factor κB (NF-κB) subunits were also observed (Figure 4D). IPA-based interactome analysis further indicated that SIRT3 is intricately connected with most of these players. The putative association of SIRT3 with indomethacin-associated GC cell death, as reflected in transcriptome data, fascinated us to delve deeper into the functional aspects of SIRT3. We further zoomed into the heatmaps for checking specific gene expression profiles altered by indomethacin including “mitochondrial central dogma” (Figure 4E), oxidative phosphorylation (“OXPHOS”) (Figures 4F–4H), and major arms of cancer metabolism including carbohydrate (Figures 4I and 4J) and fatty acid (Figure 4K) metabolism. Incidentally, majority of the DEGs reflected a significant gross downregulation upon indomethacin treatment thereby reiterating the multidimensional damage caused by indomethacin. Further the data also implied that, being a dominant regulator of cellular metabolism and longevity, loss of SIRT3 during indomethacin treatment was logically associated with activation of myriad subcellular factors and signaling pathways underlying metabolic crisis and cell death.
Figure 4.

Transcriptome data indicating cellular metabolic crisis and mitochondrial dysfunction by indomethacin in gastric cancer cells
(A) Heatmap shows separate clustering of “Con” and “Indo” (FDR ≤ 0.05). Euclidean distance metric was used while clustering the gene expression data. The expression value of genes analyzed with fold change cutoff of 1.5; color gradient scale with white being highly downregulated to green being highly upregulated.
(B) Dot plot showing enriched canonical pathways. The size of dots represents the proportion of genes involved in the particular signaling/pathway while the range of color indicates Bonferroni corrected p values (-log transformed). The ratio represents the number of genes in fraction with respect to the total number of genes that map to the same pathway.
(C) Bar graph showing the disease and functions enriched in the “Indo” set.
(D) Hub gene network. The expression values of genes are represented with color gradient scale with blue being highly downregulated to red being highly upregulated.
(E–K) Heatmap shows the association of a subset of DEGs with mitochondrial central dogma including “mtDNA maintenance,” “mtRNA metabolism.” and “mitochondrial translation” (E), OXPHOS subunits including genes for complex I (CI), complex II (CII), complex III (CIII), complex IV (CIV), and complex V (CV) (F), OXPHOS assembly factors including genes for complex I (CI), complex II (CII), complex III (CIII), complex IV (CIV), and complex V (CV) (G), OXPHOS enzymes and cofactors (H), “glycolysis” and “gluconeogenesis” (I), “TCA cycle” (J), “fatty acyl CoA synthesis” and “fatty acid β-oxidation” (K) between “Con” and “Indo” (FDR ≤ 0.05). The expression value of genes analyzed with fold change cutoff of 1.5; color gradient scale with blue: downregulated to red: upregulated (E–K). All sequencing experiments were done in triplicates.
Downregulation of indomethacin-induced SIRT3 underlies the reduction of ETC complex gene expression, mitochondrial fragmentation, aberrant mitophagy, and cell death via PGC1α/AMPK-dependent signaling
Downregulation of SIRT3, as indicated in sequencing, was validated by RT-qPCR (Figure 5A) followed by evaluation at the protein level to inquire the effect of indomethacin on SIRT3 protein expression. It was found that indomethacin treatment dose-dependently triggered SIRT3 protein depletion (Figure 5B). Before proceeding further, we compared basal SIRT3 expression profile between GC cells and non-malignant gastric cells (Figure 5C). Immunoblot data clearly indicated that SIRT3 expression was significantly higher in the AGS cells compared to human normal cell line Hs738. Further, it was also observed that a much higher concentration of indomethacin was required for reducing the viability of Hs738 cells as well as downregulating SIRT3 expression, thereby substantiating the fact that indomethacin-induced cell death is strongly associated with inherently upregulated SIRT3 levels in GC cells (Figures S6A‒S6C) and that indomethacin-induced cytotoxicity is more pronounced and attainable at a much lower concentration in AGS cells compared to normal cells. Moving forward, we observed that, in AGS cells, indomethacin time-dependently reduced the expression of SIRT3 in concurrence with downregulating OGG1, a prime SIRT3 target as well as the principal base excision repair protein correcting mtDNA damage (Figure 5D). Because SIRT3 is a deacetylase, we next checked the functional consequence of SIRT3 depletion on the acetylation status of mitochondrial proteome and specifically its major targets OGG1 and SOD2. Acetylation of mitochondrial proteome (Figure 5E) and specifically that of OGG1 and SOD2 (Figure 5F) were significantly elevated along with profound increase of 8-oxo-dG content in mtDNA (Figure 5G). This was found concurrently with significant reduction of SOD2 enzymatic activity (Figure 5H), thereby suggesting mtDNA damage and concerted downregulation of mitochondrial antioxidant defense. Contextually, it is worth mentioning that Kaplan-Meier survival curves for OGG1-high-expressing groups also indicated a lower median OS of 23.2 months (HR = 1.87, log rank p = 6.7e-12) compared to OGG1-low-expressing groups with 77.2 months (Figure S7), thereby reiterating the prognostic relevance of SIRT3-OGG1 duo in GC.
Figure 5.

Indomethacin by downregulating SIRT3 reduces mtDNA-encoded ETC complex gene expression and induces mitochondrial hyperfission and cell death
(A) Quantitative RT-PCR for SIRT3 gene expression in control and indomethacin-treated cells; bar graph indicates fold change in gene expression relative to control (after normalization by GAPDH).
(B) Immunoblot of SIRT3 in AGS cells treated with indomethacin at indicated concentrations for 24 h.
(C) Immunoblot of SIRT3 in Hs738 and AGS cells.
(D) Immunoblots of SIRT3 and OGG1 in AGS cells treated with 0.5 mM indomethacin for the indicated duration. ACTIN was used as the loading control (B–D).
(E) Immunoblot of acetylated lysine in the mitochondrial fraction of AGS cells treated with 0.5 mM indomethacin for 24 h. TOM20 was used as the loading control.
(F) Immunoblots of acetylated OGG1 and acetylated SOD2 in AGS cells treated with 0.5 mM indomethacin for 24 h. ACTIN was used as the loading control.
(G) mtDNA damage as measured by 8-oxo-dG ELISA in AGS cells treated with 0.5 mM indomethacin for 24 h.
(H) Mitochondrial SOD2 activity in AGS cells treated with 0.5 mM indomethacin for 24 h.
(I and J) Immunoblots for PGC1α, ERRα (I), pAMPKα and AMPKα (J) in “‘Con”- and “Indo”-treated AGS cells. ACTIN was used as the loading control. The number of independent experiments is 3 (A–J). Representative blot below the bar graph (B–D) and alongside the bar graph (E and F; I and J). (A, C, E–J), Data are mean ± SD. ∗p < 0.05; ∗∗p < 0.01; ∗∗∗p < 0.001 versus control calculated by unpaired Student’s t test with Welch correction. (B, D) Data are mean ± SD. ∗∗∗p < 0.001; ∗∗∗∗p < 0.0001 versus “Indo 0 mM (B) or Indo 0 h” (D) calculated by one-way ANOVA followed by Bonferroni’s post hoc test. ns: non-significant. The number of independently repeated experiments is 3 in every experiment. See also Figures S6 and S7.
Because indomethacin-dependent SIRT3 reduction accompanied OGG1 downregulation, ATP depletion, and compromised cell viability, we therefore checked the status of mtDNA-encoded ETC subunits and found downregulation of MT-ND1, MT-ND6, MT-ATP6, MT-CYTB, and MT-CO1 corresponding to complex I, V, III, and IV, respectively, after indomethacin treatment (Table S3). To understand the mechanistic basis of indomethacin-induced SIRT3 depletion, we next checked whether indomethacin targets the upstream transcriptional control on SIRT3 expression as induced by peroxisome proliferator-activated receptor gamma coactivator 1 alpha (PGC1α) and estrogen receptor related receptor α (ERRα). We observed that indomethacin drastically reduced PGC1α and ERRα expression (Figure 5I). The data further indicated that indomethacin also suppressed AMPK activation (Figure 5J), thereby affecting the AMPK/PGC-1α/SIRT3 signaling axis which plausibly operates in a feedback loop.15
SIRT3 knockdown aggravates indomethacin-induced mitochondrial damage and cytopathology
If SIRT3 is so essential for regulating cellular and mitochondrial metabolism, we asked what would be the fate of indomethacin treatment in SIRT3-silenced cells. Further, it would also functionally validate the data so far. Phase-contrast images indicated that SIRT3 knockdown amplified indomethacin-induced cytoarchitectural damage (Figure S8). SIRT3 knockdown intensified indomethacin-induced SIRT3 and OGG1 downregulation (Figure 6A) along with aggravating OGG1 and SOD2 acetylation (Figure 6B). Functional impact of SIRT3 knockdown was observed in flow cytometric data indicating intra-mitochondrial superoxide ion (O2.-) elevation (Figure 6C). Intra-cellular 8-oxo-dG accumulation, as observed in confocal micrographs, further validated the consequence of OGG1 downregulation (Figure 6D). Aggravated mitochondrial oxidative stress further translated into loss of mitochondrial integrity as evident from exacerbated mitochondrial depolarization in SIRT3-silenced cells supplemented with indomethacin compared to small interfering RNA against SIRT3 (siSIRT3) or indomethacin treatment alone (Figure 6E).
Figure 6.

SIRT3 silencing aggravates indomethacin-induced mitochondrial dysfunction and associated cytotoxic responses in AGS cells
(A) Immunoblot of SIRT3 and OGG1 in SIRT3-silenced AGS cells treated with indomethacin for 24 h.
(B) Immunoblot of acetylated OGG1 and SOD2 in SIRT3-silenced AGS cells treated with indomethacin for 24 h.
(C) Flow cytometric detection of mitochondrial superoxide ion (O2.-) accumulation in SIRT3-silenced AGS cells treated with indomethacin (0.5 mM) for 24 h.
(D) Confocal immunofluorescent micrographs showing 8-oxo-dG (green) and TOM20 (red) in SIRT3-silenced AGS cells treated with indomethacin (0.5 mM) for 24 h.
(E) Flow cytometric detection of ΔΨm (mitochondrial membrane potential change) in SIRT3-silenced AGS cells treated with indomethacin (0.5 mM) for 24 h; 10,000 cells were checked per set and numerical values within the quadrants indicate the percentage of cells therein.
(F) Live-cell confocal immunofluorescent micrographs showing MitoTracker red-stained mitochondria and Hoechst 33342-stained nuclei for depicting mitochondrial structural dynamics. The size bar indicates 10 μm. At least 3 randomly selected fields were captured and representative micrographs are presented.
(G–I) Immunoblots of OPA1, MFN1 (G), pDRP1ser637, total DRP1, pDRP1ser616, mitochondrial fission factor (MFF) (H), and PINK1, PARKIN, and TOM20 (i) in SIRT3-silenced AGS cells treated with indomethacin (0.5 mM) for 24 h. ACTIN was used as the loading control.
(J) Flow cytometry analysis of cell cycle in SIRT3-silenced AGS cells treated with indomethacin for 24 h 10,000 cell were checked per set; pie charts are presented as insets of the respective histograms.
(K) Cell viability measured by MTT reduction assay in SIRT3-silenced cells treated with indomethacin (0.5 mM) for 24 h.
(L) Flow cytometric detection of Annexin V/PI (propidium iodide)-stained cells for measuring apoptosis in SIRT3-silenced AGS cells treated with indomethacin; 10,000 cells were checked per set. Numerical values within the quadrants indicate the percentage of cells therein.
(M and N) Immunoblots of BCL-xL, BAX, cleaved PARP and cleaved caspase-3 (M) and cleaved caspase-9, and cytochrome c (N) in SIRT3-silenced AGS cells treated with indomethacin (0.5 mM) for 24 h. For immunoblots (A,B, G–I, M,N) ACTIN was used as the loading control and representative blots presented below the bar graphs. Data are mean ± SD. ∗p < 0.05; ∗∗p < 0.01; ∗∗∗p < 0.001; ∗∗∗∗p < 0.0001 versus “Con siRNA” and #p < 0.05; ##p < 0.01; ###p < 0.001 versus “Indo.” Unpaired Student’s t test with Welch correction was used to compare “siSIRT3” versus “Con siRNA” while one-way ANOVA followed by Bonferroni’s post hoc test was used to compare “Indo” and “siSIRT3+Indo” versus “Con siRNA.” ns: non-significant. For confocal microscopy, at least 3 randomly selected fields were captured and a representative image has been provided. The number of independently repeated experiments is 3 in every case. Also see Figure S8.
Loss of mitochondrial functional integrity got clearly reflected in mitochondrial structure which indicated profuse hyperfission as evident from high-resolution confocal micrographs. Mitochondria displayed highly fragmented and perinuclearly clustered punctate state in indomethacin-treated cells compared to filamentous mitochondria in control-small interfering RNA (siRNA)-treated cells. Moreover, SIRT3 silencing further intensified shrinkage, clustering, and fragmentation of mitochondria (Figure 6F). Mitochondrial fragmentation was also confirmed from OPA1, MFN1, and phospho-DRP1ser637 reduction and MFF, phospho-DRP1ser616, and DRP1 elevation (Figures 6G and 6H). In fact, mitochondrial depletion and aberrant mitophagy also synchronously progressed with hyperfission (in absence of any compensatory rescuing effect of mitochondrial biogenesis) as evident from the concerted elevation of key mitophagy regulators PINK1 and PARKIN and reduction of TOM20 (Figure 6I). The cumulative impact of mitochondrial dysfunction due to indomethacin treatment under SIRT3-silenced state ultimately reflected in drastic deterioration in cell cycle (as evident from significant increase in sub-G0 population) (Figure 6J) coupled with exacerbated reduction of cell viability (Figure 6K) and increase in cell death (Figures 6L and 6M). Precisely, contribution of intrinsic apoptosis was clearly evident from elevation of caspase-9 and cytochrome c (Figure 6N). Collectively, detrimental impact of ‘siSIRT3 + indomethacin’ was clearly much higher compared to either siSIRT3 or indomethacin treatment alone.
Indomethacin downregulates transcriptional regulators of SIRT3 and blocks the feedback loop of AMPK/PGC1α/SIRT3 signaling
So far, we observed that indomethacin-induced mitochondrial pathology and AGS cell death involved suppression of AMPK/PGC-1α/SIRT3 signaling axis. For further validation, we checked whether suppression of SIRT3 transcriptional regulators, per se, exerts any effect on indomethacin treatment. We observed that silencing PGC1α or ERRα significantly reduces SIRT3 expression. In addition, indomethacin treatment actually aggravated the SIRT3-downregulating effect of PGC1α or ERRα knockdown (Figures 7A and 7B) to further worsen the cytoarchitectural damage (Figure S8) and intensify the deterioration of cell viability (Figures 7C and 7D). Moreover, SIRT3 silencing also aggravated the direct inhibitory effect of indomethacin on PGC1α and ERRα as well as activation of AMPKα (Figures 7E and 7F) to confirm the inhibitory effect on the feedback loop of AMPK/PGC-1α/SIRT3 signaling.
Figure 7.

Indomethacin downregulates transcriptional regulators of SIRT3 and reduces AMPK phosphorylation
(A) Immunoblots of PGC1α and SIRT3 in PGC1α-silenced AGS cells treated with 0.5 mM indomethacin.
(B) Immunoblots of ERRα and SIRT3 in ERRα-silenced AGS cells treated with indomethacin. ACTIN was used as the loading control; representative blots are shown below the bar graphs (A-B).
(C and D) Cell viability was measured by MTT reduction assay in PGC1α-silenced (C) and ERRα-silenced (D) AGS cells treated with 0.5 mM indomethacin for 24 h.
(E and F) Immunoblots of PGC1α and ERRα (E) and pAMPKα and AMPKα (F) in SIRT3-silenced AGS cells treated with indomethacin (0.5 mM).
(G and H) Immunoblots of COX2, cleaved PARP, SIRT3 in COX2-silenced cells treated with indomethacin (0.5 mM) (G) and in SIRT3-silenced AGS cells treated with indomethacin (0.5 mM) (H).
(I) Immunoblot for β-catenin expression in AGS cells treated with siSIRT3, indomethacin or siSIRT3+indomethacin. ACTIN was used as the loading control; representative blots are shown below the bar graphs. Data are mean ± SD. ∗p < 0.05; ∗∗p < 0.01; ∗∗∗p < 0.001; ∗∗∗∗p < 0.0001 versus “Con siRNA” and #p < 0.05; ##p < 0.01; ####p < 0.0001 versus “Indo.” ns: non-significant. Unpaired Student’s t test with Welch correction was used to compare “siPGC1α” versus “Con siRNA” (A, C), “siERRα” versus “Con siRNA” (B, D), “siSIRT3” versus “Con siRNA” (E, F, H, I) and “siCOX2” versus “Con siRNA” (G) One-way ANOVA followed by Bonferroni’s post hoc test was used to compare “Indo” and “siPGC1α+Indo” versus “Con siRNA” (A, C), “Indo” and “siERRα+Indo” versus “Con siRNA” (B, D), “Indo” and “siSIRT3+Indo” versus “Con siRNA” (E, F, H, I) and “Indo” and “siCOX2+Indo” versus “Con siRNA” (G). The number of independently repeated experiments is 3 in every case. See also Figures S8 and S9.
Indomethacin-mediated SIRT3 inhibition during AGS cell death is independent of its COX2-modulating action
Being the rate-limiting factor controlling prostaglandin biosynthesis, COX2 expression contributes to cancer cell viability, metabolic integrity, and proliferation.16,17 To check whether SIRT3 inhibition-dependent anti-cancer action of indomethacin involves COX2 or operates independently, we specifically followed the effect of COX2 silencing on SIRT3 expression and cell viability. We observed that AGS cell cytoarchitecture, viability, and death are only slightly affected by COX2 silencing (Figures S9A and S9B). Moreover, COX2 silencing also did not affect SIRT3 expression as evident from the immunoblots (Figure 7G). On the contrary, indomethacin treatment upregulated COX2 expression along with increasing PARP cleavage and compromising cell viability. Interestingly, COX2 silencing did not produce much aggravating effect on indomethacin-mediated SIRT3 reduction and cell death. We also checked the effect of SIRT3 silencing on COX2 expression and found that siSIRT3 treatment did not affect COX2 expression. In fact, the COX2 modulating effect of indomethacin was also found unaffected in the SIRT3-silenced state (Figure 7H). Therefore, it was evident that SIRT3 inhibition by indomethacin operates exclusively of COX2 expression alteration by this NSAID. Further, we also checked β-catenin protein expression under “SIRT3-silenced” as well as “SIRT3-silenced + indomethacin-treated” conditions and found that β-catenin expression gets reduced by both SIRT3 silencing and indomethacin treatment. However, SIRT3 silencing did not aggravate indomethacin-mediated β-catenin reduction (Figure 7I).
SIRT3 reduction is a common cytotoxic action triggered by popular NSAIDs to induce cancer cell death
Finally, we checked whether SIRT3 downregulation was specific to indomethacin or general to popular NSAIDS like diclofenac, aspirin, and ibuprofen also exhibiting anti-neoplastic action as well as being used as medicines for treating inflammatory disorders. Data indicated that all these three NSAIDs significantly reduced SIRT3 expression (Figure 8A) concurrently with depleting cell viability and damaging the cytoarchitecture (Figures 8B and 8C). The effects were largely comparable to indomethacin, thereby suggesting SIRT3 depletion as a common event underlying the toxic effects of NSAIDs.
Figure 8.

Downregulation of SIRT3 is associated with the anti-cancer property of popular NSAIDs including diclofenac, aspirin, and ibuprofen
(A) Immunoblot of SIRT3 in AGS cells treated with Indo (0.5 mM), Ibu (2.5 mM), Diclo (0.5 mM), and Asp (8 mM) for 24 h. ACTIN was used as the loading control; representative blots below the bar graph.
(B) Cell viability measured by dehydrogenase activity (MTT reduction assay) in the control and NSAID-treated cells.
(C) Phase-contrast micrographs of AGS cells treated with indicated NSAIDs. At least 3 randomly selected fields were captured and representative micrographs are presented. Data (A,B), are mean ± SD ∗∗∗∗p < 0.0001 versus “control” calculated by one-way ANOVA followed by Bonferroni’s post hoc test. The number of independently repeated experiments is 3 in every case.
Discussion
The present work reports mitochondrial deacetylase SIRT3 as a direct target of indomethacin to induce COX-independent anti-proliferative effect leading to mitochondrial pathology and GC cell death. We provide evidence that indomethacin causes competitive inhibition of SIRT3 deacetylase activity along with severely downregulating both the gene as well as protein expressions of SIRT3 to induce a comprehensive blockage in SIRT3 signaling pathway. This SIRT3-inhibiting action of NSAIDs can be strategically used for designing novel and safer NSAID-based strategies which can bypass the COX-dependent side effects while still retaining the cytotoxic action against cancer cells.
GC is a highly aggressive malignancy with complex pathogenesis, molecular heterogeneity, and dearth of effective treatment options especially for advance-stage tumors and multiple metastases cases.18 Notably, GC is almost always diagnosed in the advanced stages thereby further worsening the prognosis. Precise knowledge about gastric tumor biology and risk factors is therefore crucial while strategizing treatment regimen.
Repurposing of already FDA-approved non-anti-cancer drugs for exploring their potent anti-neoplastic effects is coming to the limelight in order to fight increasing chemoresistance and resist aggressive tumors as well as cancer stem cells. Contextually, emerging reports on drug repurposing of NSAIDs in cancer have highlighted their anti-neoplastic potential in GCs.19,20,21 Although NSAIDs have side effects which are mostly experienced in long-term users, these age-old anti-inflammatory compounds are found to exhibit remarkable anti-cancer properties.22 Moreover, when compared with conventional anti-cancer compounds, NSAIDs appear less toxic and safer.23,24 COX-independent oncosuppressor effects of NSAIDs predominantly involve induction of severe mitochondrial damage.25 However, precise sub-mitochondrial targets of NSAIDs, specifically in the aggressive-phenotype GC cells, remain yet to be identified. Because cancer cell mitochondria undergo metabolic remodeling to enable survival of malignant cells in a hypoxic tumor microenvironment with high energy reequipments for rapid proliferation, metastasis, and immune evasion, therefore we zoomed into major mitochondrial proteins acting as metabolic gatekeepers and pivotal regulators of mitochondrial structural and functional integrity. Contextually, SIRT3 appeared as a common factor linking diverse metabolic pathways, mitochondrial antioxidant defense, and cellular bioenergetic integrity. Often referred to as the “guardian of mitochondria,” SIRT3 (via its deacetylase activity) regulates diverse mitochondrial proteins ranging in action from TCA cycle and mitochondrial biogenesis to mitochondrial dynamics.26 These effects of SIRT3 may also be largely attributed to its cofactor NAD+ which has been rightly addressed as a golden nucleotide sitting on a crown of thorns.27 By virtue of its interplay with NADH, NAD+ crucially regulates myriad cellular processes including fatty acid oxidation, energy metabolism, glycolysis, OXPHOS, and TCA cycle.28 NAD+ is also implicated in oxidative stress, immune activation, cell viability, regulation of DNA repair, cellular stress resistance, and apoptosis.27 Interestingly, these cellular processes are also regulated by SIRT3 in diverse diseases including cancer.28 SIRT3 also regulates gene expression through deacetylation-dependent regulation of transcriptional regulators like FOXO3 and LKB1. To this end, NSAIDs have been often observed to negatively regulate vital cellular processes thereby compromising cell viability and triggering cell death by affecting mitochondrial integrity and cellular redox homeostasis. Recently in a rodent model of gastropathy, indomethacin has been found to induce acute non-malignant gastric mucosal injury via inhibiting SIRT3.29 However, there are no studies, as of now, exploring the effect of NSAIDs on SIRT3 in GC. Therefore, we attempted for assessing a plausible direct association of indomethacin and SIRT3 in inflicting GC cell death. Because indomethacin is a typical NSAID with reversible negligible COX selectivity, we rationally used it in the present study to rule out COX1/COX2 bias. The mitotoxic effects of indomethacin on AGS cells were confirmed at the outset wherein severe bioenergetic crisis, mitochondrial depolarization, hyperfission, and consequent activation of intrinsic pathway of apoptosis were distinctly observed. Loss of mitochondrial integrity by indomethacin rationally paved the way to check the effect of this highly potent oncosuppressor NSAID on mitochondrial metabolic guardian, SIRT3. Notably, molecular simulation studies clearly revealed direct SIRT3-indomethacin interaction with thermodynamically favorable binding score along with conceivable binding-site overlap with NAD. This suggested that indomethacin plausibly exerts competitive inhibition of SIRT3 deacetylase activity. Subsequently, indomethacin was found to actually compete with NAD for stably binding with SIRT3 with minimal conformational distortion. Further, in depth structural analysis relied on molecular dynamics simulation followed by validation through ITC-based direct evaluation of SIRT3-indomethacin interaction. ITC enables to directly measure bimolecular interactions, without the need of any label/s in a single experiment. Whenever a binding event occurs, heat is either absorbed or released. This was measured by the sensitive micro-calorimeter during the gradual titration of indomethacin into the sample cell containing rhSIRT3. The amide carbonyl, indole, carboxylate, chlorobenzene, and methoxy moieties of indomethacin participate significantly during binding with SIRT3 wherein His248, Phe180, Phe294, Arg158, Glu177, Gly295, Phe157, Phe294, Ile 230, Thr320, Glu323, Ser 321, Arg345, and Val366 residues participate through different degrees of interactions in the form of hydrogen bonds, pi-stacking, salt bridges, water bridges, cation-pi interactions, and hydrophobic contacts. Biophysical studies were further succeeded by direct estimation of SIRT3 deacetylase activity to understand the impact of indomethacin-SIRT3 binding. Usage of recombinant protein as well as direct mitochondrial extract enabled the confirmation of a direct inhibitory action of indomethacin (and not any metabolic by-product) on SIRT3 enzymatic activity. Together, it proved that indomethacin is a potential SIRT3 inhibitor which can be capitalized in NSAID-based anti-cancer drug development against GC specifically targeting SIRT3.
Based on indomethacin-SIRT3 interaction and SIRT3 deacetylase inhibition data, we moved ahead to check whether indomethacin at all exerts any effect on SIRT3 expression. To this end, we primarily undertook deep transcriptomic sequencing of treated AGS cells for unbiased identification of any novel actionable sub-mitochondrial target. It is worth mentioning at this point that indomethacin is also used against human malignancies besides treating pain/inflammation.30,31 AGS cells provided the ease for mechanistic exploration and functional validation of the direct cytotoxic effects of indomethacin on a pure gastric carcinoma cell line, while bypassing plausible interfering metabolic effect/s as expected in vivo. A relatively low (half-maximal inhibitory concentration [IC50]) dose of indomethacin used in this study enabled to monitor the subtle subcellular events which might have been difficult to track at a higher toxic dose. Distinct separation of gene sets was noticed in the transcriptome data from control and indomethacin-treated cells. Pathway analysis and network clustering indicated toward concerted activation of gene expression programs pertaining to cell death, protein ubiquitination, reactive prooxidant metabolism, and overall downregulation of metabolic pathways concerning carbohydrate, amino acid, and fatty acid metabolism as well as mitochondrial central dogma and specifically OXPHOS.
Of the various highlighted DEGs, SIRT3 was found to be significantly downregulated thereby providing support to our speculation of plausible targeting of SIRT3 expression by NSAIDs in GC cells. Before delving into the intricate functional aspects of SIRT3 inhibition by indomethacin, we first compared basal SIRT3 expression between gastric normal and cancer cells to ascertain the prognostic relevance of SIRT3 in GC. A significantly low basal SIRT3 level in Hs738 cells, compared to AGS cells, supported the tumorigenic action of this protein in the present study as well as GC per se. In fact, this observation is also in concordance with the TCGA data which also indicate that both SIRT3 and SOD2 are highly expressed in GC. Kaplan-Meier survival curves also indicate that SIRT3- and OGG1-high-expressing groups/patients have a lower median OS. In addition, TCGA datasets also indicated that, although GC has a differential racial incidence, significantly high SIRT3 expression is common to GCs from different races like Caucasian, African American, and Asian. Thus, SIRT3 appears as an important mitochondrial target associated with poor prognosis in GC. Concerning the antioxidant defense of SIRT3, SOD2 and OGG1 implicated in diverse pathologies including cancer are the predominant deacetylation targets of SIRT3.32 In this context, indomethacin was found to target SIRT3 at multiple levels; blocking SIRT3 deacetylase activity, depleting SIRT3 gene and protein expressions, and increasing mitochondrial protein acetylation and specific acetylation of OGG1 and SOD2. Regarding the differences in the extent of indomethacin-induced SIRT3 reduction and cell death in cancer versus normal cells, a much higher concentration of indomethacin is required to exert these detrimental effects in the Hs738 normal cell line compared to AGS cells. Therefore, it appears that, although indomethacin-induced SIRT3 reduction is toxic even to normal cells, the damaging effects are realized at a much lower concentration in the cancer cells thereby further justifying its merit as a potent SIRT3-based anti-cancer compound worth of investment for SIRT3-based anti-neoplastic purposes. In regards to the mechanistic basis underlying SIRT3 reduction, indomethacin was found to downregulate SIRT3 transcriptional regulators ERRα and PGC1α to exert a comprehensive suppressive effect on SIRT3 gene expression. Further indomethacin also blocked the AMPK-PGC1α-SIRT3 signaling axis. Indomethacin treatment in AGS cells actually reduced total AMPK and phosphorylated AMPK levels concerted with ATP depletion and SIRT3 as well as PGC1α downregulation. This is in congruence with the studies which suggest that SIRT3 indirectly regulates PGC1α expression (via FOXO3A deacetylation) and AMPK activation,33 and AMPK-PGC1α signaling stimulates SIRT3 expression along with preserving mitochondrial structural and functional integrity.34 Further, it also justifies mitochondrial depletion triggered by indomethacin because PGC1α is a potent regulator of mitochondrial biogenesis. Loss of SIRT3 upon indomethacin treatment is therefore associated with elevated mitochondrial fission and clearance of damaged mitochondria with high superoxide burden. In fact, SIRT3 knockdown aggravated this effect. This is in corroboration with previous reports where loss of SIRT3 has been associated with mtDNA damage in diseases.35 In this context, we specifically found that intra-mitochondrial superoxide burden and 8-oxo-dG accumulation severely increased when indomethacin was applied to SIRT3-silenced cells thereby proving the direct detrimental effect of acetylated SOD2 and OGG1 as immediate effect of SIRT3 depletion. All these effects are translated into loss of AGS cell viability wherein depleted SIRT3 accounted for severe mitochondrial depolarization and consequent apoptosis. Further, indomethacin-induced depletion of ERRα and PGC1α also resulted in both SIRT3 downregulation and depression of cell viability, thereby clarifying the basis of SIRT3 depression by indomethacin at the gene level. Here, SIRT3 reduction has been found to be a major factor contributing to indomethacin-induced cancer cell death. However, COX modulation being one of the dominant effects of NSAIDs in mediating their biological/cytotoxic actions, we also checked whether SIRT3 downregulation-dependent AGS cell death involved COX pathway. Interestingly, no significant change in COX2 expression was found upon SIRT3 silencing. Moreover, it was also found that COX2 silencing did not affect indomethacin-induced SIRT3 downregulation or aggravated cell death. Apparently, it turns out that in the present model SIRT3 reduction and cancer cell death by indomethacin operate independent of COX modulation, although we cannot absolutely rule out the possibility that the parallelly acting COX modulation and SIRT3 reduction pathways triggered by indomethacin would exert any synergistic anti-neoplastic effect in the systemic context.
In regards to cancer, although SIRT3 is known to favor OXPHOS over glycolysis,26 tumor-specific roles of SIRT3 cannot be ignored owing to its elevated expression and glycolysis-enhancing effects which ensure cell proliferation.36 This implies a context-dependent oncogenic role of SIRT3 even in glycolysis-dependent tumors that are less addicted to OXPHOS. In fact, cancer cells dynamically adapt to changing environments by switching between glycolysis and OXPHOS to meet energy requirements for ensuring maximal survival within compromised tumor microenvironment.37,38,39 Ample evidence supports both tumor-suppressing and oncogenic role of SIRT3 in different malignancies.26 However, we clearly observed that SIRT3 downregulation significantly aggravated indomethacin-induced AGS cell death. We also found that SIRT3 silencing moderately affected cell viability owing to its importance in cellular integrity under basal conditions.36 Similar to SIRT3 silencing, ectopic SIRT3 overexpression might also prove risky for cancer cells owing to the fact that hyperactivated SIRT3 would deacetylate CypD leading to its dissociation from VDAC complex. Released CypD in turn would impede hexokinase II (HK2) binding to VDAC, thereby causing its dissociation from mitochondrial inner membrane. Mitochondrial membrane-bound HK2 exerts anti-neoplastic cytoprotective effect by decreasing mitochondrial BAX accumulation.40 In fact, HK2 has been found to resist indomethacin-induced cytochrome c release and caspase-3 activation.41 Further, SIRT3 overexpression might also affect the redox homeostasis in cancer cells by over-suppression of reactive prooxidants level (owing to its multidimensional antioxidant effects), which could be also detrimental. Therefore, we rationally avoided SIRT3 overexpression as a validation approach in this study because optimum SIRT3 level is quintessential for maintaining cancer cell integrity and extremely difficult to attain in ectopic overexpression system. Finally, it is imperative to consider the putative efficacy of indomethacin in blocking SIRT3, in vivo, which is actually necessary for eliciting the anti-tumor effect. Contextually, while the present study comprehensively emphasizes on the multidimensional mechanistic aspects of indomethacin-dependent blocking of SIRT3 signaling in the GC cells in vitro, recently it has been reported that mitochondrial extracts isolated from indomethacin-treated injured rat gastric mucosa exhibit highly reduced SIRT3 deacetylase activity along with significantly downregulated SIRT3 expression.29 Further, in vivo anti-tumor action of indomethacin has already been observed.5,42 In fact, indomethacin is also ventured in combinatorial anti-cancer strategies against human malignancies in clinical trials (ClinicalTrials.gov ID NCT02935205). Therefore, indomethacin-induced SIRT3 downregulation, in vivo, in tumors may also be logically expected. However, further in vivo studies to directly validate indomethacin-induced SIRT3 downregulation and inhibition specifically in the gastric tumors are advocated. In specific regards to the importance of SIRT3 inhibition as a potent effect of NSAIDs compared to their other anti-neoplastic actions, it is worth reiterating that, being the central regulator of mitochondrial metabolism, SIRT3 is crucial for cellular integrity and indomethacin strikes at this very base of it thereby triggering cancer cell death. An optimum SIRT3 level is essential for redox homeostasis and mitochondrial metabolic integrity of cancer cells. SIRT3 downregulation as well as direct inhibition of its deacetylase activity by indomethacin severely impacts cancer cell viability thereby proving its immense relevance as a potent anti-neoplastic effect.
Thus, we conclude that SIRT3 is a novel target of indomethacin in GC cells whose downregulation actually underlies its COX-independent anti-cancer effect. This knowledge holds immense translational relevance where SIRT3 silencing coupled with indomethacin treatment may be exploited as an effective anti-neoplastic strategy against drug-resistant tumors with poor prognosis.
Limitations of the study
-
•
The present study reports the effect of indomethacin on SIRT3 as validated exclusively in the AGS cells which is a human gastric adenocarcinoma cell line. Additional validation in other GC cell lines would further substantiate the effect in the context of GC per se.
-
•
The present study comprehensively reports mechanistic aspects of indomethacin-dependent inhibition of SIRT3 signaling in the GC cells. Further direct in vivo studies to validate indomethacin-induced SIRT3 downregulation and inhibition specifically in the gastric tumors would confirm the efficacy of indomethacin in blocking SIRT3 in vivo.
STAR★Methods
Key resources table
| REAGENT or RESOURCE | SOURCE | IDENTIFIER |
|---|---|---|
| Antibodies | ||
| SIRT3 | Cell Signaling Technology | Cat# 2627; RRID: AB_2188622 |
| OGG1 | Novus Biologicals | Cat# NB100-106; RRID: AB_10104097 |
| PGC1α | Abcam | Cat# Ab54481; RRID: AB_881987 |
| ERRα | Cell Signaling Technology | Cat# 13826; RRID: AB_2750873 |
| Acetylated lysine | Cell Signaling Technology | Cat# 9814; RRID: AB_10544700 |
| Acetylated OGG1 | Abcam | Cat# ab93670; RRID: AB_10562267 |
| Acetylated SOD2 | Abcam | Cat# Ab137037; RRID: AB_2784527 |
| Phospho-DRP1 (Ser637) | Cell Signaling Technology | Cat# 4867; RRID: AB_10622027 |
| pAMPKα | Abcam | Cat# ab133448; RRID: AB_2923300 |
| AMPK | Abcam | Cat# ab32047; RRID: AB_722764 |
| Parkin | Sigma-Aldrich | Cat# P6248; RRID: AB_477384 |
| PINK1 | Novus Biologicals | Cat# BC100-494; RRID: AB_10127658 |
| TOM20 | Santa Cruz Biotechnology | Cat# sc-11415; RRID: AB_2207533 |
| Cleaved Caspase 9 | Cell Signaling Technology | Cat# 9505; RRID: AB_2290727 |
| Bax | Santa Cruz Biotechnology | Cat# sc-7480; RRID: AB_626729 |
| Cytochrome C | Abcam | Cat# ab53056; RRID: AB_869315 |
| Bcl-xL | Cell Signaling Technology | Cat# 2764; RRID: AB_2228008 |
| Cleaved caspase 3 | Cell Signaling Technology | Cat# 9664; RRID: AB_2070042 |
| Cleaved PARP | Cell Signaling Technology | Cat# 5625; RRID: AB_10699459 |
| Anti-DNA/RNA Damage antibody [15A3] | Abcam | Cat# ab62623; RRID: AB_940049 |
| Actin | Cell Signaling Technology | Cat# 3700; RRID: AB_2242334 |
| OPA1 | Abcam | Cat# ab42364; RRID: AB_944549 |
| MFN1 | Abcam | Cat# ab104585; RRID: AB_10712602 |
| MFF | Abcam | Cat# ab81127; RRID: AB_1860496 |
| DRP1 | Abcam | Cat# ab184247; RRID: AB_2895215 |
| Phospho-DRP1 (Ser616) | Cell Signaling Technology | Cat# 4494; RRID: AB_11178659 |
| COX2 | Abcam | Cat# ab15191; RRID: AB_2085144 |
| β-catenin (H-102) | Santa Cruz Biotechnology | Cat# sc-7199; RRID: AB_634603 |
| Rabbit anti-mouse IgG | Sigma-Aldrich | Cat# A9044; RRID: AB_258431 |
| Goat anti-mouse IgG | Sigma-Aldrich | Cat# A0545; RRID: AB_257896 |
| Goat anti-Mouse IgG (H+L) Cross-Adsorbed Secondary Antibody, Alexa Fluor 647 | Thermo Fisher Scientific | Cat# A-21235; RRID: AB_2535804 |
| Goat anti-Rabbit IgG (H+L) Highly Cross-Adsorbed Secondary Antibody, Alexa Fluor™ 488 | Thermo Fisher Scientific | Cat# A-11034; RRID: AB_2576217 |
| Chemicals, peptides, and recombinant proteins | ||
| Indomethacin | Sigma-Aldrich | Cat# I7378 |
| Diclofenac | Sigma-Aldrich | Cat# D6899 |
| Ibuprofen | Sigma-Aldrich | Cat# I1892 |
| Aspirin | Sigma-Aldrich | Cat# A2093 |
| RNase ZAP | Sigma-Aldrich | Cat# 83930 |
| MTT | Sigma-Aldrich | Cat# CT01-5 |
| Nicotinamide | Sigma-Aldrich | Cat# 72340 |
| Trichostatin A, Ready Made Solution | Sigma-Aldrich | Cat#T1952 |
| DMSO | Thermo Fisher Scientific | Cat# 276855 |
| TRIzol | Thermo Fisher Scientific | Cat# 276855 |
| Nuclease-free water | Thermo Fisher Scientific | Cat# AM9937 |
| PBS | Thermo Fisher Scientific | Cat# 10010031 |
| Lipofectamine 2000 | Thermo Fisher Scientific | Cat# 11668019 |
| Halt™ Protease and Phosphatase Inhibitor Cocktail (100X) | Thermo Fisher Scientific | Cat# 78440 |
| Western BLoT Stripping Buffer | TaKaRa | Cat#T7135A |
| JC-1 Dye | Thermo Fisher Scientific | Cat# T3168 |
| MitoSOX™ mitochondrial superoxide indicator | Thermo Fisher Scientific | Cat# M36008 |
| MitoTracker™ Red CMXRos | Thermo Fisher Scientific | Cat# M7512 |
| Luminata forte western HRP substrate | Millipore | Cat# WBLUF0500 |
| Nutrient Mixture F-12 Ham, Kaighn's Modification | HiMedia Laboratories | Cat# AL106A |
| Dulbecco’s Modified Eagle Medium, High glucose | HiMedia Laboratories | Cat# AL066A |
| Opti-MEM™ Reduced Serum Medium | Gibco, Sigma-Aldrich | Cat# 31985070 |
| Recombinant Human Sirtuin 3 | R&D system | Cat# 7488-DA |
| Critical commercial assays | ||
| PureLink RNA Mini Kit | Thermo Fisher Scientific | Cat# 12183018A |
| RevertAid H Minus First Strand cDNA Synthesis kit | Thermo Fisher Scientific | Cat# 18091050 |
| ATP Determination Kit | Thermo Fisher Scientific | Cat#A22066 |
| Mitochondria Isolation Kit | BioChain | Cat# KC010100 |
| HT 8-oxo-dG ELISA Kit II | Trevigen | Cat# 4380 KC010100 |
| SIRT3 activity assay kit | Abcam | Cat# ab156067 |
| Superoxide Dismutase Activity Assay Kit | Abcam | Cat# ab65354 |
| Propidium Iodide Flow Cytometry Kit | Abcam | Cat# ab139418 |
| Deposited data | ||
| RNA-seq raw and analyzed data | This paper | GEO: GSE202140 |
| Experimental models: Cell lines | ||
| AGS | ATCC | Cat# CRL-1739 |
| Hs 738.St/Int | ATCC | Cat# CRL-7869 |
| Oligonucleotides | ||
| SIRT3 siRNA | Santa Cruz Biotechnology | Cat# sc-61555 |
| PGC1α siRNA | Santa Cruz Biotechnology | Cat# sc-38884 |
| ERRα siRNA | Santa Cruz Biotechnology | Cat# sc-44706 |
| COX2 siRNA | Santa Cruz Biotechnology | Cat# sc-29279 |
| Scrambled siRNA | Santa Cruz Biotechnology | Cat# Sc-37007 |
| Primers for mt-ND1, mt-ND6, mt-CO1, mt-ATP6, mt-CYT-B, SIRT3 and GAPDH, see Table S4 | Integrated DNA Technologies | N/A |
| Software and algorithms | ||
| ImageJ software | ImageJ | RRID: SCR_003070 |
| LAS X software | LAS X | RRID: SCR_013673 |
| GraphPad Prism-8 | GraphPad | RRID: SCR_002798 |
Resource availability
Lead contact
Further information and requests for resources should be sent to and fulfilled by the lead contact, Dr. Uday Bandyopadhyay (ubandyo_1964@yahoo.com and udayb@jcbose.ac.in).
Materials availability
This study did not generate new unique reagents.
Data and code availability
-
•
The data presented in this study are available in the article and supplemental information. Processed and raw RNA-seq data generated in this study are deposited in the Gene Expression Omnibus (GEO) with accession number GSE202140 available online at the GEO repository.
-
•
This paper does not report any original code.
-
•
Any additional information necessary to reanalyze the data given in this paper can be obtained from the lead contact upon request.
Experimental model and study participant details
Cell culture and indomethacin treatment
AGS cells (human gastric carcinoma cells, ATCC-CRL-1739) and Hs738.St/Int (human normal cell line of gastrointestinal origin, ATCC-CRL-7869) were procured from American Type Culture Collection (Manassas, USA). Cells were cultured as described earlier.43,44 Briefly, AGS cells were maintained in F-12 Ham-Kaighn’s modification medium whereas Hs738 cells were maintained in Dulbecco's Modified Eagle's Medium. The respective culture media were supplemented with 10% fetal bovine serum. The cells were kept at 37°C in 5% CO2 incubator. Trypsinization was employed for splitting the cells once every 3 days. For experiments, cells were plated at a density of 1X10⁶ and allowed to grow overnight after which fresh media was replenished for treatment. Cells were treated with increasing concentrations of NSAIDs to check the effect on cell viability by dehydrogenase activity assay. A sublethal dose of 0.5 mM (obtained from viability assay) for indomethacin has been used to treat cells for transcriptome analysis and protein expression profiling to capture the subtle effects on cellular metabolism. Indomethacin was dissolved in alkaline distilled water. Ibuprofen and diclofenac were dissolved in distilled water. Aspirin was dissolved in DMSO. The final concentration of DMSO was maintained at 0.1% during treatment of cells. Diclofenac (0.5 mM), ibuprofen (2.5 mM) and aspirin (8 mM) were used to treat cells for SIRT3 expression profiling and cell viability assays. In every case the experiments were repeated thrice.
Method details
Cell viability assay and phase contrast microscopy for detecting cytoarchitecture
Cellular dehydrogenase activity was measured for the evaluation of cell viability, based on 3-(4,5-dimethylthiazol-2-yl)-2,5- diphenyl tetrazolium bromide (MTT) reduction assay as mentioned earlier.44 In brief, 48 well culture plates were plated with cells were plated at equal density and allowed to grow till 60-70% confluency, followed by indomethacin treatment. After completion of the treatment, MTT (1 mg/mL) in PBS added to the cells for an incubation period of 3.5 hr under 37°C/5% CO2 and finally the purple formazan was solubilized in anhydrous DMSO. The optical density was spectrophotometrically measured at 570 nm. For live cell phase contrast imaging, cells after treatment were washed with pre-warmed PBS and viewed under inverted phase contrast microscope (Leica Microsystems). At least 5 independent fields were randomly captured and representative images have been provided. All experiments were repeated thrice.
Analysis of mitochondrial transmembrane potential (ΔΨm)
For ΔΨm analysis in AGS cells, 3x10⁶ cells were used for JC-1 staining followed by flow cytometry as mentioned earlier.45 In brief, after indomethacin treatment, the cells were washed in pre-warmed media (37°C) and incubated with JC-1 (5 μg/mL) diluted in cell culture media, for 15 min at 37°C/5% CO2 in darkness. After the incubation, the cells were detached by trypsinization and diluted in PBS to a density of 106 cells/mL and analysed in FACS-LSR Fortessa, BD, using FACS DIVA software under standard parameters. 104 cells were evaluated per set and experiments were repeated thrice.
Measurement of ATP content
ATP content from AGS cells was measured using an ATP determination kit (Invitrogen Corp., Carlsbad, CA, USA) as mentioned earlier following the manufacturer's instructions.45 In short, an equal number of cells (107 cells per experimental set) were lysed in chilled cell lysis buffer (supplemented with Triton X-100). The lysates were centrifuged and the clear supernatants were used. ATP content was measured in a luminometer (BioTek). The ATP content of each sample was normalized by their respective protein concentration. In every case the experiments were repeated thrice.
Immunoblot analysis
For immunoblot analysis, total protein was isolated from AGS cells by using pre-chilled mammalian cell lysis buffer (supplemented with protease and phosphatase inhibitors, Halt™ Protease and Phosphatase Inhibitor Cocktail (100X), Thermo). Mitochondria were isolated from AGS cells using a commercially available kit from Biochain. For the study of mitochondrial protein acetylation, isolated mitochondria were lysed in the cell lysis buffer supplemented with nicotinamide (50 mM) and trichostatin A (10 μM). Quantification of protein was performed by Lowry’s method and equal quantity of proteins were mixed in SDS loading buffer and resolved in 10% polyacrylamide-SDS gels. The resolved proteins were then transferred to a nitrocellulose membrane (0.22 μM) by electroblotting. 5% skimmed milk or 5% BSA solution were used to block the membrane and followed by incubation in primary antibodies (key resources table, STAR Methods) overnight. The blots were washed in TBS solution supplemented with 0.1% Tween 20 and subsequently incubated in HRP-conjμgated secondary antibody for 2 hr at room temperature. The blots were finally washed and immuno-reactive bands were developed in Bio-Rad Chemidoc system. Each blot was stripped with stripping buffer (Cat#T7135A, TAKARA) and re-probed for checking ACTIN and TOM20 used as the loading controls for total protein and mitochondrial protein respectively. Densitometric analyses were done using ImageJ software and data were represented as fold change relative to control. In every case the experiments were repeated thrice.
Cell cycle analysis
Flow cytometric technique was used to analyse the cell cycle as per standard procedure.44 Propidium Iodide Flow Cytometry Kit (Abcam, Cat# ab139418) was used for this assay. Briefly, AGS cells were grown in 6 well plate and after the treatment was over cells were harvested and fixed in chilled ethanol (70% v/v) with gentle vortexing and the cells were kept overnight at 4°C. Next day the fixed cells were washed in PBS and stained using Propidium Iodide Flow Cytometry Kit (Abcam, Cat# ab139418) suggested in the manufacturer’s protocol followed by flowcytometric screening. The analysis was done in BD LSR Fortessa using BD FACS Diva 6.2 software. 104 cells were evaluated per set and experiments were repeated thrice.
Molecular simulation to explore SIRT3-indomethacin interaction
Chemical structure of indomethacin has been obtained from PubChem (PubChem CID: 3715). 31 crystal structures (retrieved 1 Sept 2022) of Sirtuin 3 (UniProtKB: SIR3_HUMAN) were obtained from the protein data bank (PDB) or the PDB-REDO repositories.12 Based on the model qualities (according to the wwPDB validation report available at PDB website), 22 crystal structures with good geometries and electron density map fitting were selected for docking studies (Table S1). Molecular docking simulation was performed with AutoDock Vina.46 Any bound ligands and crystallographic water molecules were removed from the protein crystal structures. Any missing side chains of the protein were filled using PDB_Hydro.47 Alternate atom positions were removed. Polar hydrogens were added using AutoDockTools.48 AutoDock4 atom types were assigned. Ligand structures were prepared similarly. All the rotatable bonds in the ligands were set free. Binding dissociation constant, KD, was calculated from binding free energies using the equation ΔG = -RT ln Keq where Keq = 1/KD.
Molecular dynamics (MD) was run under OPLS (optimized potentials for liquid simulations) force field in SPC (simple point-charge) water environment using Desmond molecular dynamics software implemented in Schrodinger Maestro (Academic release 2020-4).49 MD simulations were performed on the free, NAD+-bound and indomethacin-bound SIRT3 under defined temperature and pressure for a certain length of time (300 K, 1 bar and 240 ns, respectively, in this study). In MD simulation, the atomic model of protein or the protein ligand complex is placed in an explicit water environment and the whole system is incubated at a defined temperature and pressure for a certain length of time. Temperature gives motions to the atoms and the molecules can move freely in water as per Brownian motions. Thus, it considers the effects of solvents and receptor flexibility on the ligand interactions. Any structural changes in the protein induced by the ligand binding can also be observed. Low energy and higher frequency bound conformations were chosen for the MD simulation. Structural changes in terms of root mean square deviations (RMSD), residue-wise fluctuations in terms of root mean square fluctuations (RMSF), secondary structural properties, time correlated interactions, and interaction energies were obtained from the simulation trajectories using Schrodinger Maestro (Academic Release 2020-4).
Isothermal calorimetry for SIRT3-indomethacin interaction
To identify the binding response of recombinant human SIRT3 (rhSIRT3) with indomethacin, isothermal calorimetry (ITC) and titration experiments were conducted using an Affinity-ITC (TA Instruments). Standard procedure, as mentioned earlier, was followed50 with minor modifications as required. The experiments were performed at 25°C, and all samples were thoroughly vacuum-degassed before loading. The protein (rhSIRT3) and indomethacin were present in the same buffer of 25 mM Tris-HCl and 50 mM NaCl of pH 7.5. In the sample cell, 0.1 μM indomethacin solution was loaded, and the syringe was filled with 1.0 μM of rhSIRT3 solution. Indomethacin solution was injected in volumes of 5 μL up to 25 injections with a stirring RPM of 75. This experiment allowed us to plot the heat rate (μJ/sec) with respect to time (sec).
Determination of SIRT3 deacetylase activity
SIRT3 fluorometric activity assay kit (Abcam, ab156067) was used to measure deacetylase activity of SIRT3 in absence/presence of indomethacin. The experiment was performed as per manufactures protocol. Briefly, in presence of increasing concentrations of indomethacin (0.1-0.5 mM) the activity of purified recombinant human SIRT3 (rhSIRT3) was assessed taking the kinetic measurement at 2 min intervals till 45 min in BioTek Synergy H1 Hybrid Multi-Mode Reader with excitation at 350 nm and emission at 450 nm. For measuring mitochondrial SIRT3 activity within cells, mitochondrial extract was incubated with 0.5 mM indomethacin and then fluorescence was measured. Each reaction was performed in duplicates as mentioned in the kit and the experiment was repeated thrice.
SIRT3 expression analysis in human samples
SIRT3 expression in stomach adenocarcinoma (STAD) patient and normal individual stomach samples were evaluated using UALCAN, HPA and KM plotter database analysis tools as mentioned previously.51 UALCAN (http://ualcan.path.uab.edu/) analysis was undertaken for mining SIRT3 expression data across TCGA normal and STAD primary tumors. Data were represented as transcripts per million. Differential SIRT3 expression was evaluated from multiple dimensions, viz. sample types (normal, n = 34 and primary tumor, n = 415), individual cancer stages (stage 1, n = 18; stage 2, n = 123; stage 3, n = 169 and stage 4, n = 41), histological subtypes (Adenocarcinoma NOS, n = 155; Adenocarcinoma Diffuse, n=69; Adenocarcinoma SignetRing, n = 12; Intestinal Adenocarcinoma NOS, n = 73; Intestinal Adenocarcinoma Tubular, n = 76; Intestinal Adenocarcinoma Mucinous, n = 20 and Intestinal Adenocarcinoma Papillary, n = 7) and patient’s race (Caucasian, n = 260; AfricanAmerican, n = 12 and Asian, n = 87). Statistical significance has been mentioned as inset in the respective boxplot data.
In situ SIRT3 protein expression between healthy stomach tissue and STAD tumor samples was evaluated in Human Protein Atlas (https://www.Proteinatlas.org/). SIRT3 expression was checked in the tissue and pathology modules of HPA by selecting stomach as the target organ. Representative images of a normal stomach section (patient id: 1650) and an intestinal type stomach cancer section (patient id: 2378) has been shown. Immunohistochemistry in these two sections were done using the antibody CAB037142. Glandular cells in the normal stomach and tumor cells in the STAD sections displayed medium and high staining respectively.
Prognostic relevance of SIRT3 in regards to GC survival was calculated using Kaplan-Meier Plotter Database Analysis (http://kmplot.com/analysis/).52 KM plotter for Gastric Cancer module was used to calculate overall survival (OS) probability associated with low and high SIRT3 expressions. Hazard ratio (HR) for 95% confidence interval and p < 0.05 have been considered statistically significant. The Affy id/Gene symbol for SIRT3 was 221913_at and the analysis was run on 875 patient samples data. Median survival values for low and high SIRT3 expression cohorts were shown in the survival plot in the figure as inset. For OS analysis of OGG1 low and high expression cohorts using, Kaplan-Meier Plotter, same parameters were followed with the OGG1 Affy ID/Gene symbol being 205760_s_at.
Next-generation sequencing based transcriptomics
Total RNA sequencing library preparation using TruSeq Stranded Total RNA Library preparation kit from Illumina. Briefly, total RNA was isolated from AGS cells using PureLink RNA Mini Kit (Thermo) following the manufacturer's guidelines. 107 cells per sample were used as the starting material. The quality and concentration of the isolated RNA samples were checked in Nanodrop 2000 (Thermo) and Agilent 2100 Bioanalyzer. Samples with RIN ≥ 7.0 were subsequently used for library preparation. An equal amount (200 ng) of RNA from each sample was first subjected to ribosomal RNA depletion using the Ribo-Zero Human/Mouse/Rat depletion module of the kit followed by purification and divalent cation-based fragmentation. The resulting fragments were purified and subjected to cDNA synthesis, A-tailing and dual index adapter ligation. The products were subsequently purified and PCR enriched. The resulting RNA libraries were checked in Agilent 2200 TapeStation (Agilent Technologies), quantified, normalized and subjected to equimolar pooling. The pooled libraries were finally loaded on a sequencing run flow cell (Illumina) and subjected to 100 bp paired-end massively parallel sequencing in Novaseq 6000 sequencer (Illumina). Resulting Bcl files were converted to Fastq files and the data were subjected to a quality check using FastQC v.0.11.7.53 This was followed by adapter trimming with Cutadapt v1.1654 using Illumina Universal Adapter. Hisat2 2.1.0.55 was used to align the trimmed reads with Rat Rno6 reference genome (for rat samples) and Homo sapiens (human) genome assembly GRCh38 (hg38 for AGS cells). Sorting of Bam files was performed with Samtools v1.1956 Next, gene count was performed with Feature Counts57 followed by differential analysis using DESeq2.58 Differentially expressed genes with ≥ or ≤ 1.5-fold expression change and p value ≤ 0.05 and FDR ≤ 0.05 were filtered. Finally, gene enrichment and pathway analysis were performed with IPA (Ingenuity Pathway Analysis) software. For rat gastric mucosal samples data were also filtered with ≥ or ≤ 1.2-fold expression change and p value and FDR cut off of ≤ 0.05 to include genes regulating mitochondrial metabolism and functions. Sequencing was performed in triplicate. The GEO accession number for transcriptomic data is GSE202140.
RNA isolation and real-time RT-PCR
TRIzol (Invitrogen, Carlsbad, CA) was used to isolate total RNA from AGS cells following the manufacturer's instructions. Isolated RNA was then and estimated using Maestrogen nano Spectrophotometer (Life Teb Gen co, Tehran-Iran). Obtained total RNA (2 μg) was reverse transcribed with oligo-dT18 primer using RevertAid H Minus first strand cDNA synthesis kit (Thermo) followed by rDNAse treatment. The resultant cDNAs were used for qPCR after proper dilution by using Primers (Table S4) obtained from Integrated DNA Technologies Inc. (San Diego, California, USA). Roche LightCycler 96 qPCR system was used for performing the qPCR by using SYBR green master mix (Roche) in following the as mentioned cycle conditions: initial denaturation temperature at 95°C/10 min followed by 40 cycles of denaturation at 95°C/15 sec, annealing (at indicated annealing temperatures, Table S4) for 30 sec and extension at 72°C/25 sec. Relative gene expression was calculated using 2-ΔΔCq method and the data represented as a fold relative to control. GAPDH was used as the internal control. In every case the experiments were repeated thrice.
Isolation of mitochondria
Mitochondria were using BioChain's mitochondria isolation kit following the manufacturer's procedures. In short, an equal amount of AGS cells (2x10⁸) from separate experimental sets were taken for mitochondria isolation. Gentle homogenization for each sample was performed in Dounce homogenizer on ice. Next the samples were centrifuged at 600 g for 10 min to remove the nuclei and cell debris. The supernatant was collected and again centrifuged at 12,000 g for 15 min to get the mitochondrial fraction. The mitochondrial pellets were washed thrice in mitochondria isolation buffer and resultant pellets (approximately 99% pure) were used for either respiratory chain complex and dehydrogenase assays or lysed for immunoblotting as required. In every case the experiments were repeated thrice.
Isolation of mitochondrial DNA and measurement of 8-oxo-dG by ELISA
DNA from the isolated mitochondrial pellets from AGS cells were extracted by the phenol-chloroform method. In short, the mitochondrial pellet was resuspended in 100 μL of Proteinase K-supplemented lysis buffer and incubated at 50°C for 3 hrs following which 200 μL of phenol-chloroform was added and mixed thoroughly. The contents were centrifuged at 10,000 g to separate the phases. The aqueous phase was collected and 200 μL of 7.5 M ammonium acetate and 500 μL of ethanol were added. The tubes were kept at -20°C for 2 hrs. The samples were next centrifuged at 10,000 g for 30 mins. The pellets were washed with 500 μL of 70% ethanol and finally, the DNA pellets were dissolved in 30 μL of TB buffer. The mtDNA was spectrophotometrically estimated. An equal amount of mtDNA from each experimental set was then taken for 8-oxo-dG measurement using ELISA using a commercially available HT 8-oxo-dG ELISA Kit II from Trevigen. In every case the experiments were repeated thrice.
Superoxide dismutase-2 (SOD2) activity assay
Commercially available superoxide dismutase (SOD) activity assay kit ab65354 (Abcam) was used to measure the mitochondrial superoxide dismutase (SOD) activity. Briefly, mitochondria were isolated from control and indomethacin-treated cells. The mitochondrial pellets were then lysed in ice cold 0.1M Tris/HCl, pH 7.4 containing 0.5% Triton X-100, 5mM β-ME, 0.1 mg/ml PMSF and the superoxide dismutase (SOD) activity from the mitochondrial fraction was measured following the manufacturer’s protocol. The data is presented as ratio to 100% which is the SOD activity of control mitochondrial fraction. The relative SOD activity was normalized by estimating the protein amount in their respective mitochondrial fraction. In every case the experiments were repeated thrice.
Small interfering RNA (siRNA) transfection
siRNA-based reverse transfection was undertaken for silencing the expressions of SIRT3, ERRα, PGC1α, COX1 and COX2 following standard protocol for transfection.44 Briefly, lyophilized siRNA duplexes were reconstituted in the nuclease-free resuspension buffer (10 μM Tris-HCl, 20 mM NaCl, 1 mM EDTA, pH 8.0) to a final concentration of 10 μM. Cells at a confluency of 50-60% were exposed to respective siRNAs or scrambled siRNA (control siRNA). 75 pmol of siRNA and Lipofectamine RNAiMAX (Thermo) were independently diluted in OptiMEM, tap-mixed, combined and finally added to the OptiMEM pre-acclimatized cells. Transfections with scrambled siRNAs (control siRNA) were performed each time. The cells were maintained in the transfection medium for 16-18 hr following which the media was replaced with complete growth media. The transfected cells were treated with 0.5 mM indomethacin for 24 hr. In every case the experiments were repeated thrice.
Confocal microscopy for mitochondrial structure analysis and immunocytochemistry
For live-cell confocal imaging to evaluate the mitochondrial structure, cells (after treatment) were washed with pre-warmed media and stained with MitoTracker Red CMX ROS (100 nM) for 20 minutes. Nuclei were stained with Hoechst 33342. After staining, the cells were washed in pre-warmed media and observed under 63X oil immersion lens of the Leica TCS-SP8 confocal microscope (Leica Microsystems, Wetzlar, Germany) provided with a thermo-regulated stage in 5% CO2 environment. Laser intensity was maintained below 2% to avoid laser-induced toxicity to the cells. Next the immunofluorescence staining of 8-oxo-dG was performed by following the protocol mentioned previously.45 In brief, indomethacin treated AGS cells (on glass coverslips) were fixed (2% paraformaldehyde), permeabilized in 0.15% Triton X-100, and blocked in 2% BSA solution in PBS.44 Primary antibodies against TOM20 (for detecting mitochondria, 1:250) and 8-oxo-dG (anti DNA/RNA damage antibody, 1:250) were diluted in the blocking solution and incubated overnight. The next day the cells were washed and incubated with secondary antibodies against TOM20 (Alexa fluor 647-conjμgated anti-rabbit IgG, 1:1000) and 8-oxo-dG (Alexa fluor 488-conjμgated anti-mouse IgG, 1:500). The coverslips were washed and mounted on glass slides for visualizing under 63X oil immersion lens. Digital zooming was performed as required and at least 100 cells were screened per experimental set. At least 5 independent fields were randomly captured and representative images have been provided. The images are representatives of independently replicated experiments. In every case the experiments were repeated thrice.
Measurement of mitochondrial superoxide
MitoSox staining was performed to measure the accumulation of mitochondrial reactive pro-oxidants in AGS cells. After treatment, the cells were washed with pre-warmed PBS and dissociated. Next, the cells were stained with MitoSox following the manufacturer's instructions. Cells were washed thrice with pre-warmed PBS and analyzed in FACS LSR Fortessa, BD. Data were analyzed in FACS DIVA software under standard parameters. 104 cells were evaluated per set and experiments were repeated thrice.
FITC-annexin V staining for cell death determination
Apoptosis in the AGS cells was determined by annexin V/propidium iodide (PI) dual staining as described elsewhere.44 Briefly, after treatment, the cells were dissociated. The cells were subsequently taken in annexin V binding buffer (Abcam) and stained with FITC-annexin V and PI (propidium iodide) following the manufacturer's protocol. Cells were subsequently analysed in FACS LSR Fortessa, BD. Data were analyzed in FACS DIVA software under standard parameters. 104 cells were evaluated per set and experiments were repeated thrice.
Quantification and statistical analysis
All experiments were repeated at least thrice. Data acquired from experiments were represented as mean ± standard deviation. When comparing two experimental groups, unpaired t-test (with Welch correction) was done to calculate the level of significance while one-way ANOVA followed by Bonferroni's Multiple-Comparison test was done for comparing more than two groups. For statistical significance a P value less than 0.05 (P<0.05) was considered. Statistical analysis of data was done using GraphPad Prism 8 and Microsoft Office Excel 2019 software.
Acknowledgments
The authors thankfully acknowledge DBT-National Genomics Core and Core Technologies Research Initiative (CoTeRI), National Institute of Biomedical Genomics, India, for helping with next-generation sequencing. The authors also thank Dr. Ankita Chatterjee, National Institute of Biomedical Genomics, India, for helping with TCGA data analysis.
This work was supported by Science and Engineering Research Board, Department of Science and Technology, Ministry of Science and Technology, Govt. of India, through the J.C. Bose National Fellowship (grant no: SB/S2/JCB-54/2014) to U.B. for performing this work. S.D. acknowledges the Department of Biotechnology, Govt. of India, for doctoral research fellowship.
Author contributions
S.D., S.B., S.M., and U.B. conceived the study. S.D., S.B., S.M., U.P., Z.G., and U.B. wrote the manuscript. S.D., S.M., and S.P. conducted majority of the experiments. S.D., S.B., S.M., and U.B. analyzed the data. U.P. and N.C.M. performed molecular docking and simulation studies. T.D. and Z.G. performed NGS data analysis. D.S. and S.D. performed ITC experiments. R.D., S.N., and C.B. assisted in experiments. U.B. obtained funding and performed overall supervision of the project.
Declaration of interests
The authors declare no competing interests.
Published: March 1, 2024
Footnotes
Supplemental information can be found online at https://doi.org/10.1016/j.isci.2024.109384.
Supplemental information
A. Differentially expressed (DE) genes with FC cutoff of 1.5 and p value ≤0.5.
B. Results of pathway enrichment analysis involving DE genes.
C. Functional annotation of the DE genes.
References
- 1.Sung H., Ferlay J., Siegel R.L., Laversanne M., Soerjomataram I., Jemal A., Bray F. Global Cancer Statistics 2020: GLOBOCAN Estimates of Incidence and Mortality Worldwide for 36 Cancers in 185 Countries. CA. Cancer J. Clin. 2021;71:209–249. doi: 10.3322/caac.21660. [DOI] [PubMed] [Google Scholar]
- 2.Li Y., Feng A., Zheng S., Chen C., Lyu J. Recent Estimates and Predictions of 5-Year Survival in Patients with Gastric Cancer: A Model-Based Period Analysis. Cancer Control. 2022;29 doi: 10.1177/10732748221099227. [DOI] [PMC free article] [PubMed] [Google Scholar]
- 3.Kumar V., Soni P., Garg M., Kamholz S., Chandra A.B. Emerging Therapies in the Management of Advanced-Stage Gastric Cancer. Front. Pharmacol. 2018;9:404. doi: 10.3389/fphar.2018.00404. [DOI] [PMC free article] [PubMed] [Google Scholar]
- 4.Guo Y.C., Chang C.M., Hsu W.L., Chiu S.J., Tsai Y.T., Chou Y.H., Hou M.F., Wang J.Y., Lee M.H., Tsai K.L., Chang W.C. Indomethacin inhibits cancer cell migration via attenuation of cellular calcium mobilization. Molecules. 2013;18:6584–6596. doi: 10.3390/molecules18066584. [DOI] [PMC free article] [PubMed] [Google Scholar]
- 5.Wang H.M., Zhang G.Y. Indomethacin suppresses growth of colon cancer via inhibition of angiogenesis in vivo. World J. Gastroenterol. 2005;11:340–343. doi: 10.3748/wjg.v11.i3.340. [DOI] [PMC free article] [PubMed] [Google Scholar]
- 6.Vallecillo-Hernández J., Barrachina M.D., Ortiz-Masiá D., Coll S., Esplugues J.V., Calatayud S., Hernández C. Indomethacin Disrupts Autophagic Flux by Inducing Lysosomal Dysfunction in Gastric Cancer Cells and Increases Their Sensitivity to Cytotoxic Drugs. Sci. Rep. 2018;8:3593. doi: 10.1038/s41598-018-21455-1. [DOI] [PMC free article] [PubMed] [Google Scholar]
- 7.Kassab S.E. In: Medicinal Chemistry. Vaško J.V.a.L., editor. IntechOpen; 2018. Indomethacin from Anti-Inflammatory to Anticancer Agent. [DOI] [Google Scholar]
- 8.Huang M., Myers C.R., Wang Y., You M. Mitochondria as a Novel Target for Cancer Chemoprevention: Emergence of Mitochondrial-targeting Agents. Cancer Prev. Res. 2021;14:285–306. doi: 10.1158/1940-6207.CAPR-20-0425. [DOI] [PMC free article] [PubMed] [Google Scholar]
- 9.Ansari A., Rahman M.S., Saha S.K., Saikot F.K., Deep A., Kim K.H. Function of the SIRT3 mitochondrial deacetylase in cellular physiology, cancer, and neurodegenerative disease. Aging Cell. 2017;16:4–16. doi: 10.1111/acel.12538. [DOI] [PMC free article] [PubMed] [Google Scholar]
- 10.Kumar S., Lombard D.B. Mitochondrial sirtuins and their relationships with metabolic disease and cancer. Antioxid. Redox Signal. 2015;22:1060–1077. doi: 10.1089/ars.2014.6213. [DOI] [PMC free article] [PubMed] [Google Scholar]
- 11.Carafa V., Rotili D., Forgione M., Cuomo F., Serretiello E., Hailu G.S., Jarho E., Lahtela-Kakkonen M., Mai A., Altucci L. Sirtuin functions and modulation: from chemistry to the clinic. Clin. Epigenet. 2016;8:61. doi: 10.1186/s13148-016-0224-3. [DOI] [PMC free article] [PubMed] [Google Scholar]
- 12.Joosten R.P., Womack T., Vriend G., Bricogne G. Re-refinement from deposited X-ray data can deliver improved models for most PDB entries. Acta Crystallogr. D Biol. Crystallogr. 2009;65:176–185. doi: 10.1107/S0907444908037591. [DOI] [PMC free article] [PubMed] [Google Scholar]
- 13.Bader G.D., Hogue C.W.V. An automated method for finding molecular complexes in large protein interaction networks. BMC Bioinf. 2003;4:2. doi: 10.1186/1471-2105-4-2. [DOI] [PMC free article] [PubMed] [Google Scholar]
- 14.Shannon P., Markiel A., Ozier O., Baliga N.S., Wang J.T., Ramage D., Amin N., Schwikowski B., Ideker T. Cytoscape: a software environment for integrated models of biomolecular interaction networks. Genome Res. 2003;13:2498–2504. doi: 10.1101/gr.1239303. [DOI] [PMC free article] [PubMed] [Google Scholar]
- 15.Wang Y., Li X., Zhao F. MCU-Dependent mROS Generation Regulates Cell Metabolism and Cell Death Modulated by the AMPK/PGC-1alpha/SIRT3 Signaling Pathway. Front. Med. 2021;8 doi: 10.3389/fmed.2021.674986. [DOI] [PMC free article] [PubMed] [Google Scholar]
- 16.Menter D.G., Schilsky R.L., DuBois R.N. Cyclooxygenase-2 and cancer treatment: understanding the risk should be worth the reward. Clin. Cancer Res. 2010;16:1384–1390. doi: 10.1158/1078-0432.CCR-09-0788. [DOI] [PMC free article] [PubMed] [Google Scholar]
- 17.Hashemi Goradel N., Najafi M., Salehi E., Farhood B., Mortezaee K. Cyclooxygenase-2 in cancer: A review. J. Cell. Physiol. 2019;234:5683–5699. doi: 10.1002/jcp.27411. [DOI] [PubMed] [Google Scholar]
- 18.Selim J.H., Shaheen S., Sheu W.C., Hsueh C.T. Targeted and novel therapy in advanced gastric cancer. Exp. Hematol. Oncol. 2019;8:25. doi: 10.1186/s40164-019-0149-6. [DOI] [PMC free article] [PubMed] [Google Scholar]
- 19.Brusselaers N., Lagergren J. Maintenance use of non-steroidal anti-inflammatory drugs and risk of gastrointestinal cancer in a nationwide population-based cohort study in Sweden. BMJ Open. 2018;8 doi: 10.1136/bmjopen-2018-021869. [DOI] [PMC free article] [PubMed] [Google Scholar]
- 20.Li L., Hu M., Wang T., Chen H., Xu L. Repositioning Aspirin to Treat Lung and Breast Cancers and Overcome Acquired Resistance to Targeted Therapy. Front. Oncol. 2019;9:1503. doi: 10.3389/fonc.2019.01503. [DOI] [PMC free article] [PubMed] [Google Scholar]
- 21.Kumar R. Repositioning of Non-Steroidal Anti Inflammatory Drug (NSAIDs) for Cancer Treatment: Promises and Challenges. J. Nanomed. Nanotechnol. 2016;7 doi: 10.4172/2157-7439.1000e140. [DOI] [Google Scholar]
- 22.Bindu S., Mazumder S., Bandyopadhyay U. Non-steroidal anti-inflammatory drugs (NSAIDs) and organ damage: A current perspective. Biochem. Pharmacol. 2020;180 doi: 10.1016/j.bcp.2020.114147. [DOI] [PMC free article] [PubMed] [Google Scholar]
- 23.Würth R., Thellung S., Bajetto A., Mazzanti M., Florio T., Barbieri F. Drug-repositioning opportunities for cancer therapy: novel molecular targets for known compounds. Drug Discov. Today. 2016;21:190–199. doi: 10.1016/j.drudis.2015.09.017. [DOI] [PubMed] [Google Scholar]
- 24.Sousa S.M., Xavier C.P.R., Vasconcelos M.H., Palmeira A. Repurposing some of the Well-known Non-steroid Anti-inflammatory Drugs (NSAIDs) for Cancer Treatment. Curr. Top. Med. Chem. 2023;23:1171–1195. doi: 10.2174/1568026623666230130150029. [DOI] [PubMed] [Google Scholar]
- 25.Brandolini L., Antonosante A., Giorgio C., Bagnasco M., d'Angelo M., Castelli V., Benedetti E., Cimini A., Allegretti M. NSAIDs-dependent adaption of the mitochondria-proteasome system in immortalized human cardiomyocytes. Sci. Rep. 2020;10 doi: 10.1038/s41598-020-75394-x. [DOI] [PMC free article] [PubMed] [Google Scholar]
- 26.Zhang J., Xiang H., Liu J., Chen Y., He R.R., Liu B. Mitochondrial Sirtuin 3: New emerging biological function and therapeutic target. Theranostics. 2020;10:8315–8342. doi: 10.7150/thno.45922. [DOI] [PMC free article] [PubMed] [Google Scholar]
- 27.Massudi H., Grant R., Guillemin G.J., Braidy N. NAD+ metabolism and oxidative stress: the golden nucleotide on a crown of thorns. Redox Rep. 2012;17:28–46. doi: 10.1179/1351000212Y.0000000001. [DOI] [PMC free article] [PubMed] [Google Scholar]
- 28.Navas L.E., Carnero A. NAD(+) metabolism, stemness, the immune response, and cancer. Signal Transduct. Target. Ther. 2021;6:2. doi: 10.1038/s41392-020-00354-w. [DOI] [PMC free article] [PubMed] [Google Scholar]
- 29.Debsharma S., Pramanik S., Bindu S., Mazumder S., Das T., Saha D., De R., Nag S., Banerjee C., Siddiqui A.A., et al. Honokiol, an inducer of Sirtuin 3, protects against NSAID-induced gastric mucosal mitochondrial pathology, apoptosis and inflammatory tissue injury. Br. J. Pharmacol. 2023;180:2317–2340. doi: 10.1111/bph.16070. [DOI] [PubMed] [Google Scholar]
- 30.Woo J.K., Kang J.H., Jang Y.S., Ro S., Cho J.M., Kim H.M., Lee S.J., Oh S.H. Evaluation of preventive and therapeutic activity of novel non-steroidal anti-inflammatory drug, CG100649, in colon cancer: Increased expression of TNF-related apoptosis-inducing ligand receptors enhance the apoptotic response to combination treatment with TRAIL. Oncol. Rep. 2015;33:1947–1955. doi: 10.3892/or.2015.3793. [DOI] [PubMed] [Google Scholar]
- 31.Lai S.W., Liao K.F. Aspirin use after diagnosis improves survival in older adults with colon cancer. J. Am. Geriatr. Soc. 2013;61:843–844. doi: 10.1111/jgs.12236. [DOI] [PubMed] [Google Scholar]
- 32.Torrens-Mas M., Oliver J., Roca P., Sastre-Serra J. SIRT3: Oncogene and Tumor Suppressor in Cancer. Cancers. 2017;9 doi: 10.3390/cancers9070090. [DOI] [PMC free article] [PubMed] [Google Scholar]
- 33.Li Y., Wang Q., Li J., Shi B., Liu Y., Wang P. SIRT3 affects mitochondrial metabolic reprogramming via the AMPK-PGC-1alpha axis in the development of benign prostatic hyperplasia. Prostate. 2021;81:1135–1148. doi: 10.1002/pros.24208. [DOI] [PubMed] [Google Scholar]
- 34.Yu L., Gong B., Duan W., Fan C., Zhang J., Li Z., Xue X., Xu Y., Meng D., Li B., et al. Melatonin ameliorates myocardial ischemia/reperfusion injury in type 1 diabetic rats by preserving mitochondrial function: role of AMPK-PGC-1alpha-SIRT3 signaling. Sci. Rep. 2017;7 doi: 10.1038/srep41337. [DOI] [PMC free article] [PubMed] [Google Scholar]
- 35.Pillai V.B., Bindu S., Sharp W., Fang Y.H., Kim G., Gupta M., Samant S., Gupta M.P. Sirt3 protects mitochondrial DNA damage and blocks the development of doxorubicin-induced cardiomyopathy in mice. Am. J. Physiol. Heart Circ. Physiol. 2016;310:H962–H972. doi: 10.1152/ajpheart.00832.2015. [DOI] [PMC free article] [PubMed] [Google Scholar]
- 36.Cui Y., Qin L., Wu J., Qu X., Hou C., Sun W., Li S., Vaughan A.T.M., Li J.J., Liu J. SIRT3 Enhances Glycolysis and Proliferation in SIRT3-Expressing Gastric Cancer Cells. PLoS One. 2015;10 doi: 10.1371/journal.pone.0129834. [DOI] [PMC free article] [PubMed] [Google Scholar]
- 37.Shiratori R., Furuichi K., Yamaguchi M., Miyazaki N., Aoki H., Chibana H., Ito K., Aoki S. Glycolytic suppression dramatically changes the intracellular metabolic profile of multiple cancer cell lines in a mitochondrial metabolism-dependent manner. Sci. Rep. 2019;9 doi: 10.1038/s41598-019-55296-3. [DOI] [PMC free article] [PubMed] [Google Scholar]
- 38.Läsche M., Emons G., Gründker C. Shedding New Light on Cancer Metabolism: A Metabolic Tightrope Between Life and Death. Front. Oncol. 2020;10:409. doi: 10.3389/fonc.2020.00409. [DOI] [PMC free article] [PubMed] [Google Scholar]
- 39.Jose C., Bellance N., Rossignol R. Choosing between glycolysis and oxidative phosphorylation: a tumor's dilemma? Biochim. Biophys. Acta. 2011;1807:552–561. doi: 10.1016/j.bbabio.2010.10.012. [DOI] [PubMed] [Google Scholar]
- 40.Schoeniger A., Wolf P., Edlich F. How Do Hexokinases Inhibit Receptor-Mediated Apoptosis? Biology. 2022;11 doi: 10.3390/biology11030412. [DOI] [PMC free article] [PubMed] [Google Scholar]
- 41.Pastorino J.G., Shulga N., Hoek J.B. Mitochondrial binding of hexokinase II inhibits Bax-induced cytochrome c release and apoptosis. J. Biol. Chem. 2002;277:7610–7618. doi: 10.1074/jbc.M109950200. [DOI] [PubMed] [Google Scholar]
- 42.Quidville V., Segond N., Pidoux E., Cohen R., Jullienne A., Lausson S. Tumor growth inhibition by indomethacin in a mouse model of human medullary thyroid cancer: implication of cyclooxygenases and 15-hydroxyprostaglandin dehydrogenase. Endocrinology. 2004;145:2561–2571. doi: 10.1210/en.2003-0915. [DOI] [PubMed] [Google Scholar]
- 43.Wang B., Chen H., Zhang Y. Involvement of GASL1 in postoperative distant recurrence of gastric adenocarcinoma after gastrectomy distal resection and the possible mechanism. J. Cell. Biochem. 2019;120:11454–11461. doi: 10.1002/jcb.28423. [DOI] [PubMed] [Google Scholar]
- 44.De R., Sarkar S., Mazumder S., Debsharma S., Siddiqui A.A., Saha S.J., Banerjee C., Nag S., Saha D., Pramanik S., Bandyopadhyay U. Macrophage migration inhibitory factor regulates mitochondrial dynamics and cell growth of human cancer cell lines through CD74-NF-kappaB signaling. J. Biol. Chem. 2018;293:19740–19760. doi: 10.1074/jbc.RA118.003935. [DOI] [PMC free article] [PubMed] [Google Scholar]
- 45.Mazumder S., De R., Debsharma S., Bindu S., Maity P., Sarkar S., Saha S.J., Siddiqui A.A., Banerjee C., Nag S., et al. Indomethacin impairs mitochondrial dynamics by activating the PKCzeta-p38-DRP1 pathway and inducing apoptosis in gastric cancer and normal mucosal cells. J. Biol. Chem. 2019;294:8238–8258. doi: 10.1074/jbc.RA118.004415. [DOI] [PMC free article] [PubMed] [Google Scholar]
- 46.Trott O., Olson A.J. AutoDock Vina: improving the speed and accuracy of docking with a new scoring function, efficient optimization, and multithreading. J. Comput. Chem. 2010;31:455–461. doi: 10.1002/jcc.21334. [DOI] [PMC free article] [PubMed] [Google Scholar]
- 47.Azuara C., Lindahl E., Koehl P., Orland H., Delarue M. PDB_Hydro: incorporating dipolar solvents with variable density in the Poisson-Boltzmann treatment of macromolecule electrostatics. Nucleic Acids Res. 2006;34:W38–W42. doi: 10.1093/nar/gkl072. [DOI] [PMC free article] [PubMed] [Google Scholar]
- 48.Morris G.M., Huey R., Lindstrom W., Sanner M.F., Belew R.K., Goodsell D.S., Olson A.J. AutoDock4 and AutoDockTools4: Automated docking with selective receptor flexibility. J. Comput. Chem. 2009;30:2785–2791. doi: 10.1002/jcc.21256. [DOI] [PMC free article] [PubMed] [Google Scholar]
- 49.Pal U., Pramanik S.K., Bhattacharya B., Banerji B., C Maiti N. Binding interaction of a gamma-aminobutyric acid derivative with serum albumin: an insight by fluorescence and molecular modeling analysis. SpringerPlus. 2016;5:1121. doi: 10.1186/s40064-016-2752-x. [DOI] [PMC free article] [PubMed] [Google Scholar]
- 50.Biswas S., Adhikari A., Mukherjee A., Das S., Adak S. Regulation of Leishmania major PAS domain-containing phosphoglycerate kinase by cofactor Mg(2+) ion at neutral pH. FEBS J. 2020;287:5183–5195. doi: 10.1111/febs.15305. [DOI] [PubMed] [Google Scholar]
- 51.Huo Q., Li Z., Cheng L., Yang F., Xie N. SIRT7 Is a Prognostic Biomarker Associated With Immune Infiltration in Luminal Breast Cancer. Front. Oncol. 2020;10:621. doi: 10.3389/fonc.2020.00621. [DOI] [PMC free article] [PubMed] [Google Scholar]
- 52.Szász A.M., Lánczky A., Nagy Á., Förster S., Hark K., Green J.E., Boussioutas A., Busuttil R., Szabó A., Győrffy B. Cross-validation of survival associated biomarkers in gastric cancer using transcriptomic data of 1,065 patients. Oncotarget. 2016;7:49322–49333. doi: 10.18632/oncotarget.10337. [DOI] [PMC free article] [PubMed] [Google Scholar]
- 53.Andrews S. FastQC: A Quality Control Tool for High Throughput Sequence Data. 2010. http://www.bioinformatics.babraham.ac.uk/projects/fastqc/
- 54.Martin M. Cutadapt Removes Adapter Sequences from High-Throughput Sequencing Reads. EMBnet. j. 2011;17:10–12. doi: 10.14806/ej.17.1.200. [DOI] [Google Scholar]
- 55.Pertea M., Kim D., Pertea G.M., Leek J.T., Salzberg S.L. Transcript-level expression analysis of RNA-seq experiments with HISAT, StringTie and Ballgown. Nat. Protoc. 2016;11:1650–1667. doi: 10.1038/nprot.2016.095. [DOI] [PMC free article] [PubMed] [Google Scholar]
- 56.Li H., Handsaker B., Wysoker A., Fennell T., Ruan J., Homer N., Marth G., Abecasis G., Durbin R., 1000 Genome Project Data Processing Subgroup The Sequence Alignment/Map format and SAMtools. Bioinformatics. 2009;25:2078–2079. doi: 10.1093/bioinformatics/btp352. [DOI] [PMC free article] [PubMed] [Google Scholar]
- 57.Liao Y., Smyth G.K., Shi W. featureCounts: an efficient general purpose program for assigning sequence reads to genomic features. Bioinformatics. 2014;30:923–930. doi: 10.1093/bioinformatics/btt656. [DOI] [PubMed] [Google Scholar]
- 58.Love M.I., Huber W., Anders S. Moderated estimation of fold change and dispersion for RNA-seq data with DESeq2. Genome Biol. 2014;15:550. doi: 10.1186/s13059-014-0550-8. [DOI] [PMC free article] [PubMed] [Google Scholar]
Associated Data
This section collects any data citations, data availability statements, or supplementary materials included in this article.
Supplementary Materials
A. Differentially expressed (DE) genes with FC cutoff of 1.5 and p value ≤0.5.
B. Results of pathway enrichment analysis involving DE genes.
C. Functional annotation of the DE genes.
Data Availability Statement
-
•
The data presented in this study are available in the article and supplemental information. Processed and raw RNA-seq data generated in this study are deposited in the Gene Expression Omnibus (GEO) with accession number GSE202140 available online at the GEO repository.
-
•
This paper does not report any original code.
-
•
Any additional information necessary to reanalyze the data given in this paper can be obtained from the lead contact upon request.