

Summary
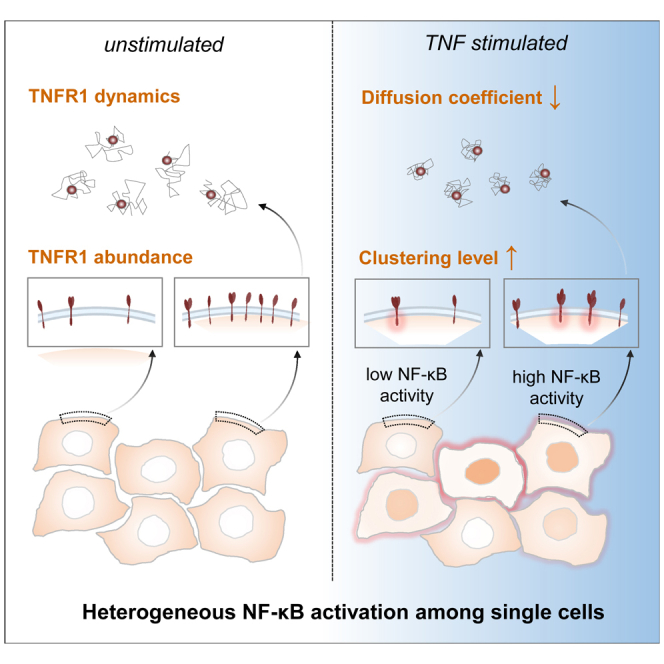
Nuclear factor kappa B (NF-κB) is a key regulator in immune signaling and is known to exhibit a digital activation pattern. Yet the molecular basis underlying the heterogeneity in NF-κB activation at single-cell level is not entirely understood. Here, we show that NF-κB activation in single cells is largely regulated by intrinsic differences at the receptor level. Using the genome editing and time-lapse imaging, we directly characterize endogenous TNFR1 dynamics and NF-κB activation from the same single cells. Total internal reflection fluorescence (TIRF) microscopy shows that endogenous TNFR1 forms pre-ligand clusters in the resting cells. Upon tumor necrosis factor (TNF) stimulation, the diffusion coefficient of membrane TNFR1 was significantly decreased and a substantial level of TNFR1 undergoes oligomerization to form trimers and hexamers. Moreover, multi-color cell imaging reveals that both digital and graded information processing regulate NF-κB activation across different TNFR1 expression levels. Our results indicate that single-cell NF-κB activation potential strongly correlates with its TNFR1 characteristics.
Subject areas: Biological sciences, Molecular biology, Cell biology
Graphical abstract
Highlights
-
•
Endogenous TNFR1 and NF-κB dynamics were recorded by live-cell imaging
-
•
The diffusion coefficient of TNFR1 decreases upon TNF-α simulation in live cells
-
•
Photobleaching analysis shows TNFR1 forms trimers and hexamers under TNF-α input
-
•
TNFR1 abundance level regulates heterogeneous NF-κB activation among single cells
Biological sciences; Molecular biology; Cell biology
Introduction
The immune system is a complex and robust network with an important yet specialized role in the detection and defense of infection.1 Immune cells must properly decode information from dynamic inputs to mediate responses upon receiving pathogenic and cytokine signals.2,3,4 During inflammation, macrophages secrete tumor necrosis factor-α (TNF-α) as an acute-phase protein, mediating the rapid activation of local immune responses.5 Specifically, TNF-α activates the TNFR1 pathway, modulating downstream gene expressions for inflammation, growth, survival, and apoptosis via a transcription factor nuclear factor kappa B (NF-κB), specifically p65 subunit of its heterodimer.6,7 NF-κB is a central regulator in immunity, consisting of an inherent negative feedback circuit with its inhibitor IκB and exhibiting cytoplasmic-to-nuclear oscillations under TNF-α stimulation.4 Previous single-cell studies revealed NF-κB respond to TNF-α stimulation in a digital fashion, where a higher fraction of activated cells are observed with increasing TNF-α concentrations.8,9 Moreover, it is known that dynamic properties of NF-κB activation transmit discriminated transcription programs via the altered timing, duration, and intensity of NF-κB nuclear translocation.3,8,10,11,12,13,14 Apart from the switch-like mechanism for NF-κB activation, growing evidence based on information theory indicates the channel capacity in the NF-κB system is more than one bit.15,16 That is, single cells exhibit varying levels of NF-κB activity with graded TNF-α inputs. However, the response specificity is severely limited by a remarkable cell-to-cell heterogeneity in NF-κB activation dynamics. What factors or mechanisms underlie the heterogeneous NF-κB activation upon receiving identical input is intriguing yet unclear,17 as studying such determinants cannot involve biochemical assays that tend to be destructive of the living cell.
Tumor necrosis factor receptor 1 (TNFR1) is a type 1 transmembrane receptor ubiquitously expressed in almost all cell types, containing an intracellular death domain and four extracellular cysteine-rich domains (CRDs).18,19,20,21,22,23 Upon ligand binding, TNF-α interacts with the CRD2 and CRD3, while the terminus extracellular domain CRD1 maintains the function of the pre-ligand assembly domain (PLAD).22 PLAD is important for TNFR1 dimerization.24 Indeed, biochemical and structural studies have suggested that TNFR1 can form pre-ligand dimer, and further undergo higher-order clustering upon ligand binding.25,26 Furthermore, recent studies based on the exogenously expressed fluorescent TNFR1 constructs and advanced microscopy revealed TNFR1 organizations in live cells.27,28 Using the stochastic optical reconstruction microscopy (STORM), Morton et al. showed that TNFR1 forms ligand-independent dimers in several cell types, and revealed the movement speed of TNFR1 is increased upon ligand binding.27 Likewise, Karathanasis et al. used the photoactivated localization microscopy (PALM) to quantify that TNFR1 formed 13% monomer, 64% trimer and 23% higher-order oligomer upon TNF-α stimulation.28 Together, these results imply that dynamic TNFR1 oligomerizations may modulate single-cell NF-κB activation. Note that despite these interesting studies, the observation of TNFR1 status under an endogenous level and the role of high-order TNFR1 clusters in mediating subsequent NF-κB activations from the same single cells remains to be established.
Dynamics of single-cell NF-κB activation has been characterized in several previous studies.2,4,11,14,29,30,31 and has indeed become a model system exemplifying how cell heterogeneity is regulated and can have beneficial effects at the population level.32 However, it is still unclear why individual cells exhibit variable NF-κB activation when receiving identical cytokine input at the first place. Growing evidence from the mathematical models suggests these variable responses may associate with abundances of proteins from downstream of TNFR1 to upstream of IKK in the NF-κB network.15,17,33 Since NF-κB signaling initiates from the cell membranes, the membrane receptor, TNFR1, is likely to be a major contributor with respect to NF-κB activation variability. Indeed, to understand cell signaling heterogeneity through the lens of membrane receptors, Yao et al. provided a good example on the study of calcium signaling;34 their study showed that a main contributor of cell-to-cell variability originates from differential receptor activity. Similarly, Komorowski et al. demonstrated the copy number variability of the receptor largely restricts the signaling capacity.35
To characterize the TNFR1 membrane organization and examine its correlation to the cell-to-cell variable NF-κB activation in single cells, we generated a double knock-in (KI) reporter cell line that expresses the TNFR1-mCherry and p65-mVenus at the endogenous level. We hypothesized that NF-κB activation may be modulated by differences at the receptor level.8,15,33 Live cell total internal reflection fluorescence (TIRF) imaging shows that in the absence of ligand stimulation, TNFR1 forms ligand-independent clusters including mostly monomers and some dimers and trimers. Upon TNF-α stimulation, importantly, TNFR1 undergoes oligomerization to form higher-order clusters ranging from trimers to hexamers. Meanwhile, multi-color time-lapse microscopy was used to analyze correlation between the TNFR1 abundance and NF-κB activation from the same cells. The results show a combined digital and graded pattern of NF-κB active states across different TNFR1 expression levels. The results show that cells expressing higher TNFR1 are more susceptible to undergo NF-κB nuclear translocation. Together, our study provides the direct evidence that TNFR1 is dynamic and forms both ligand-dependent and ligand-independent oligomers on the cell membranes. Functionally, the differential abundance and states of TNFR1 at individual cell level is a significant contributor for cell-to-cell variable NF-κB activation.
Results
Establishing Tnfr1-mCherry KI mouse embryonic fibroblasts (MEFs) via CRISPR/Cas9-mediated fluorescent protein tagging
To confirm that mCherry was correctly tagged on TNFR1 and verify its physiological status and functions, engineered cells were carefully examined by following methods (Figure 1A). First, each DNA sequence from single colonies was analyzed by PCR (Figure 1B). Electrophoresis signals detected at the size of ∼2,500 bp represent successful KI colonies, which were observed in 3 out of 50 colonies. These cells were classified as homozygous KI cell lines. Subsequently, TNFR1-mCherry was further characterized by immunoblotting of the parental and selected KI cells (Figure 1C). The anti-TNFR1 signal was found to be ∼55 kDa in parental cells and was shifted by ∼26 kDa in the Tnfr1-mCherry KI cells, indicating mCherry was successfully tagged in these cells. Additionally, membrane TNFR1-mCherry fluorescence was confirmed by using the TIRF microscopy (Figure 1D), which had been used previously to characterize TNFR1 membrane distributions in other cells.27,28,36,37 Meanwhile, we also tested the activity of the Tnfr1-mCherry KI cell by performing NF-κB activation assay using TNF-α stimulation and compared that with data collected using the parental cell. Figure S1B shows single-cell nucleus NF-κB trajectories upon TNF-α stimulation at two concentrations from both cell lines, which exhibit similar single-cell NF-κB activation patterns. Furthermore, at the population level, our analysis showed that the engineered Tnfr1-mCherry KI cells exhibited a slightly shifted dose-response curve in comparison to the parental one (Figure 1E), implying a slightly decreased TNF-α sensitivity in the engineered cells. Together, these results confirm that TNFR1-mCherry construct remained functional compared to the endogenous TNFR1 and that the double KI MEF cell can represent as a faithful reporting system for studying TNFR1 mediated NF-κB signaling activation.
Figure 1.

Generation of the double KI MEFs expressing endogenous Tnfr1-mCherry and mVenus-p65 via CRISPR mediated genome editing
(A) A schematic diagram of the KI plasmid design for CRISPR/cas9-mediated fluorescent tagging of Tnfr1-mCherry into MEF cells stably expressing mVenus-p65. Top row: the HDR donor vector containing mCherry, left (800 bp), and right (490 bp) homologous arms targeting to the Tnfr1 locus of M. musculus. Bottom: The mCherry KI site was next to the stop codon of Tnfr1 at exon 10.
(B) Genotyping of selected single cell colonies. The primers were designed to target the Tnfr1 sequence from exon 8 to UTR. The signal of colonies with successful mCherry integration was shown at 2,454 bp. All homozygous Tnfr1-mCherry KI colonies were confirmed by Sanger sequencing.
(C) The western blot analysis of cell lysates from the parental and Tnfr1-mCherry KI cells. GADPH was used as loading controls.
(D) Fluorescent images of endogenous TNFR1-mCherry and mVenus-p65 in the double KI MEFs. Scale bar, 10 μm.
(E) The fraction of NF-κB active cells across different concentrations of TNF-α stimulations. The dose-response curve is fitted by a Hill function with Hill coefficient n = 2.5 and K = 0.035 ng/mL. Data points represent means ± SEM (n = 3 independent experiments). See also Figure S1.
TIRF imaging reveals endogenous TNFR1 forming ligand-independent clusters on the cell membrane
We subsequently examined the membrane distribution of TNFR1 using the TIRF microscope to explore the degree of TNFR1 heterogeneity on the cell membranes. Interestingly, the images showed that TNFR1 was rather lowly expressed in these cells and distributed sporadically on the cell membrane (Figures 2A, 2B, and S2). This level of TNFR1 expression, which is estimated to be approximately on the low thousands per cell, agrees reasonably well with those reported in previous studies.33,38 Moreover, these results revealed that TNFR1 exhibited different sizes, presumably representing monomer and higher oligomer states in the absence of any ligand stimulation. Note that such results are consistent with previous studies demonstrating that TNFR1 can form ligand-independent clusters.27,28 We then tracked and quantified the spatiotemporal properties of TNFR1 using the time-lapse imaging (Figures 2C–2E). Tracking analysis showed both the merging and splitting events of TNFR1, implying constant association and dissociation of TNFR1 clusters happening at a timescale of seconds on the cell membrane in the absence of ligand stimulation. Together, our live cell imaging and tracking analysis indicate that TNFR1 can form high-order clusters dynamically even without any cytokine stimulation.
Figure 2.

The membrane distribution of TNFR1 in MEF cells at the resting state and upon TNR-α stimulation
(A) A TIRF image showing the TNFR1-mCherry distribution on the cell membrane. Scale bar, 10 μm.
(B) A magnified view of the ROI shown in (A). Scale bar, 5 μm.
(C) Zoom-in images of the ROI shown in (B). The time-lapse images reveal a merging event of TNFR1-mCherry. The magenta circles highlight the tracked TNFR1 and white arrows were used to mark TNFR1 that formed oligomer.
(D) Single particle analysis showing the temporal depth of trajectories (different colored circles and lines) for TNFR1-mCherry spots in 2 min. Gray circles represent eliminated objects due to insufficient tracking depth. Scale bar, 5 μm.
(E) Representative intensity trajectories showing the dynamics of TNFR1-mCherry spots on the cell membrane. The bolded lines show TNFR1 undergoing oligomerization. The data are representative of at least three cells.
(F) The intensity distribution of TNFR1-mCherry of the untreated (left) and TNF-α stimulated (right) cells. Each group contains ≥350 trajectories of TNFR1-mCherry spots. The data are representative of at least three cells. See also Figures S2 and S3.
(G) The mean diffusion coefficient of TNFR1-mCherry in the untreated and TNF-α stimulated cells from three independent experiments (∗p < 0.05 by one-way ANOVA). Each experiment contains >250 tracked TNFR1 spots.
TNFR1 undergoes higher-order clustering upon TNF-α stimulation
Using the exogenously expressed systems, previous studies showed that TNFR1 forms high-order clusters upon TNF-α treatment in cells.27,28 To examine how the clustering of endogenous TNFR1 changes upon TNF-α stimulation, we measured the TNFR1-mCherry signal via time-lapse TIRF imaging. Interestingly, TNFR1 was found to form higher-order clusters where increased fluorescence intensity was observed under 10 ng/mL TNF-α stimulation (Figures 2F and S3). Meanwhile, a recent TIRF analysis performed with a 30 s interval indicates the relative movement speeds of TNFR1 were increased upon TNF-α treatment.27 However, a higher spatiotemporal analysis on endogenous TNFR1 upon ligand stimulation is still lacking. To investigate if the endogenous TNFR1 diffusion is altered upon TNF-α binding, we analyzed the trajectories of TNFR1 acquired with a 500 ms interval before and after TNF-α stimulation. We tracked >250 TNFR1 for each cell upon stimulation of 10 ng/mL TNF-α.39 Intriguingly, our analysis showed that the diffusion coefficient of TNFR1 significantly decreased after 6 min treatment of TNF-α (Figure 2G), which is inconsistent with the aforementioned study. Considering the acquisition time used in this and previous study, we believe the diffusional trend reported herein shall be more appropriate in reflecting the diffusional behaviors of TNFR1. Furthermore, such reduced TNFR1 diffusion can be attributed to the fact that TNF-α/TNFR1 binding would lead to the formation of larger TNFR1 clusters and thus diffuse slower (Figures 2F and 2G).
We next compared the distribution of TNFR1 clustering level before and after TNF-α treatment. Before activation, the analysis revealed that there is a notable amount of ligand-independent TNFR1 dimers and trimers (Figure 2F). Interestingly, peaks with increased fluorescence intensity were observed in the TNF-α stimulated group, suggesting the formation of higher-order TNFR1 clusters upon TNF-α activation. By comparing the intensity distributions between the two groups, the substantially increased peaks can be assigned primarily as TNFR1 trimers and hexamers. To further support this observation, we also performed single-molecule imaging experiments to directly quantify the numbers of photobleaching steps as a proxy to determine the stoichiometric changes of membrane TNFR1 during TNF-α stimulation (Figure 3A). Using TIRF microscopy to image fixed cells, our photobleaching step analysis revealed there is a substantial TNFR1 dimer and trimer populations (∼40% and ∼7%) at the basal level. More importantly, the results also showed a clearly increasing trend toward the formation of higher-order TNFR clusters upon ligand stimulation (Figures 3B and 3C). The most noticeable change is the appearance of “TNFR1 trimers” (from 6.8% to 38.6%), and the size of clusters continues to grow for at least 10 min. Figure 3C shows the representative TNFR1 clusters exhibiting multi-step photobleaching events. Overall, we provide here live cell imaging-based evidence revealing the dynamic properties of endogenous TNFR1 at cell membranes. Our result suggested that TNFR1 was expressed at approximately a few thousands in the MEF cells, and they can form dynamical ligand-independent clusters at the basal level.
Figure 3.

TNFR1 forms higher-order clusters upon TNF-α stimulation in MEF cells
(A) Representative epi-fluorescence and TIRF images of the untreated and TNF-α stimulated cells showing the distribution of mVenus-p65 and TNFR1-mCherry in the fixed MEF cell. Scale bar is 10 μm in the top and middle panel, and 2 μm in the bottom panel.
(B) Photobleaching step analysis showing the distribution of TNFR1-mCherry clusters in the untreated and TNF-α stimulated (5 and 10 min) cells from three independent experiments.
(C) Representative intensity traces and images of TNFR1-mCherry exhibiting 1, 2, 3, and 6 photobleaching step events.
We further discussed that, at the functional level, whether membrane TNFR1 intensity or its high-order clustering propensity may be associated with downstream NF-κB activation upon TNF-α stimulation (Figure S4). By studying the correlation among TNFR1 intensity, TNFR1 oligomerization state and corresponding NF-κB activation, our analysis showed that there is a weak correlation (R = 0.38) regarding the TNFR1 intensity (based on nuclear p65 intensity) and subsequent NF-κB activation. In contrast, there is substantially lower correlation (R = 0.17) between TNFR1 oligomerization and nuclear p65 intensity. These results suggest that TNFR1 intensity may serve as a more ideal quantifiable marker of NF-κB activation under this experimental setup (Figure S4C). More generally, we establish herein an experimental setting for investigating the effect of the receptor and its influence on subsequent signaling activation.
A combination of digital and graded patterns in NF-κB activity across differential TNFR1 abundance levels
After establishing the spatial organization of endogenous TNFR1 on cell membranes and characterizing their dynamic features at both the resting and stimulated states, we sought to examine whether and how TNFR1 properties may mediate NF-κB activation at an individual cell level. Previous studies have established that upon cytokine stimulation, the activation of NF-κB exhibits a digital pattern.8 The percentage of NF-κB activated cells increases as a function of increasing TNF-α concentrations while the inactive cell population exists in all conditions but was observed more at lower TNF-α concentration. The results imply that individual cells exhibit high variability with respect to NF-κB activation.
Despite dynamics of NF-κB signaling activity have been studied quite extensively,2,4,11,14,29,30,31 what may be the possible source contributing to heterogeneous single-cell NF-κB activation upon receiving identical input has remained largely unclear.15,17,33 Since binding of TNF-α to TNFR1 initiates the NF-κB signaling, we hypothesized that TNFR1 can modulate the NF-κB activation variability (Figure 4A). The engineered, double KI MEF cells enable us to perform time-lapse imaging to measure both the TNFR1 signal at the membrane as well as subsequent NF-κB activation. This allows us to correlate TNFR1 characteristics to the downstream NF-κB activation in the same cells (Figure S5).
Figure 4.

NF-κB activation exhibits a high level of cellular heterogeneity upon TNF-α stimulations
(A) An illustration showing how TNFR1 may be one of molecular contributors for the heterogeneous NF-κB activity at single-cell level when receiving identical cytokine input.
(B) Time-lapse images showing the nuclear translocation of mVenus-p65 upon TNF-α stimulation in MEF cells at 2 different concentrations. Scale bar, 20 μm.
(C) Trajectories of single-cell nuclear NF-κB intensity at 2 TNF-α concentrations.
At the resting state, it is found the expression of nuclear NF-κB and TNFR1 is relatively narrow among individual cells (Figure S6). We then treated cells with 0.03 ng/mL TNF-α, which would lead ∼50% of the cell population to undergo NF-κB activation and allow us to observe cells with highly variable NF-κB activities (Figure 1E). The results showed that upon TNF-α stimulation, cells exhibited a dispersed distribution and variable NF-κB activities (Figures 4B and S6C). Previous studies on the TNF-α-to-NF-κB system had showed that cell-to-cell variability in cellular responses is largely raising from the extrinsic noise, especially the copy number variations in upstream of NF-κB signaling,40,41 implying that the abundance of TNF-α receptor is crucial in the information processing in discriminating NF-κB activation. Notably, time-lapse images further showed that higher NF-κB activity was correlated with higher TNFR1 expression at the individual cell level (Figure 5A). We next estimated the relation between nuclear NF-κB and membrane TNFR1 by the Pearson correlation coefficient (Figure 5B).42 The results showed a positive correlation (slope = 0.78; r = 0.53) between the membrane TNFR1 and nuclear NF-κB intensity. Furthermore, cells stained with a membrane dye, CellMask, were used as a control group since their membrane signals should be independent of nucleus NF-κB intensities upon TNF-α stimulation. Indeed, the analysis demonstrated a low level of correlation and weak association between CellMask and NF-κB intensities (slope = 0.31; r = 0.33; Figure S6B).
Figure 5.

Quantitative analysis reveals the combination of digital and graded patterns in single-cell NF-κB activation among different TNFR1 abundances
(A) Multi-color time-lapse images of the nucleus, NF-κB and TNFR1 in MEF cells upon receiving the TNF-α input. The Hoechst dye was used as a nucleus marker. Scale bar: 20 μm for nucleus and mVenus-p65 images and 10 μm for the TNFR1-mCherry channel.
(B) A plot showing the single-cell nuclear NF-κB intensity as a function of TNFR1 abundances measured in MEF cells upon 0.03 ng/mL TNF-α stimulation. NF-κB inactive and activated cells were marked in gray triangle and orange circle respectively. The percentage of NF-κB activated cells were shown on the top. Cells were binned into three populations based on their TNFR1 abundances. R represents the Pearson correlation coefficient.
(C) The violin plot showing the fold-change (FC) of nuclear NF-κB intensity across the graded TNFR1 abundances in single cells (∗p < 0.05 and ∗∗∗p < 0.001 by one-way ANOVA) from three independent experiments. The black line represents median while dash line represents quartile.
(D) Data points from (B) were separated by the FC of nuclear NF-κB intensity. Cells exhibiting FC < 1.3 were assumed to be inactive while those with FC > 1.8 were highly active cells. See also Figure S6.
To examine if the TNFR1 abundance plays a crucial role in heterogeneous NF-κB activation among cells, we also grouped each cell into the NF-κB-active and NF-κB-inactive subpopulations (Figure S6D). NF-κB-inactive cells that did not respond to TNF-α stimulation were found to exhibit a wide range of TNFR1 expression. We next analyzed data by binning the cells into three intensity groups: low (0–6k), medium (6k–12k), and high (12k–18k), which represents cells expressing low, medium and high levels of TNFR1, respectively. To uncover the relation between NF-κB active cell threshold and their TNFR1 abundance, we calculated the frequency of activated cells among three graded TNFR1 abundances (Figure 5B). The results showed that 44% of cells respond to cytokine stimulation in the low TNFR1 group while 59% and 67% of active cells were found in the medium and high TNFR1 population respectively. Additionally, we determined the amplitude of NF-κB activity via the fluorescent fold-change (FC) among three graded TNFR1 abundances after 30 min TNF-α stimulation. The data showed a lower level of nuclear NF-κB signal in the low TNFR1 expressing group when compared to cells expressing higher TNFR1, supporting the analogous property of TNFR1-NF-κB signaling (Figure 5C).
To understand the dependency of TNFR1 in NF-κB signaling heterogeneity among NF-κB-active and refractory cells, we further separated cell populations into three groups based on their NF-κB FC upon stimulation: NF-κB inactivated (FC < 1.3), activated (1.3 < FC < 1.8) and highly activated (FC > 1.8) (Figure 5D).43 For both NF-κB activated and highly activated cells, the analysis showed their nuclear NF-κB activity was substantially correlated with TNFR1 abundance, which exhibits positive slopes of 0.79 and 0.81 and correlation coefficients of 0.59 and 0.56, respectively. In contrast, the NF-κB inactivated population only exhibited a weak correlation with a slope of 0.35 and correlation coefficient of 0.32. These results indicate that TNFR1 abundance regulates NF-κB activation potential. Taken together, our data demonstrates that both digital and graded information processing govern NF-κB signaling across different TNFR1 expression levels (Figures 1E and 5B‒5D).38 That is, our study uniquely showed that the expression level of TNFR1 in each cell determines the cellular threshold for NF-κB activation upon receiving the same level of TNF-α in a digital fashion, and this in turn leads to variable NF-κB activation (Figure 5B). Meanwhile, TNFR1 also altered the strength of NF-κB activity in a graded fashion among activated cells (Figures 5C and 5D). These results remark the importance of TNFR1 abundance in mediating NF-κB signaling.
Discussion
The molecular basis for heterogeneous cellular responses has often been linked to the genetic differences, stochastic fluctuations in signaling reactions (intrinsic noise), and differences in cell states in a variety of biological systems.41,44,45 For the immune NF-κB transduction, different signaling dynamics in single-cell responses have been attributed to modulations at various network modules, such as a dual-delayed negative feedback motif composed of IκBα and IκBε,32 differential patterns of IKK activation,46 and a multipoint negative feedback mechanisms mediated by A20 and IκBα.31 Mathematical modeling also suggested activation of TNFR1 and gene expression of A20 and IκB are possible sources of NF-κB variability.33 In spite of these understandings, direct characterizations demonstrating molecular underpinnings that lead to the heterogeneous, digital single-cell NF-κB activation remain elusive. In this study, we successfully generated a double KI fluorescent reporter MEF cell by using genome editing, which enabled us to simultaneously visualize TNFR1 and NF-κB at the endogenous level by the multi-color live cell imaging. We first characterized the membrane organization of endogenous TNFR1 via time-lapse TIRF imaging in MEF cells since TNFR1 is the first molecule that initiates the NF-κB activation. The results showed that in the resting cells, in addition to TNFR1 monomers, there is already a noticeable level of TNFR1 dimers and trimers on the cell membrane (Figure 2G). Intriguingly, a high percentage of TNFR1 undergo clustering to form higher-order clusters ranging from trimers to hexamers within a few minutes upon TNF-α stimulation. Tracking experiment further enabled us to track TNFR1 movements in real time.27,28,36,37 The result showed that the diffusion coefficient of membrane TNFR1 significantly decreased upon TNF-α stimulation, supporting the notion that larger TNFR1 clusters are formed upon signaling activation. We inferred that high-order TNFR1 clustering might be the hot spot for locally strong signaling transduction, which serves as a quantifiable marker for downstream NF-κB activation.
We next performed multi-color imaging to simultaneously measure both TNFR1 and NF-κB activities from the same cells, our results showed that a combination of digital and graded patterns are involved in the NF-κB activation across differential levels of TNFR1 abundance. This suggests that TNFR1 abundance determines not only the active or refractory states of NF-κB in a digital fashion but also the strength of NF-κB signaling activation in graded patterns among cells under the same cytokine stimulation. This is noteworthy, because studying NF-κB responses to stimulation of another receptor, TLR4, suggested that differences in the lifetime of a signaling adapter, TRIF, is the primary determinant of cell-to-cell heterogeneity, not the TLR4 expression level.47
Although cells employ a negative feedback motif in NF-κB system to efficiently reduce the noise during signaling activation and narrowing the distribution of cellular responses among individual cells,48 we suggest that the extrinsic noise from differential TNFR1 abundances plays an indispensable role in governing heterogeneous NF-κB activation in single cells. The fact we observed a significant correlation between TNFR1 abundance and NF-κB activation suggests that intrinsic noise due to the stochasticity of molecular interactions within the signaling network is somehow buffered and insufficient to compromise the signaling fidelity. In other words, although cell signaling network is highly complex, fundamental features of molecular interactions remain and can serve a meaningful marker to predict the signaling outcomes. In the case of TNFR1-to-NF-κB module, the amount of TNFR1 is a quantifiable marker for NF-κB activation. Taken together, this study provides a direct characterization to quantify the endogenous TNFR1-to-NF-κB signaling dynamics at the single-cell level, and our result showed that cytokine receptor plays a central role in modulating the digital NF-κB signaling through its expression level and clustering state.
Limitations of the study
Firstly, since this study aims to visualize the endogenous TNFR1 dynamics by using CRISPR/Cas9-mediated mCherry tagging, it is expected that we shall observe almost all TNFR1 (via tagged mCherry) based on analyses shown in the manuscript. Yet we cannot rule out the possibility that there exists a small fraction of untagged TNFR1 which might also cluster with labeled ones. Moreover, although we have established herein a positive correlation between TNFR1 abundance and downstream NF-κB activity by the CRISPR/Cas9-edited cells and quantitative image analysis, our current system cannot provide active control to change the expression or clustering status of TNFR1 to address more directly the causality between TNFR1 levels and nuclear p65 intensity. To this end, TNFR1 overexpressed or low-expressed clones may be used. For tuning the clustering status of TNFR1, recently discovered TNFR1 clustering inhibitor Zafirlukast49,50 or TNFR1 clustering inducer hIgG2 mAb51 may also be valuable resource to use for future study. Lastly, the current downstream signaling activation readout has been based on the nuclear translation and fold-change analysis of NF-κB; a more direct readout can be assessed by directly profiling genes known to be regulated by NF-κB upon stimulation. Future experiments are essential to answer these issues.
STAR★Methods
Key resources table
| REAGENT or RESOURCE | SOURCE | IDENTIFIER |
|---|---|---|
| Antibodies | ||
| Anti-TNFR1 | R&D Systems | cat. #AF-425-PB; RRID: AB_354489 |
| Anti-GADPH | Merck | cat. #MAB374; RRID: AB_2107445 |
| Donkey anti-goat IgG-HRP | Santa Cruz Biotechnology | cat. #sc-2020; RRID: AB_631728 |
| Goat anti-Mouse IgG-HRP | Thermo Fisher Scientific | cat. #31430; RRID: AB_2434368 |
| Bacterialand virusstrains | ||
| Stellar™ Competent Cells | Takara Bio | cat. #636763 |
| Chemicals, peptides, and recombinant proteins | ||
| Recombinant mouse TNF-α | Gibco | cat. #PHC313 |
| RS-1 | Sigma-Aldrich | cat. #R9782 |
| poly-L-Lysine | Sigma-Aldrich | cat. #P8920 |
| Hoechst 33342 | Fisher Scientific | cat. #11534886 |
| CellMask Deep Red | Thermo Fisher Scientific | cat. #C10046 |
| Critical commercial assays | ||
| In-Fusion® HD Cloning Kit | Takara Bio | cat. #639650 |
| Xfect Polymer | Takara Bio | cat. #631317 |
| Experimental models: cell lines | ||
| MEF, mVenus-p65 KI | Alexander Hoffmann, UCLA | NA |
| MEF, mVenus-p65 & TNFR1-mCherry KI | This paper | NA |
| Oligonucleotides | ||
| sgRNA-Tnfr1: GGGTGTGGCTTTATCGCGGG | This paper | NA |
| Recombinant DNA | ||
| pAll-Cas9.Puro | RNAi core facility in Academia Sinica, TW | NA |
| pAll-Cas9.Ppuro (sgRNA-Tnfr1) | This paper | NA |
| pUC19 vector (provided in In-Fusion® HD Cloning Kit) | Takara Bio | cat. #3219 |
| Tnfr1-mCherry-HDR donor | This paper | NA |
| Software and algorithms | ||
| MatLab R2019a | TheMathWorks | NA |
| Origin2021 | OriginLab | NA |
| Cell tracking (MatLab script) | Son et al.(Son et al., 2021)31 | NA |
| Fiji | ImageJ | https://imagej.net/ |
| StarDist | Schmidt et al.(Schmidt et al., 2018)52 | https://github.com/stardist/stardist |
| TrackMate | Tinevez et al.(Tinevez et al., 2017)53 | https://github.com/trackmate-sc/TrackMate |
Resource availability
Lead contact
All source data generated and analyzed during this study are included in this article (and its supplemental information and Supplementary Data) or are available from the Lead contact, Hsiung-Lin Tu (hltu@gate.sinica.edu.tw).
Materials availability
Plasmids generated in this study are available from the lead contact. This study did not generate new unique reagents.
Data and code availability
-
•
All data reported in this study will be shared by the lead contact upon request.
-
•
This study does not report original code.
-
•
Any additional information required to reanalyze the data reported in this paper is available from the lead contact upon request.
Experimental model and study participant details
Cell culture
The mVenus-p65 endogenously-tagged mouse embryonic fibroblast (MEF) cell line13 was cultured in the Dulbecco's modified eagle medium (DMEM) (11965092, Thermo Fisher Scientific) supplemented with 10% fetal bovine serum (FBS) (Thermo Fisher Scientific), 1% GlutaMAX (Thermo Fisher Scientific), and 1× penicillin-streptomycin (Thermo Fisher Scientific) in T25 flask at 37°C and 5% CO2.
Cells were harvested using Trypsin-EDTA (Thermo Fisher Scientific) following the standard protocol and split ratios for subculture was kept from 1:5 to 1:10 depending on the confluence. For imaging experiments, cells were incubated in the imaging medium comprised of the FluoroBrite medium (Thermo Fisher Scientific) supplemented with 1% FBS, 1% GlutaMAX, and 1× penicillin-streptomycin in order to reduce the background fluorescence.
TNF-α stimulation
Before cytokine stimulation, cells at 80% confluency were incubated in the imaging medium for 2 h. Recombinant mouse TNF-α (Gibco) were serially diluted in the FluoroBrite medium to achieve desired concentrations.
Method details
Plasmid construction of CRISPR-Cas9-mediated gene tagging
To study the cell-to-cell variability in NF-κB activation through the lens of receptor dynamics, we first generated a double KI cell line expressing the endogenous TNFR1-mCherry and mVenus-p65 using CRISPR/Cas9-mediated fluorescent tagging (Figure 1A). Specifically, we designed targeting sequences and fused the synthetic oligo into the pAll-sgRNA-Cas9 vectors. The sgRNA recognizes the protospacer adjacent motif (PAM) sequences close to the stop codon of the last exon in Tnfr1 (exon 10). Further, to facilitate homology directed-repair (HDR) repair, a donor vector consisting of 800 bp 5’ homology arm, mCherry, and 490 bp 3’ homology arm was constructed by In-fusion cloning with a (GGS)3 module being added in 5’ of the mCherry sequence as a linker for the stabilization of fusion proteins. The pAll-Cas9.Ppuro plasmid, which contains two BsmB1 cutting sites on the upstream of sgRNA scaffold and puromycin resistance gene (puromycin N-acetyl transferase) at downstream of Cas9 was obtained from the national RNAi core facility in Academia Sinica, Taipei, Taiwan. The guiding sequence with the highest KI prediction score for Tnfr1 were designed by using the CRISPR designing tool in Benchling software (Retrieved from https://benchling.com), which is shown as follows: 5’-GGGTGTGGCTTTATCGCGGG-3’. To design the donor DNA template for homology-directed-repair (HDR), the homology arms of donor vector were generated from the genomic DNA of the MEF cells using UniversAll™ Tissue Extraction Kit (Yeastern Biotech). The donor vector comprised of 800 bp 5’homology arm, (GGS)3 linker, A, and 490 bp 3’homology arm in pUC19 backbone (Takara Bio) was conjugated using the In-Fusion® HD Cloning Kit (Takara Bio) with overlapping primer pairs.
Establishment and characterization of the KI cell line
In this study, we used immortalized MEFs derived from a transgenic mouse carrying the KI mVenus-p65 allele.13 The MEF cells growing at ∼60% confluency were buffer exchanged to fresh medium containing 7.5 μM RS-1 (Sigma-Aldrich), followed by co-transfection using 2.5 μg pAll-Cas9.Ppuro (inserted with KI guiding sequence) vector as well as the HDR donor vector carried by 1.5 μL Xfect Polymer (Takara Bio) in 100 μL Xfect Buffer (Takara Bio). After 36 h incubation, the medium was replaced by a fresh medium supplemented with 7.5 μM RS-1 and 2 μg/mL puromycin (Thermo Fisher Scientific), followed by additional incubation for 72 h. Afterwards, cells that survived the puromycin selection were subjected to fluorescence-activated cell sorting using a flow cytometry. Cells expressing significant levels of mCherry intensity, when compared to the parental MEFs (negative control), were sorted individually into a 96-well plate and the recovery rate of mCherry-expressing cells was ∼0.023% (Figure S1A). These single cells were then allowed to grow in DMEM medium with 30% FBS for 3-4 weeks until they started to form single-cell colony. For screening of the homologous KI cells, genomic DNA was extracted from every single colony and validated by the PCR genotyping and sequencing.
For western blot validation, cells in 10 cm dishes were lysed in 200 to 300 μL sample buffer comprised of 1× RIPA lysis buffer (Millipore), 1 mM phenylmethylsulfonyl fluoride (Sigma-Aldrich), and 1× cOmplete™ Protease Inhibitor Cocktail (Roche) on ice. Samples of 40-80 μg lysate were separated by 10% SDS-PAGE and transferred to polyvinylidene difluoride membranes using the Bio-Rad system. Antibodies used in this study include: Anti-TNFR1 (AF-425-PB, R&D Systems), anti-GADPH (MAB374, Merck), donkey anti-goat IgG-HRP (sc-2020, Santa Cruz Biotechnology), and Goat anti-Mouse IgG-HRP (31430, Thermo Fisher Scientific). To detect the horseradish peroxidase (HRP) signals on membranes, Western Lightning™ ECL Pro (PerkinElmer) was used and imaged by iBright FL1000 (Thermo Fisher Scientific).
TIRF microscopy
8-well μ-Slides (80827, iBidi) were thoroughly cleaned and coated with 4 μg/cm2 poly-L-Lysine (Sigma-Aldrich) solution for 2 h at room temperature, followed by carefully rinsing of the surface with sterile water. Slides were then dried in the fume hood for 2-3 h. The cell suspension was added to the coated slide at a volume of 300 μL/well, which aimed for 70-80% confluency. Cells were incubated for 16 h before the medium was replaced by the imaging medium prior to each imaging experiments.
For observing the dynamics of membrane TNFR1-mCherry in live cells, samples were imaged using the Nikon Ti microscope with TIRF module enclosed within the incubator system (LCI) maintaining at 37°C, high relative humidity and 5 % CO2. TIRF images were acquired by iXON Ultra 897EMCCD (Andor Technology) with a 100× oil CFI Apochromat TIRF objective N.A. 1.49 (Nikon). ALC601 Laser (Andor Technology) was used for mVenus-p65 excitation at 488 nm with 5-10% laser intensity and 100 ms exposure, while TNFR1-mCherry was excited at 561 nm with 10% laser intensity and 100-200 ms exposure. Optimal TIRF angles and relevant imaging parameters were operated using the MetaMorph software (Molecular Devices). Time-lapse image stacks were continuously recorded for 600 frames with 100-200 ms exposure to record trajectories of TNFR1-mCherry in cells. For imaging and photobleaching step analysis of TNFR1-mCherry in the fixed cells, cells were fixed with 3% paraformaldehyde at the specific time points (either before or after TNF-α), before submit to the TIRF imaging.
Multi-color fluorescence imaging of live cells
Cells stained with 16.23 nM nucleus marker Hoechst 33342 (Thermo Fisher Scientific) were seeded on the glass-bottom 96-well plate (Thermo Fisher Scientific) and allowed to incubate for 16 h. The medium was changed to the imaging medium before experiments. Cells were imaged by a Nikon Eclipse Ti2 microscope enclosed within an incubator system (Tokai Hit) maintaining at 5 % CO2, high relative humidity and 37°C. To monitor NF-κB activation, time-lapse fluorescence images were captured every 2 min with a 20× objective (Plan Fluor 60×; N.A. = 1.0, Nikon) using a CMOS camera (Hamamatsu) with a turn-on perfect focus system. A LED illumination system (pE-4000, CoolLED) was used as the excitation light source. For the nucleus imaging, images were acquired using 365 nm excitation with 10 % LED intensity and 10-15 ms exposure time whereas mVenus-p65 was imaged under 500 nm excitation with 50-70 % LED intensity and 500-700 ms exposure time. For TNFR1-mCherry KI MEFs, TNFR1-mCherry was imaged using 580 nm excitation with 90 % LED intensity and 800-900 ms exposure time. Meanwhile, for control experiments, cell membranes labeled with 2.5 ng/mL CellMask Deep Red (Thermo Fisher Scientific) was imaged using 647 nm excitation with 12 % LED intensity and 50 ms exposure time.
Studying the correlation between NF-κB activation and TNFR1 status
Live-cell TIRF images were analyzed under 30 min TNF-α (10 ng/mL) stimulation to observe the correlation among TNFR1 intensity, TNFR1 oligomerization state and corresponding NF-κB activation. Note that due to the intrinsic membrane fluctuation (e.g., membrane ruffling), it is challenging to quantify the TNFR1 intensity on the cell periphery at different timepoints using TIRF imaging. We thus only selected the nucleus region displaying stable imaging quality to extract the TNFR1 signal (Figure S4A). To quantify two features of membrane TNFR1 under 10 min stimulation, i.e., mean intensity and its oligomerization state, we measured the intensity from the selected area and applied single particle analysis using TrackMate function in Fiji53 to quantified each single TNFR1 spot (∼30 spots/selected area) and estimated their oligomerization states. Note that in this case, we defined objects exhibiting >2x fluorescence intensity as TNFR1 oligomers and then quantified the ratio of oligo TNFR1 counts/total TNFR1 counts to represent the level of TNFR1 oligomerization (Figure S4B). The result shows a positive correlation between TNFR1 intensity and TNFR1 oligomerization state after 10 min of TNF-α stimulation (Figure S4C).
Image analysis
A custom developed software (Matlab, The MathWorks) was used to extract the NF-κB response or nuclear mVenus-p65 intensity from time-lapse cell images.31 Briefly, the position and boundary cell nucleus were first determined using the Hoechst imaging, and the trajectory of each nucleus was linked across a sequence of images and evaluated. All recorded positions and trajectories was then applied to corresponding mVenus-p65 images to get single-cell NF-κB traces based on the median nuclear fluorescence. All trajectories of mVenus-p65 were manually inspected to remove events including cell death, cell division, or other defects that may affect the data quality. To quantify the membrane TNFR1-mCherry, we applied StarDist plugin in Fiji for nucleus detection.52 The nuclear regions were next applied as masks for extracting the surface signals in TNFR1-mCherry channel (Figure S6A). Photobleaching step analysis of TNFR1 was performed on the fixed cells using Fiji to measure each TNFR1 spot intensity. Specifically, ∼40 random single spots per cell sample were calculated for the analysis. We then performed the photobleaching steps analysis by carefully evaluating their relative intensity and manually count and classify each oligomeric state.
Single-particle tracking of TNFR1
Time-lapse images of membrane TNFR1-mCherry were analyzed using TrackMate53 plugin in Fiji for single-particle tracking. Briefly, TNFR1 spots was identified and tracked in each image to determine corresponding intensity trajectory and calculate movement speed. To analyze the TNFR1 dynamics, only objects tracked with more than 20 frames were used for this study.
Quantification and statistical analysis
Measurements on single-cell NF-κB dynamics were at least in triplicate (N ≥3). Data were expressed as means ± standard error of means (SEM). In boxplots, statistical significance between two groups was evaluated using Student two-tailed t test. In violin plot, statistical significance between three groups was evaluated using one-way ANOVA. The level of significance was set as p ≤ 0.05 or ≤ 0.001. Statistically significant data sets with p-values ≤ 0.05 are indicated with ∗ and those with p-values ≤ 0.001 are indicated with ∗∗∗.
Acknowledgments
We thank Prof. Dr. Savas Tay (Pritzker School of Molecular Engineering, University of Chicago) for help with the cell tracking algorithm and scientific consulting. We also thank the IMB Imaging Core Facilities (Institute of Molecular Biology, Academia Sinica) for help with image acquisition. This work was supported by Academia Sinica (AS-GC-111-M03) and National Science and Technology Council (former Ministry of Science and Technology) of Taiwan (MOST 110-2113-M-001-019-MY2 and NSTC-112-2628-M-001-004-MY3).
Author contributions
C.-T.C. contributed investigation, methodology, formal analysis, visualization, data curation, and writing; J.-C.H. contributed investigation, methodology, and formal analysis; A.H. contributed resources, methodology, and writing; H.-L.T. contributed conceptualization, funding acquisition, investigation, supervision, and writing. All authors commented and contributed to the final editing of the manuscript.
Declaration of interests
The authors declare no competing interests.
Published: March 11, 2024
Footnotes
Supplemental information can be found online at https://doi.org/10.1016/j.isci.2024.109486.
Supplemental information
References
- 1.Delves P.J., Roitt I.M. The immune system. First of two parts. N. Engl. J. Med. 2000;343:37–49. doi: 10.1056/NEJM200007063430107. [DOI] [PubMed] [Google Scholar]
- 2.Hoffmann A., Levchenko A., Scott M.L., Baltimore D. The IkappaB-NF-kappaB signaling module: temporal control and selective gene activation. Science. 2002;298:1241–1245. doi: 10.1126/science.1071914. [DOI] [PubMed] [Google Scholar]
- 3.Kawai T., Akira S. Signaling to NF-kappaB by Toll-like receptors. Trends Mol. Med. 2007;13:460–469. doi: 10.1016/j.molmed.2007.09.002. [DOI] [PubMed] [Google Scholar]
- 4.Nelson D.E., Ihekwaba A.E.C., Elliott M., Johnson J.R., Gibney C.A., Foreman B.E., Nelson G., See V., Horton C.A., Spiller D.G., et al. Oscillations in NF-kappaB signaling control the dynamics of gene expression. Science. 2004;306:704–708. doi: 10.1126/science.1099962. [DOI] [PubMed] [Google Scholar]
- 5.Parameswaran N., Patial S. Tumor necrosis factor-alpha signaling in macrophages. Crit. Rev. Eukaryot. Gene Expr. 2010;20:87–103. doi: 10.1615/critreveukargeneexpr.v20.i2.10. [DOI] [PMC free article] [PubMed] [Google Scholar]
- 6.van Essen D., Engist B., Natoli G., Saccani S. Two modes of transcriptional activation at native promoters by NF-kappaB p65. PLoS Biol. 2009;7:e73. doi: 10.1371/journal.pbio.1000073. [DOI] [PMC free article] [PubMed] [Google Scholar]
- 7.Giridharan S., Srinivasan M. Mechanisms of NF-kappaB p65 and strategies for therapeutic manipulation. J. Inflamm. Res. 2018;11:407–419. doi: 10.2147/JIR.S140188. [DOI] [PMC free article] [PubMed] [Google Scholar]
- 8.Tay S., Hughey J.J., Lee T.K., Lipniacki T., Quake S.R., Covert M.W. Single-cell NF-kappaB dynamics reveal digital activation and analogue information processing. Nature. 2010;466:267–271. doi: 10.1038/nature09145. [DOI] [PMC free article] [PubMed] [Google Scholar]
- 9.Turner D.A., Paszek P., Woodcock D.J., Nelson D.E., Horton C.A., Wang Y., Spiller D.G., Rand D.A., White M.R.H., Harper C.V. Physiological levels of TNFalpha stimulation induce stochastic dynamics of NF-kappaB responses in single living cells. J. Cell Sci. 2010;123:2834–2843. doi: 10.1242/jcs.069641. [DOI] [PMC free article] [PubMed] [Google Scholar]
- 10.Kellogg R.A., Tian C., Lipniacki T., Quake S.R., Tay S. Digital signaling decouples activation probability and population heterogeneity. Elife. 2015;4 doi: 10.7554/eLife.08931. [DOI] [PMC free article] [PubMed] [Google Scholar]
- 11.Lee R.E.C., Walker S.R., Savery K., Frank D.A., Gaudet S. Fold change of nuclear NF-kappaB determines TNF-induced transcription in single cells. Mol. Cell. 2014;53:867–879. doi: 10.1016/j.molcel.2014.01.026. [DOI] [PMC free article] [PubMed] [Google Scholar]
- 12.Sen S., Cheng Z., Sheu K.M., Chen Y.H., Hoffmann A. Gene Regulatory Strategies that Decode the Duration of NFkappaB Dynamics Contribute to LPS- versus TNF-Specific Gene Expression. Cell Syst. 2020;10:169–182.e5. doi: 10.1016/j.cels.2019.12.004. [DOI] [PMC free article] [PubMed] [Google Scholar]
- 13.Adelaja A., Taylor B., Sheu K.M., Liu Y., Luecke S., Hoffmann A. Six distinct NFkappaB signaling codons convey discrete information to distinguish stimuli and enable appropriate macrophage responses. Immunity. 2021;54:916–930.e7. doi: 10.1016/j.immuni.2021.04.011. [DOI] [PMC free article] [PubMed] [Google Scholar]
- 14.Cheng Q.J., Ohta S., Sheu K.M., Spreafico R., Adelaja A., Taylor B., Hoffmann A. NF-kappaB dynamics determine the stimulus specificity of epigenomic reprogramming in macrophages. Science. 2021;372:1349–1353. doi: 10.1126/science.abc0269. [DOI] [PMC free article] [PubMed] [Google Scholar]
- 15.Tudelska K., Markiewicz J., Kochańczyk M., Czerkies M., Prus W., Korwek Z., Abdi A., Błoński S., Kaźmierczak B., Lipniacki T. Information processing in the NF-kappaB pathway. Sci. Rep. 2017;7 doi: 10.1038/s41598-017-16166-y. [DOI] [PMC free article] [PubMed] [Google Scholar]
- 16.Zhang Q., Gupta S., Schipper D.L., Kowalczyk G.J., Mancini A.E., Faeder J.R., Lee R.E.C. NF-kappaB Dynamics Discriminate between TNF Doses in Single Cells. Cell Syst. 2017;5:638–645.e5. doi: 10.1016/j.cels.2017.10.011. [DOI] [PMC free article] [PubMed] [Google Scholar]
- 17.Adamson A., Boddington C., Downton P., Rowe W., Bagnall J., Lam C., Maya-Mendoza A., Schmidt L., Harper C.V., Spiller D.G., et al. Signal transduction controls heterogeneous NF-kappaB dynamics and target gene expression through cytokine-specific refractory states. Nat. Commun. 2016;7 doi: 10.1038/ncomms12057. [DOI] [PMC free article] [PubMed] [Google Scholar]
- 18.Hsu H., Shu H.B., Pan M.G., Goeddel D.V. TRADD-TRAF2 and TRADD-FADD interactions define two distinct TNF receptor 1 signal transduction pathways. Cell. 1996;84:299–308. doi: 10.1016/s0092-8674(00)80984-8. [DOI] [PubMed] [Google Scholar]
- 19.Locksley R.M., Killeen N., Lenardo M.J. The TNF and TNF receptor superfamilies: integrating mammalian biology. Cell. 2001;104:487–501. doi: 10.1016/s0092-8674(01)00237-9. [DOI] [PubMed] [Google Scholar]
- 20.Wajant H., Scheurich P. TNFR1-induced activation of the classical NF-kappaB pathway. FEBS J. 2011;278:862–876. doi: 10.1111/j.1742-4658.2011.08015.x. [DOI] [PubMed] [Google Scholar]
- 21.Yang S., Wang J., Brand D.D., Zheng S.G. Role of TNF-TNF Receptor 2 Signal in Regulatory T Cells and Its Therapeutic Implications. Front. Immunol. 2018;9:784. doi: 10.3389/fimmu.2018.00784. [DOI] [PMC free article] [PubMed] [Google Scholar]
- 22.Chan F.K., Chun H.J., Zheng L., Siegel R.M., Bui K.L., Lenardo M.J. A domain in TNF receptors that mediates ligand-independent receptor assembly and signaling. Science. 2000;288:2351–2354. doi: 10.1126/science.288.5475.2351. [DOI] [PubMed] [Google Scholar]
- 23.Vanamee É.S., Faustman D.L. Structural principles of tumor necrosis factor superfamily signaling. Sci. Signal. 2018;11 doi: 10.1126/scisignal.aao4910. [DOI] [PubMed] [Google Scholar]
- 24.Cao J., Meng F., Gao X., Dong H., Yao W. Expression and purification of a natural N-terminal pre-ligand assembly domain of tumor necrosis factor receptor 1 (TNFR1 PLAD) and preliminary activity determination. Protein J. 2011;30:281–289. doi: 10.1007/s10930-011-9330-4. [DOI] [PubMed] [Google Scholar]
- 25.Bodmer J.L., Schneider P., Tschopp J. The molecular architecture of the TNF superfamily. Trends Biochem. Sci. 2002;27:19–26. doi: 10.1016/s0968-0004(01)01995-8. [DOI] [PubMed] [Google Scholar]
- 26.Boschert V., Krippner-Heidenreich A., Branschädel M., Tepperink J., Aird A., Scheurich P. Single chain TNF derivatives with individually mutated receptor binding sites reveal differential stoichiometry of ligand receptor complex formation for TNFR1 and TNFR2. Cell. Signal. 2010;22:1088–1096. doi: 10.1016/j.cellsig.2010.02.011. [DOI] [PubMed] [Google Scholar]
- 27.Morton P.E., Perrin C., Levitt J., Matthews D.R., Marsh R.J., Pike R., McMillan D., Maloney A., Poland S., Ameer-Beg S., Parsons M. TNFR1 membrane reorganization promotes distinct modes of TNFalpha signaling. Sci. Signal. 2019;12 doi: 10.1126/scisignal.aaw2418. [DOI] [PubMed] [Google Scholar]
- 28.Karathanasis C., Medler J., Fricke F., Smith S., Malkusch S., Widera D., Fulda S., Wajant H., van Wijk S.J.L., Dikic I., Heilemann M. Single-molecule imaging reveals the oligomeric state of functional TNFalpha-induced plasma membrane TNFR1 clusters in cells. Sci. Signal. 2020;13 doi: 10.1126/scisignal.aax5647. [DOI] [PubMed] [Google Scholar]
- 29.Ashall L., Horton C.A., Nelson D.E., Paszek P., Harper C.V., Sillitoe K., Ryan S., Spiller D.G., Unitt J.F., Broomhead D.S., et al. Pulsatile stimulation determines timing and specificity of NF-kappaB-dependent transcription. Science. 2009;324:242–246. doi: 10.1126/science.1164860. [DOI] [PMC free article] [PubMed] [Google Scholar]
- 30.Shinohara H., Behar M., Inoue K., Hiroshima M., Yasuda T., Nagashima T., Kimura S., Sanjo H., Maeda S., Yumoto N., et al. Positive feedback within a kinase signaling complex functions as a switch mechanism for NF-kappaB activation. Science. 2014;344:760–764. doi: 10.1126/science.1250020. [DOI] [PubMed] [Google Scholar]
- 31.Son M., Wang A.G., Tu H.L., Metzig M.O., Patel P., Husain K., Lin J., Murugan A., Hoffmann A., Tay S. NF-kappaB responds to absolute differences in cytokine concentrations. Sci. Signal. 2021;14 doi: 10.1126/scisignal.aaz4382. [DOI] [PMC free article] [PubMed] [Google Scholar]
- 32.Paszek P., Ryan S., Ashall L., Sillitoe K., Harper C.V., Spiller D.G., Rand D.A., White M.R.H. Population robustness arising from cellular heterogeneity. Proc. Natl. Acad. Sci. USA. 2010;107:11644–11649. doi: 10.1073/pnas.0913798107. [DOI] [PMC free article] [PubMed] [Google Scholar]
- 33.Lipniacki T., Puszynski K., Paszek P., Brasier A.R., Kimmel M. Single TNFalpha trimers mediating NF-kappaB activation: stochastic robustness of NF-kappaB signaling. BMC Bioinf. 2007;8:376. doi: 10.1186/1471-2105-8-376. [DOI] [PMC free article] [PubMed] [Google Scholar]
- 34.Yao J., Pilko A., Wollman R. Distinct cellular states determine calcium signaling response. Mol. Syst. Biol. 2016;12:894. doi: 10.15252/msb.20167137. [DOI] [PMC free article] [PubMed] [Google Scholar]
- 35.Komorowski M., Tawfik D.S. The Limited Information Capacity of Cross-Reactive Sensors Drives the Evolutionary Expansion of Signaling. Cell Syst. 2019;8:76–85.e6. doi: 10.1016/j.cels.2018.12.006. [DOI] [PubMed] [Google Scholar]
- 36.Heidbreder M., Zander C., Malkusch S., Widera D., Kaltschmidt B., Kaltschmidt C., Nair D., Choquet D., Sibarita J.B., Heilemann M. TNF-alpha influences the lateral dynamics of TNF receptor I in living cells. Biochim. Biophys. Acta. 2012;1823:1984–1989. doi: 10.1016/j.bbamcr.2012.06.026. [DOI] [PubMed] [Google Scholar]
- 37.Fricke F., Malkusch S., Wangorsch G., Greiner J.F., Kaltschmidt B., Kaltschmidt C., Widera D., Dandekar T., Heilemann M. Quantitative single-molecule localization microscopy combined with rule-based modeling reveals ligand-induced TNF-R1 reorganization toward higher-order oligomers. Histochem. Cell Biol. 2014;142:91–101. doi: 10.1007/s00418-014-1195-0. [DOI] [PubMed] [Google Scholar]
- 38.Cruz J.A., Mokashi C.S., Kowalczyk G.J., Guo Y., Zhang Q., Gupta S., Schipper D.L., Smeal S.W., Lee R.E.C. A variable-gain stochastic pooling motif mediates information transfer from receptor assemblies into NF-kappaB. Sci. Adv. 2021;7 doi: 10.1126/sciadv.abi9410. [DOI] [PMC free article] [PubMed] [Google Scholar]
- 39.Simon F., Tinevez J.Y., van Teeffelen S. ExTrack characterizes transition kinetics and diffusion in noisy single-particle tracks. J. Cell Biol. 2023;222 doi: 10.1083/jcb.202208059. [DOI] [PMC free article] [PubMed] [Google Scholar]
- 40.Joo J., Plimpton S.J., Faulon J.L. Statistical ensemble analysis for simulating extrinsic noise-driven response in NF-kappaB signaling networks. BMC Syst. Biol. 2013;7:45. doi: 10.1186/1752-0509-7-45. [DOI] [PMC free article] [PubMed] [Google Scholar]
- 41.Spencer S.L., Gaudet S., Albeck J.G., Burke J.M., Sorger P.K. Non-genetic origins of cell-to-cell variability in TRAIL-induced apoptosis. Nature. 2009;459:428–432. doi: 10.1038/nature08012. [DOI] [PMC free article] [PubMed] [Google Scholar]
- 42.Mukaka M.M. Statistics corner: A guide to appropriate use of correlation coefficient in medical research. Malawi Med. J. 2012;24:69–71. [PMC free article] [PubMed] [Google Scholar]
- 43.Wong V.C., Mathew S., Ramji R., Gaudet S., Miller-Jensen K. Fold-Change Detection of NF-κB at Target Genes with Different Transcript Outputs. Biophys. J. 2019;116:709–724. doi: 10.1016/j.bpj.2019.01.011. [DOI] [PMC free article] [PubMed] [Google Scholar]
- 44.Snijder B., Pelkmans L. Origins of regulated cell-to-cell variability. Nat. Rev. Mol. Cell Biol. 2011;12:119–125. doi: 10.1038/nrm3044. [DOI] [PubMed] [Google Scholar]
- 45.Satija R., Shalek A.K. Heterogeneity in immune responses: from populations to single cells. Trends Immunol. 2014;35:219–229. doi: 10.1016/j.it.2014.03.004. [DOI] [PMC free article] [PubMed] [Google Scholar]
- 46.Werner S.L., Barken D., Hoffmann A. Stimulus specificity of gene expression programs determined by temporal control of IKK activity. Science. 2005;309:1857–1861. doi: 10.1126/science.1113319. [DOI] [PubMed] [Google Scholar]
- 47.Cheng Z., Taylor B., Ourthiague D.R., Hoffmann A. Distinct single-cell signaling characteristics are conferred by the MyD88 and TRIF pathways during TLR4 activation. Sci. Signal. 2015;8:ra69. doi: 10.1126/scisignal.aaa5208. [DOI] [PMC free article] [PubMed] [Google Scholar]
- 48.Alon U. Network motifs: theory and experimental approaches. Nat. Rev. Genet. 2007;8:450–461. doi: 10.1038/nrg2102. [DOI] [PubMed] [Google Scholar]
- 49.Yu X., James S., Felce J.H., Kellermayer B., Johnston D.A., Chan H.T.C., Penfold C.A., Kim J., Inzhelevskaya T., Mockridge C.I., et al. TNF receptor agonists induce distinct receptor clusters to mediate differential agonistic activity. Commun. Biol. 2021;4 doi: 10.1038/s42003-021-02309-5. [DOI] [PMC free article] [PubMed] [Google Scholar]
- 50.Vunnam N., Yang M., Lo C.H., Paulson C., Fiers W.D., Huber E., Been M., Ferguson D.M., Sachs J.N. Zafirlukast Is a Promising Scaffold for Selectively Inhibiting TNFR1 Signaling. ACS Bio Med Chem Au. 2023;3:270–282. doi: 10.1021/acsbiomedchemau.2c00048. [DOI] [PMC free article] [PubMed] [Google Scholar]
- 51.Weinelt N., Karathanasis C., Smith S., Medler J., Malkusch S., Fulda S., Wajant H., Heilemann M., van Wijk S.J.L. Quantitative single-molecule imaging of TNFR1 reveals zafirlukast as antagonist of TNFR1 clustering and TNFα-induced NF-κB signaling. J. Leukoc. Biol. 2021;109:363–371. doi: 10.1002/Jlb.2ab0420-572rr. [DOI] [PubMed] [Google Scholar]
- 52.Schmidt U., Weigert M., Broaddus C., Myers G. International Conference on Medical Image Computing and Computer-Assisted Intervention. 2018. Cell Detection with Star-Convex Polygons; pp. 265–273. [DOI] [Google Scholar]
- 53.Tinevez J.Y., Perry N., Schindelin J., Hoopes G.M., Reynolds G.D., Laplantine E., Bednarek S.Y., Shorte S.L., Eliceiri K.W. TrackMate: An open and extensible platform for single-particle tracking. Methods. 2017;115:80–90. doi: 10.1016/j.ymeth.2016.09.016. [DOI] [PubMed] [Google Scholar]
Associated Data
This section collects any data citations, data availability statements, or supplementary materials included in this article.
Supplementary Materials
Data Availability Statement
-
•
All data reported in this study will be shared by the lead contact upon request.
-
•
This study does not report original code.
-
•
Any additional information required to reanalyze the data reported in this paper is available from the lead contact upon request.