

Abstract
The superior frontal sulcus (SFS) is the major sulcus on the dorsolateral frontal cortex that defines the lateral limit of the superior frontal gyrus. Caudally, it originates near the superior precentral sulcus (SPRS) and, rostrally, it terminates near the frontal pole. The advent of structural neuroimaging has demonstrated significant variability in this sulcus that is not captured by the classic sulcal maps. The present investigation examined the morphological variability of the SFS in 50 individual magnetic resonance imaging (MRI) scans of the human brain that were registered to the Montreal Neurological Institute (MNI) standard stereotaxic space. Two primary morphological patterns were identified: (i) the SFS was classified as a continuous sulcus or (ii) the SFS was a complex of sulcal segments. The SFS showed a high probability of merging with neighbouring sulci on the superior and middle frontal gyri and these patterns were documented. In addition, the morphological variability and spatial extent of the SFS were quantified using volumetric and surface spatial probability maps. The results from the current investigation provide an anatomical framework for understanding the morphology of the SFS, which is critical for the interpretation of structural and functional neuroimaging data in the dorsolateral frontal region, as well as for improving the accuracy of neurosurgical interventions.
Keywords: anatomo‐functional relationships, MNI space, MRI, neurosurgical interventions, probability maps, sulcal morphology, superior frontal sulcus
Detailed examinations of sulcal morphology are necessary to improve the localization of functional activity in relation to specific anatomical landmarks and to improve our understanding of intrinsic neuroanatomical landmarks used during neurosurgical interventions. The present investigation characterized the morphological variability of the superior frontal sulcus (SFS) in 50 individual subject magnetic resonance imaging (MRI) volumes (i.e., 100 hemispheres) registered to the Montreal Neurological Institute (MNI) stereotaxic space. The morphological patterns of the posterior (red) and anterior (green) rami of the SFS were quantified using volumetric and surface spatial probability maps, which are made freely available.

1. INTRODUCTION
Although the sulci of the human cerebral cortex demonstrate inter‐individual variability, they follow a consistent topographical organization that is considered to be controlled genetically (Tamraz & Comair, 2006; Zhang et al., 2013) and they often limit cytoarchitectonic areas (Brodmann, 1903, 1908, 1909; Economo & Koskinas, 1925; Petrides & Pandya, 1994, 1999; Zilles & Amunts, 2012). More recently, functional neuroimaging studies using single‐subject analyses have demonstrated a consistent relationship between sulcal folds and functional areas (Amiez et al., 2013; Amiez & Petrides, 2018; Tomaiuolo & Giordano, 2016). Thus, a detailed examination of sulcal morphological variability is necessary to improve the localization of functional activity in relation to specific anatomical landmarks and in establishing accurate structure‐to‐function relationships.
The superior frontal sulcus (SFS) is a dorsal and horizontally directed sulcus of the frontal lobe, beginning caudally near the superior precentral sulcus (SPRS), and terminating rostrally near the frontal pole. It is, therefore, the sulcus that defines the lateral limit of the superior frontal gyrus (see Figure 1; Petrides, 2012, 2014, 2019). In the classic cytoarchitectonic map of the human cerebral cortex by Brodmann (1909), the SFS separates the parts of the cortical areas 6, 8, and 9 that lie on the superior frontal gyrus from those that lie on the middle frontal gyrus (Figure 2a). There is evidence that there are differences in the connectivity and even the cytoarchitecture of the areas that lie above and below the SFS. For example, the part of area 8 below the SFS, on the middle frontal gyrus (MFG), is a granular cortical region referred to as area 8A, whereas the part that lies above the SFS, on the superior frontal gyrus (SFG), is a dysgranular area referred to as area 8B (Petrides & Pandya, 1994, 1999). Research in non‐human primates, patients, and functional neuroimaging in healthy subjects has implicated granular area 8A in the higher order cognitive allocation of attention to sensory stimuli in the environment (Amiez et al., 2006; Germann & Petrides, 2020a, 2020b; Petrides, 1985a, 1985b, 1987, 1990). Specifically, a recent study by Amiez and Petrides (2018) demonstrated that the posterior SFS may act as an important functional landmark for activity related to the high‐level cognitive attentional selection of eye movements. Thus, an in‐depth understanding of the local morphological variability of the SFS will facilitate the interpretation of functional activity in neuroimaging studies investigating anatomo‐functional relationships in the dorsolateral frontal cortex. In addition, accurate localization of cerebral sulci can help guide the placement of ‘seeds’ for connectivity analyses using novel methodologies, such as Diffusion Tensor Imaging (DTI; Barbeau et al., 2020; Maier‐Hein et al., 2017).
FIGURE 1.
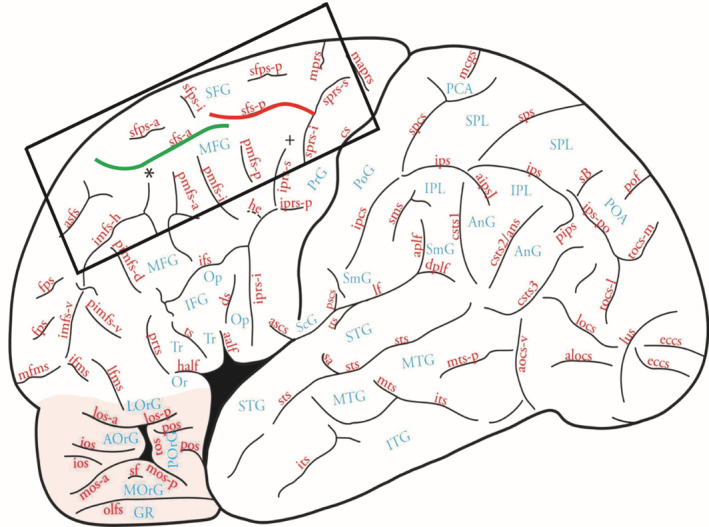
Sulcal map of the lateral surface of the human brain by Petrides (2012, 2019). Note that the anterior ramus of the superior frontal sulcus (sfs‐a) is highlighted in green; the posterior ramus of the superior frontal sulcus (sfs‐p) in red. Figure 1 is reproduced with permission by Elsevier. Abbreviations of the frontal cortex around the sfs are outlined in the rectangle: asfs, accessory superior frontal sulcus; imfs‐h, horizontal ramus of the intermediate frontal sulcus; mprs, medial precentral sulcus; pmfs‐a, anterior ramus of the posterior middle frontal sulcus; pmfs‐i, intermediate ramus of the posterior middle frontal sulcus; pmfs‐p, posterior ramus of the posterior middle frontal sulcus; sfps‐a, anterior ramus of the superior frontal paramidline sulcus; sfps‐i, intermediate ramus of the superior frontal paramidline sulcus; sfps‐p, posterior ramus of the superior frontal paramidline sulcus; sprs‐i, inferior ramus of the superior precentral sulcus; sprs‐s, superior ramus of the superior precentral sulcus.
FIGURE 2.

Cytoarchitectonic maps with the superior frontal sulcus (SFS) highlighted in red: (a) Brodmann (1909) and (b) Economo and Koskinas (1925).
Furthermore, sulci represent important morphological features used during neurosurgical interventions that must identify functional regions for brain stimulation or locations for brain tumour resection (Tomaiuolo & Giordano, 2016). In fact, the SFS provides neurosurgeons with a reliable landmark and effective corridor to the lateral ventricles and the foramen of Monro, by dissecting through the SFS in order to minimize cortical damage when reaching internal brain structures (Gonul et al., 2014; Koutsarnakis et al., 2017; Sampath et al., 2014). A detailed understanding of the morphological patterns of this sulcus can have direct implications for decreasing postoperative complications in the dorsolateral frontal region.
The present investigation characterized the morphological variability of the SFS in the Montreal Neurological Institute (MNI) stereotaxic space that is now widely used in structural and functional studies of the human brain. The SFS was labelled in individual subjects to establish precise morphological patterns and to provide distinct criteria for its identification in relation to neighbouring sulci. Next, the morphological patterns were quantified using volumetric and surface spatial probability maps in continuous serial magnetic resonance imaging (MRI) sections and surface reconstructions of the brain. The results presented here define the morphological variation of the SFS in‐vivo MRI scans of individual subject brains and document its location in standard MNI stereotaxic space in order to facilitate the development of accurate structure‐to‐function relationships in functional neuroimaging studies, as well as improve our understanding of intrinsic neuroanatomical landmarks used during neurosurgical interventions.
2. MATERIALS AND METHODS
2.1. Subjects
The morphology of the SFS in the human brain was examined in 50 MRI scans (i.e., 100 hemispheres) that were randomly selected from the S1200 minimally preprocessed 3T data release of the Human Connectome Project (HCP) (Glasser et al., 2013). The sample included 22 males (mean age 30.6 years, standard deviation (SD) 3.14) and 28 females (mean age 29.1, SD 3.17) and the subjects were not related to each other. All subjects were right‐handed, had no history of neurological and/or psychiatric illness, and informed consent was obtained by the HCP.
2.2. Magnetic resonance imaging
MRI scans were acquired using the HCP's custom 3T Siemens “Connectome Skyra” scanner with a 32‐channel head coil. High‐resolution three‐dimensional magnetization‐prepared rapid gradient echo (3D‐MPRAGE) sequence images (T r = 2400 ms, T e = 2.14 ms, TI = 1000 ms, flip angle 8°, FOV = 224 × 224 mm2) with 0.7 mm isotropic resolution acquired 256 slices per slab for T1‐weighted anatomical images (Glasser et al., 2013). Structural images were corrected for gradient nonlinearity distortion (Jovicich et al., 2006). Additional details regarding the acquisition can be obtained by consulting the HCP S1200 Reference Manual. For the present investigation, the SFS was identified on MRI volumes that were preprocessed by the HCP PreFreeSurfer pipeline, which provides structural images in the subject's undistorted native volume space—details of which can be found in Glasser et al. (2013). In brief, average T1‐weighted images were aligned to the MNI space template using a rigid 6 degrees of freedom (DOF) transform, derived from a 12 DOF affine registration (Glasser et al., 2013; Jenkinson et al., 2002; Jenkinson & Smith, 2001). This normalization accounts for inter‐individual differences in gross brain size by aligning the coordinate space axes to the MNI template, while maintaining the original size and shape of the brain. The structural images were subsequently corrected for gradient and bias field distortions.
2.3. Sulcal identification and labelling
Identification of the SFS was carried out using criteria provided in recent atlases of the sulcal morphology of the human cerebral cortex in MNI stereotaxic space (Petrides, 2012, 2014, 2019). A systematic anatomical examination was conducted using the subjects' MRI volumes in native space, in tandem with surface reconstructions obtained from the HCP FreeSurfer pipeline, provided in the ‘Structural Extended Package’ of intermediate FreeSurfer outputs (Glasser et al., 2013). The extracted pial and white matter surfaces were used in conjunction with MRI volumes in order to improve the accuracy of identifying the SFS with respect to neighbouring sulci.
The SFS is traditionally defined as the dorsal and horizontally directed sulcus of the frontal lobe, separating the superior from the middle frontal gyrus (see Figures 1 and 2; Cunningham, 1892; Economo & Koskinas, 1925; Connolly, 1941; Sarkissov et al., 1955; Petrides, 2012, 2014, 2019). In this investigation, when present, both the anterior and posterior rami of the superior frontal sulcus (SFS‐a and SFS‐p, respectively) were examined (see Figure 1; Petrides, 2019). Thus, in addition to the fundamental description of the SFS provided above, additional criteria were developed for the identification of both rami of the sulcus of interest. In this study, in cases where the SFS‐p did not terminate caudally as a distinct sulcus, its posterior boundary was considered the intersection point with the SPRS (Connolly, 1941; Cunningham, 1892; Petrides, 2014). The SFS‐a exhibited greater variability and a higher likelihood of merging with various sulci at the frontal pole and these morphological patterns were documented (Table 2). A conservative approach was adopted in distinguishing the SFS from surrounding sulci on the SFG and MFG with which it may merge (see Figure 1). Given that the SFS is historically described as the deep horizontal sulcus separating the SFG from the MFG, in the present investigation, both rami of the SFS were identified primarily based on their horizontal direction. Thus, neighbouring vertical or orthogonal sulci which merged with the SFS were not labelled as the sulcus of interest. In some cases, the SFS was observed to merge superficially—that is, when inspecting the surface of the cortex—with these vertically oriented neighbouring sulci. However, upon closer inspection within the depth of the cortex, these sulci were separated from the SFS by way of a submerged gyral passage (pli de passage). These variations were considered to be clearly distinct from the SFS by detecting a pli de passage in at least one horizontal section (i.e., at least 1 mm in size), in tandem with reconstructed cortical surfaces (Zlatkina et al., 2022).
TABLE 2.
Frequency of the merging of the superior frontal sulcus (SFS), Subtype Ib and Subtype IIb, with surrounding frontal sulci.
| Total no. hemispheres | Subtype Ib | Subtype Ib LH | Subtype Ib RH | Subtype IIb | Subtype IIb LH | Subtype IIb RH | |
|---|---|---|---|---|---|---|---|
| sprs | 65 | 24 | 11 | 13 | 41 | 20 | 21 |
| pmfs‐p | 20 | 7 | 3 | 4 | 13 | 8 | 5 |
| pmfs‐i | 32 | 7 | 3 | 4 | 25 | 9 | 16 |
| pmfs‐a | 18 | 7 | 4 | 3 | 11 | 3 | 8 |
| sfps‐a | 13 | 3 | 2 | 1 | 10 | 4 | 6 |
| sfps‐i | 15 | 3 | 1 | 2 | 12 | 7 | 5 |
| sfps‐p | 9 | 2 | 2 | – | 7 | 4 | 3 |
| imfs‐h | 10 | 5 | 3 | 2 | 5 | 3 | 2 |
| asfs | 29 | 11 | 5 | 6 | 18 | 7 | 11 |
Note: The frequency that the superior frontal sulcus (SFS) or SFS sulcal complex merges with surrounding sulci on the frontal lobe. The SFS was considered to merge with another frontal sulcus in the absence of a gyrus visible on the surface of the cortex or by way of a submerged gyrus called pli de passage. Refer to the Morphological patterns section of the ‘Results’ for an explanation of the different classifications.
Abbreviations: ASFS, accessory superior frontal sulcus; IMFS‐h, horizontal ramus of the intermediate frontal sulcus; LH, left hemisphere; PMFS‐a, anterior ramus of the posterior middle frontal sulcus; PMFS‐i, intermediate ramus of the posterior middle frontal sulcus; PMFS‐p, posterior ramus of the posterior middle frontal sulcus; RH, right hemisphere; SFPS‐a, anterior ramus of the superior frontal paramidline sulcus; SFPS‐i, intermediate ramus of the superior frontal paramidline sulcus; SFPS‐p, posterior ramus of the superior frontal paramidline sulcus; SPRS, superior precentral sulcus.
The SFS was labelled using the methodology described in Drudik et al. (2023), who carried out an examination of the superior parietal sulcus (SPS) in the human brain based on a subset of MRI scans acquired from the International Consortium for Brain Mapping (ICBM) project. The reader may refer to that article for a detailed description of the methods used to label the sulcus of interest in MRI volumes using the interactive imaging software, DISPLAY (MacDonald, 1996; Vincent et al., 2016).
2.4. Probability maps
The morphology of the SFS in individual subjects was examined and quantified with volumetric and surface spatial probability maps in continuous serial MRI volumes and surface reconstructions of the brain, respectively. The reader should note that these two types of spatial probability maps display fundamentally different information about the morphology of a sulcus. Both the volumetric and surface spatial probability maps are presented here to provide a thorough depiction of the morphology and spatial variability of the SFS in the MNI standard stereotaxic space.
Volumetric and surface probability maps were created according to the methods described in detail in Drudik et al. (2023). After sulcal labelling, CIVET version 2.1.1., available via the CBRAIN web‐based software (Ad‐Dab'bagh et al., 2006; Sherif et al., 2014; https://mcin.ca/technology/cbrain/), was used to estimate a nonlinear transformation of each MRI scan to the asymmetric version of the MNI template (MNI152 2009c asymmetric; Collins et al., 1994; Fonov et al., 2011). This transformation was then applied to the SFS labels using MINC Toolkit (Collins et al., 1994), keeping the left and right hemispheres separate. Volumetric spatial probability maps were created, representing the probability from 0% to 100% that any given voxel in MNI stereotaxic space belongs to the SFS. Volumetric maps were then blurred using a Gaussian kernel with full width at half maximum (FWHM) of 2 mm. The maps of the left and right hemispheres were superimposed onto the MNI152 template that was used for registration, illustrated in Figures 3, 4, 5. The probability values of the voxels are depicted using a colour scale and the maps have been thresholded to a minimum of 5% for the purpose of illustration. The MNI152 coordinates of the voxel with the highest overlap are provided (Table 3).
FIGURE 3.

Volumetric probability maps of the Type I superior frontal sulcus (SFS) from left and right hemispheres superimposed onto the (a) horizontal and (b) coronal sections of the MNI152 2009c asymmetric template that was used for registration. For the horizontal sections, the z coordinate is shown in the top right corner of each section; the x and y coordinates are on the appropriate axes. For the coronal sections, the y coordinate is shown in the top right corner of each section; the x and z coordinates are on the appropriate axes. The colour bar indicates the extent of the overlap of the labelled voxels. LH, left hemisphere; RH, right hemisphere.
FIGURE 4.

Volumetric probability maps of the Type II, anterior ramus of the superior frontal sulcus (SFS‐a) from left and right hemispheres superimposed onto the (a) horizontal and (b) coronal sections of the MNI152 2009c asymmetric template that was used for registration. For the horizontal sections, the z coordinate is shown in the top right corner of each section; the x and y coordinates are shown on the appropriate axes. For the coronal sections, the y coordinate is shown in the top right corner of each section; the x and z coordinates are on the appropriate axes. The colour bar indicates the extent of the overlap of the labelled voxels. LH, left hemisphere; RH, right hemisphere.
FIGURE 5.

Volumetric probability maps of the Type II, posterior ramus of the superior frontal sulcus (SFS‐p) from left and right hemispheres superimposed onto the (a) horizontal and (b) coronal sections of the MNI152 2009c asymmetric template that was used for registration. For the horizontal sections, the z coordinate is shown in the top right corner of each section; the x and y coordinates are shown on the appropriate axes. For the coronal sections, the y coordinate is shown in the top right corner of each section; the x and z coordinates are shown on the appropriate axes. The colour bar indicates the extent of the overlap of the labelled voxels. LH, left hemisphere; RH, right hemisphere.
TABLE 3.
MNI152 stereotaxic coordinates (x, y, z) of the superior frontal sulcus (SFS) with the highest probability value: volumetric spatial probability maps.
| x | y | z | Probability (%) | |
|---|---|---|---|---|
| Type I | ||||
| LH | −25 | +13 | +43 | 16 |
| RH | +25 | +26 | +38 | 21 |
| Type II—Anterior | ||||
| LH | −20 | +36 | +35 | 11 |
| RH | +25 | +27 | +36 | 10 |
| Type II—Posterior | ||||
| LH | −21 | +04 | +50 | 12 |
| RH | +21 | +15 | +44 | 12 |
Note: Coordinates are in MNI152 stereotaxic space. The probability values represent the maximum overlap of the labelled voxels from 0% to 100%.
Abbreviations: LH, left hemisphere; RH, right hemisphere.
Subsequently, surface spatial probability maps were generated, which represent the likelihood of each vertex on the reconstructed cortical surface belonging to the SFS from 0% to 100%. First, the volumetric labels were overlaid onto the pial surfaces of their respective left and right hemispheres, and then with a nonlinear transform, registered to the average surface space that interpolates the cortical morphology of an individual surface to an average surface, using the open‐access pipeline Freesurfer (Dale et al., 1999). Following this step, the average of the labels was blurred using a Gaussian kernel with FWHM of 3 mm and the maps of the left and right hemispheres were overlaid onto the average surface template that was used for registration (Figure 6). The probability values of each vertex are depicted by a colour scale and the maps were thresholded to a minimum value of 4% for the purpose of illustration. The stereotaxic coordinates of the vertex with the highest probability of belonging to the SFS are provided in MNI305 (Evans et al., 1993), the default volumetric space used by the FreeSurfer pipeline (Table 4).
FIGURE 6.

Surface probability maps of the superior frontal sulcus (SFS) from (a) Type I left hemispheres; (b) Type I right hemispheres; (c) anterior ramus of Type II left hemispheres; (d) anterior ramus of Type II right hemispheres; (e) posterior ramus of Type II left hemispheres; and (f) posterior ramus of Type II right hemispheres. All probability maps have been overlaid onto the surface template, fsaverage, used for registration. The colour bar indicates the extent of overlap of the labelled vertices. The x, y, z coordinates below each surface indicate the position, in MNI305 stereotaxic space, of the vertex with the maximum overlap. A, anterior; D, dorsal; CS, central sulcus; SPRS, superior precentral sulcus.
TABLE 4.
MNI305 stereotaxic coordinates (x, y, z) of the superior frontal sulcus (SFS) with the highest probability value: surface spatial probability maps.
| x | y | z | Probability (%) | |
|---|---|---|---|---|
| Type I | ||||
| LH | −23 | +23 | +40 | 22 |
| RH | +24 | +17 | +48 | 23 |
| Type II—Anterior | ||||
| LH | −26 | +27 | +36 | 19 |
| RH | +25 | +32 | +36 | 14 |
| Type II—Posterior | ||||
| LH | −21 | +11 | +52 | 20 |
| RH | +25 | +16 | +46 | 21 |
Note: Coordinates are in MNI305 stereotaxic space, which is the default volumetric space of the fsaverage template in FreeSurfer. The probability values represent the maximum overlap of the labelled vertices from 0% to 100%.
Abbreviations: LH, left hemisphere; RH, right hemisphere.
All spatial volumetric and surface probability maps are freely available in the Dryad database (http://doi.org/10.5061/dryad.6wwpzgn4x). The figures were created using the graphical design software packages Adobe Photoshop and Adobe Illustrator.
3. RESULTS
3.1. Morphological patterns
The SFS was identified in all hemispheres following a systematic investigation in 2D MRI sections, in addition to visual inspection of 3D reconstructions of the pial and white matter surfaces of the brain. The SFS was always visible on the lateral surface, terminating caudally near the SPRS and extending horizontally towards the frontal pole. It was distinguished from other neighbouring sulci based on its considerable length and depth compared to the smaller surrounding sulci of the SFG and MFG (see Figure 1), as well as its relative horizontal direction along the anterior‐to‐posterior length of the frontal lobe. Thus, vertically and orthogonally directed sulci that merged with the SFS on the surface of the cortex or were distinct by way of a submerged gyral bridge were considered extensions of neighbouring sulci on the SFG and MFG.
Two primary morphological patterns were consistently identified across human brains, the frequency of which can be found in Table 1. In Type I, observed in 42% of all hemispheres (24% of left hemispheres, 18% of right hemispheres), the SFS was a continuous sulcus, that is, as depicted in the early sulcal maps of the 20th century (Figure 2; Brodmann, 1908, 1909; Economo & Koskinas, 1925). In Type II, observed in 58% of all hemispheres (26% of left hemispheres, 32% of right hemispheres), the SFS was found to be a discontinuous sulcal complex, comprising two sulcal segments identified as the anterior ramus (SFS‐a) and the posterior ramus (SFS‐p) of the SFS (Figure 1; Petrides, 2012, 2014, 2019). In order to be classified as Type II, the sulcal segments had to be clearly separate from each other on the surface of the brain or by way of any deep or submerged parts of the sulcus, that is, plis de passage.
TABLE 1.
Incidence rates of the two types of primary morphological patterns of the superior frontal sulcus (SFS) in the left and right hemispheres of the human brain.
| Total no. hemispheres | Total no. LH | Total no. RH | Peason chi‐square | p value | |
|---|---|---|---|---|---|
| Type I total | 42 | 24 | 18 | 1.478 (1.026) | 0.224 (0.311) |
| Subtype Ia | 6 | 4 | 2 | 0.709 (0.177) | 0.400 (0.674) |
| Subtype Ib | 36 | 20 | 16 | 0.694 (0.391) | 0.405 (0.532) |
| Type II total | 58 | 26 | 32 | 1.478 (1.026) | 0.224 (0.311) |
| Subtype IIa | 2 | 1 | 1 | 0 (0) | 1.0 (1.0) |
| Subtype IIb | 56 | 25 | 31 | 1.461 (1.015) | 0.227 (0.314) |
| Irregular types | |||||
| Subtype Ib: 90° merge | 6 | 4 | 2 | 0.709 (0.177) | 0.400 (0.674) |
| Subtype IIb: SFS‐p multiple branches | 8 | 5 | 3 | 0.543 (0.136) | 0.461 (0.712) |
| Subtype IIb: SFS‐p posterior SPRS | 2 | 1 | 1 | 0 (0) | 1.0 (1.0) |
Note: The morphological patterns of the superior frontal sulcus (SFS) were examined in 50 MRI volumes (i.e., 100 hemispheres). Two primary morphological patterns were identified (Types I‐II). Refer to the Morphological patterns section of the ‘Results’ for an explanation of the different classifications. The Pearson's chi‐squared test was used to assess the significance of interhemispheric differences in frequency; the values in brackets are adjusted after applying a continuity correction.
Abbreviations: LH, left hemisphere; RH, right hemisphere; SFS‐p, posterior ramus of the superior frontal sulcus.
Each of these primary morphological types could then be further subdivided based on whether the SFS merged or not with surrounding frontal sulci (see Tables 1 and 2). In Subtype a, the SFS was found as a distinct sulcus or sulcal complex that did not merge with any of the surrounding frontal sulci. Thus, Subtype Ia was defined as the SFS being a single and distinct sulcus, not merging with any nearby frontal sulci visible on the surface of the brain or by way of plis de passage. This pattern was observed in only 6% of all hemispheres examined (4% of left hemispheres, 2% of right hemispheres). In Subtype IIa, occurring in only 2% of the hemispheres from the sample (1% in the left and 1% in the right hemispheres), the SFS was found as a sulcal complex comprising both an anterior and a posterior ramus, where neither segment merged with another surrounding frontal sulcus, and both were entirely distinct. In Subtype b, which constituted the majority of hemispheres, the SFS or SFS complex was found to merge with neighbouring frontal sulci on the SFG and MFG. A sulcus was considered to merge with the SFS in the absence of a visible or submerged gyrus. Subtype Ib represents those hemispheres in which the SFS was a single and continuous sulcus that merged with a neighbouring sulcus on the surface of the frontal lobe. This pattern was observed in 36% of all hemispheres examined (20% of left hemispheres, 16% of right hemispheres). In the case of Subtype IIb, the SFS was found as two sulcal segments and at least one of the segments merged with another frontal sulcus, and this pattern constituted 46% of all hemispheres (19% of left hemispheres, 27% of right hemispheres).
The incidence of the SFS or SFS complex merging with a neighbouring frontal sulcus is presented in Table 2 (i.e., Subtypes Ib and IIb). The reader will note that several hemispheres could be classified into more than one merging group. In other words, if the sulcus of interest merged with more than one neighbouring frontal sulcus along its path, then the hemisphere was reported more than once. These results are provided in Table 2 to improve our understanding of the merging patterns of the SFS or SFS complex with sulci on the superior and middle frontal gyri. The SFS or SFS complex merged most frequently with the SPRS (at the posterior limit of the SFS) in 65% of all hemispheres examined. Of these cases, 24% of hemispheres were characterized as Subtype Ib (11% of left hemispheres, 13% of right hemispheres), while 41% were identified as Subtype IIb (20% of left hemispheres, 21% of right hemispheres). On the middle frontal gyrus, the SFS was found to merge with any of the three posterior middle frontal sulci (PMFS); that is, the posterior (PMFS‐p), intermediate (PMFS‐i), or anterior (PMFS‐a) rami. Specifically, the SFS merged with the PMFS‐p in 20% of all hemispheres, with 7% of these cases being classified Subtype Ib (3% of left hemispheres, 4% of right hemispheres), and 13% of these cases being Subtype IIb (8% of left hemispheres, 5% of right hemispheres). The PMFS‐i was found to merge with the SFS in 32% of all hemispheres examined, and 7% of these hemispheres showed a continuous SFS (Subtype Ib; 3% of left hemispheres, 4% of right hemispheres), and 25% were classified as a discontinuous SFS complex (Subtype IIb; 9% of left hemispheres, 16% of right hemispheres). The anterior ramus of the PMFS (PMFS‐a) was seen to merge with the SFS or SFS complex in 18% of hemispheres examined, with 7% identified as Subtype Ib (4% of left hemispheres, 3% of right hemispheres), and 11% labelled as Subtype IIb (3% of left hemispheres, 8% of right hemispheres). On the superior frontal gyrus, the SFS or SFS sulcal complex merged with any of the posterior, intermediate, or anterior superior frontal paramidline sulci (SFPS‐p, SFPS‐i, and SFPS‐a, respectively). The SFPS‐p merged with the SFS in 9% of hemispheres in the sample, with only 2% of those cases being Subtype Ib (all left hemispheres), and 7% being Subtype IIb (4% of left hemispheres, 3% of right hemispheres). The SFPS‐i was found to merge in 15% of cases, with 3% and 12% of these hemispheres being identified as Subtype Ib (1% of left hemispheres, 2% of right hemispheres) and Subtype IIb (7% of left hemispheres, 5% of right hemispheres), respectively. The SFS or SFS complex merged with the SFPS‐a in 13% of the brains examined, with only 3% representing Subtype Ib (2% of left hemispheres, 1% of right hemispheres), and 10% as Subtype IIb (4% of left hemispheres, 6% of right hemispheres). Near the frontal pole, the SFS merged with the horizontal ramus of the intermediate frontal sulcus (IMFS‐h) in 10% of all hemispheres examined, with Subtype Ib and IIb each representing 5% of all these hemispheres (3% of left hemispheres, 2% of right hemispheres for both Subtypes Ib and IIb). Finally, the accessory superior frontal sulcus (ASFS) merged with the SFS or SFS complex in 29% of all hemispheres, where 11% of these cases were identified as Subtype Ib (5% of left hemispheres, 6% of right hemispheres), and 18% of these cases were labelled as Subtype IIb (7% of left hemispheres, 11% of right hemispheres).
Additional irregular morphological patterns that occurred with lower frequency are also presented in Table 1. A less frequently observed pattern, categorized as Subtype Ib, appeared when the sulcal segments of the SFS complex (SFS‐a and SFS‐p) were clearly identifiable as separate sulci that merged by way of a vertical neighbouring sulcus, connecting the SFS‐a and SFS‐p at a 90° angle. Thus, despite there being two separate segments, the SFS complex was considered a Type I continuous SFS, as the two rami were connected by way of another sulcus. This pattern occurred in 6% of all hemispheres examined, with 4% of these found in left hemispheres and 2% found in right hemispheres. Another infrequent pattern, which was classified as Subtype IIb, was identified when the posterior ramus of the SFS was found in more than one branch, usually two segments. Thus, the entire SFS complex included three segments in total. In these rare cases, the two caudal‐most segments were classified as branches belonging to the SFS‐p, given that they were short in length and found within the caudal dorsolateral frontal cortex; the third horizontal segment was found more anteriorly and was categorized as belonging to the SFS‐a. This pattern was observed in only eight hemispheres, constituting 8% of the sample (5% of left hemispheres, 3% of right hemispheres). Finally, in only two hemispheres (1% left and 1% right hemispheres), the caudal termination point of the SFS‐p occurred posterior to the SPRS. These cases were identified if the SFS‐p was distinct from the SPRS at its caudal termination point and it was clearly a continuation of the SFS‐p and, thus, could not be excluded from being labelled as part of the SFS‐p. A total of 10 hemispheres categorized as irregular Subtype IIb were excluded from the spatial probability maps given that these morphological patterns were extremely rare. Further, an additional six hemispheres in which the SFS‐a merged with a sulcus near the frontal pole that was difficult to identify were excluded from the spatial probability maps.
3.2. Interhemispheric differences
Hemispheric differences in the morphological pattern observed in the same brain were documented. In total, 60% of the hemispheres from the sample (30 brains) showed the same sulcal morphological pattern in both hemispheres (i.e., both hemispheres were either Type I or Type II). Of the brains with a congruent hemispheric pattern, 11 brains (22 hemispheres) were classified as a continuous Type I SFS, and 19 brains (38 hemispheres) showed a discontinuous Type II SFS. Interestingly, not all brains that were congruent across their primary morphological pattern, maintained the same Subtype across hemispheres. Of the 30 brains that showed the same primary morphological pattern across hemispheres (i.e., congruent Type I or Type II SFS), only 27 brains also merged with at least one neighbouring frontal sulcus across both hemispheres, thus, showing the same Subtype b as well. Furthermore, none of the brains were classified as Subtype a across both hemispheres. Taken together, these findings indicate that at least one hemisphere in all brains examined in the sample showed an SFS that merged with at least one other neighbouring frontal sulcus.
A chi‐square test of independence was used to investigate statistically significant interhemispheric differences in the frequency of all morphological patterns identified in the present investigation, the results of which are presented in Table 1. There was no statistically significant difference between the number of left and right hemispheres for any of the comparisons. In addition, a chi‐square test of independence examining the relationship between gender and the interhemispheric congruence across primary morphological patterns did not show any significant difference between the two variables, X 2 (1, N = 50) = 0.034, p = 0.854.
3.3. Spatial probability maps
Volumetric and surface spatial probability maps were created to quantify the morphological variability and spatial extent of the SFS in the MNI stereotaxic space. The spatial probability maps were created separately for the left and right hemispheres and are presented in Figures 3, 4, 5, 6. Volumetric spatial probability maps demonstrate the spatial variability of the SFS within the three dimensions of MNI stereotaxic space (see Figures 3, 4, 5), while surface spatial probability maps do so within the two dimensions of surface space (see Figure 6). The reader is reminded that the purpose of presenting the two types of spatial probability maps was not to compare them, but rather to provide additional analyses of the position of the SFS within the dorsolateral frontal cortex.
3.3.1. Volumetric maps
The volumetric probability maps represent the likelihood that any voxel in standard MNI space belongs to the SFS. The probability maps for each morphological type are presented separately to demonstrate the different morphological patterns. Specifically, Figure 3 shows the volumetric probability maps for Type I SFS, Figure 4 presents the probability of the anterior ramus (SFS‐a) of the Type II SFS, and Figure 5 shows the probability of the posterior ramus (SFS‐p) of the Type II SFS. The volumetric probability maps are overlaid onto the MNI asymmetric template that was used for registration (Fonov et al., 2011). A series of coronal and horizontal sections are used to demonstrate the spatial extent of the SFS, from its anterior termination to its posterior end, and its dorsal to ventral position, respectively. A grid has been superimposed onto each section to demonstrate the x (medial‐lateral), y (anterior–posterior), and z (dorsal‐ventral) axes. The colour bar in each figure indicates the extent of the overlap of the labelled voxels which have been thresholded to a minimum of 5% for the purpose of illustration.
In Figure 3, the morphological variability and spatial extent of the SFS was quantified for Type I from the 42 hemispheres in which it could be identified (see Morphological Patterns in Results section for description). The volumetric probability map for the Type I SFS demonstrated that the highest probability of belonging to the SFS is common across 16% of left hemispheres, at MNI coordinate x − 25, y + 13, z + 43. The maximum overlap for right hemispheres categorized as Type I SFS was 21%, found at MNI coordinate x + 25, y + 26, z + 38. The spatial variability of the Type II SFS was quantified separately for the anterior and posterior rami of the SFS complex (Figures 4 and 5, respectively), excluding the 16 hemispheres that were deemed to have an irregular or ambiguous merging pattern (see Morphological Patterns in Results for an explanation of the reason for exclusion). Thus, the probability maps for the SFS‐a and SFS‐p were calculated from the 34 and 36 hemispheres, respectively, in which they could be clearly identified. The anterior ramus of the SFS demonstrated a maximum overlap across left hemispheres of 11%, at MNI coordinate x − 20, y + 36, z + 35. Similarly, the maximum probability value for SFS‐a in right hemispheres reached 10%, at MNI coordinate x + 25, y + 27, z + 36 (see Figure 4). The posterior ramus of the SFS showed a maximum probability peak for left hemispheres of 12%, at MNI coordinate x − 21, y + 4, z + 50. For right hemispheres, the SFS‐p showed the highest probability voxel occurring at coordinate x + 21, y + 15, z + 44, with a maximum overlap of 12% (see Figure 5). Table 3 summarizes the MNI152 stereotaxic coordinates found with the highest probability values for the primary morphological patterns.
3.3.2. Surface maps
The surface spatial probability maps represent the likelihood that any vertex on the surface of the brain belongs to the SFS. As with the volumetric maps, separate surface probability maps are presented for each morphological type to demonstrate the different morphological patterns. Figure 6 provides the surface probability maps for Type I SFS, as well as the anterior and posterior rami of the Type II SFS. The data have been overlaid onto the surface template, fsaverage, which was used for registration (Fischl, Sereno, & Dale, 1999; Fischl, Sereno, Tootell, & Dale, 1999). The probability values of these maps are presented by means of a colour bar, indicating the extent of overlap of the labelled vertices and the maps have been thresholded to a minimum of 4% for the purpose of illustration. The coordinates written at the bottom of each probability map indicate the vertex with the maximum overlap in MNI305 stereotaxic space (Evans et al., 1993).
The surface spatial extent of the Type I and Type II SFS is reflected in the surface probability maps shown in Figure 6. For the continuous Type I SFS, the vertex with the highest probability of belonging to the SFS in the left hemisphere was found at MNI coordinate x − 23, y + 23, z + 40, at a maximum probability value of 22% (Figure 6a). For Type I SFS in the right hemisphere, a maximum probability peak of 23% occurred at the MNI coordinate x + 24, y + 17, z + 48 (Figure 6b). Figure 6 also shows the probability for the anterior and posterior rami of the Type II SFS separately. For SFS‐a in the left hemisphere, a maximum overlap of 19% was observed at MNI stereotaxic coordinate x − 26, y + 27, z + 36 (Figure 6c); and in the right hemisphere, a maximum overlap of 14% was found at stereotaxic coordinate x + 25, y + 32, z + 36 (Figure 6d). SFS‐p showed the highest maximum overlap in 20% of left hemispheres at MNI coordinate x − 21, y + 11, z + 52 (Figure 6e), while right hemispheres demonstrated the highest probability vertex at stereotaxic coordinate x + 25, y + 16, z + 46, with a maximum overlap of 21% (Figure 6f). Table 4 summarizes the aforementioned results in MNI305 stereotaxic coordinates.
4. DISCUSSION
The present investigation provided a detailed analysis of the morphology of the SFS, a major sulcus in the human brain that separates the superior from the middle frontal gyrus in the dorsolateral frontal cortex. Fifty MRI volumes (100 hemispheres) were examined to establish the morphological patterns of the SFS. Subsequently, the spatial extent and variability of these patterns were quantified using volumetric and surface spatial probabilistic mapping. The probability maps presented here provide a novel anatomical framework for the accurate reporting and interpreting of the location of functional activity in the dorsolateral frontal cortex and contribute to our understanding of the topography of this sulcus for the improvement of neurosurgical interventions, as well as for the development of precise anatomo‐functional relationships.
4.1. Morphology
Standard criteria were used for the identification of the SFS and following a systematic investigation of MRI sections and visual inspection of cortical surface reconstructions, the SFS was identified in all hemispheres on the lateral surface of the brain. The SFS showed considerable length and depth, terminated caudally near the SPRS, and extended horizontally towards the frontal pole. Two primary morphological patterns were consistently identified across human brains. In Type I, the SFS was classified as a continuous sulcus and in Type II as a discontinuous sulcal complex, consisting of an anterior (SFS‐a) and a posterior (SFS‐p) segment, which were distinctly separate on the surface of the brain or by way of a submerged gyral bridge (i.e., a pli de passage). Both morphological types could be further subdivided based on whether they merged or not with any surrounding frontal sulcus (i.e., Subtypes a and b). The primary morphological patterns, their less frequent patterns, and the incidence of merging with another frontal sulcus are presented in Tables 1 and 2.
The sulcal patterns described in the present investigation are consistent with the morphology depicted in traditional sulcal illustrations of the late 19th and 20th century (see Figure 2; Turner, 1866, 1948; Eberstaller, 1890; Cunningham, 1905; Connolly, 1950). Notably, these early texts emphasized the variability of this sulcus, indicating that it was frequently interrupted by short secondary sulci and comprised of various branches (Cunningham, 1905; Turner, 1866, 1948). Cunningham (1905) reported that the SFS appeared most often as a discontinuous sulcal complex (49.2% in two pieces, 23% in three pieces; see p. 264 in Cunningham, 1905), and highlighted Eberstaller's description of the relationship between the SFS and SPRS posteriorly (p. 263 in Cunningham, 1905). At its anterior termination point, Cunningham illustrated that the SFS merged frequently with a small furrow at the frontal pole (see Figure 53 p. 248 in Cunningham, 1905), with an incidence of 27.8% in the sample (p. 264). This observation is comparable to the present examination that found the SFS merging with the ASFS near the frontal pole in 29% of the hemispheres examined. Further, when describing the variability of the SFS, Cunningham wrote: “The front portion of the sulcus frontalis medius is superficially connected with, and runs in line of, the sulcus frontalis primus. Its place is taken by a secondary transverse sulc[us]” (see Figure 59 p. 262 in Cunningham, 1905). Bailey and Bonin (1951) reached a similar conclusion to that asserted above, stating that “Often (according to Eberstaller in 44 percent) [the SFS] anastomoses with the middle frontal sulcus” (p. 43). The incidence rates presented in Table 2 would suggest that the middle frontal sulcus observed historically to merge with the SFS may be the intermediate ramus of the posterior middle frontal sulcus (PMFS‐i). However, these historical texts were carried out by inspection limited to the surface of brains, which does not allow for an accurate analysis within the depth of sulci that can reveal submerged gyral bridges separating sulci below the surface. Despite these constraints, the morphological descriptions of the SFS from the 19th and early 20th century are consistent with the data reported in the present study in which the SFS is found most consistently as a discontinuous sulcal complex that merges most frequently with the SPRS at its posterior termination point, a middle frontal sulcus (likely the PMFS‐i), and the ASFS near the frontal pole. With a more complete understanding and labelling of the frontal sulci of the cerebral hemispheres (see Figure 1, Petrides, 2012, 2014, 2019), the present investigation elaborates on these patterns and provides a detailed classification of the relations of the SFS with surrounding sulci that was not possible in the older literature.
Similarly, Ono et al. (1990) documented the morphological patterns of sulci on the lateral frontal lobe based on inspection of the surface of cadaver brains. These researchers observed the SFS as a continuous sulcus (40% of right hemispheres, 32% of left hemispheres) or as a sulcal complex consisting of two (52% of right hemispheres, 36% of left hemispheres), three (8% of right hemispheres, 28% of left hemispheres), or four segments (0% of right hemispheres, 4% of left hemispheres) (Figure 8.10 p. 49 in Ono et al., 1990). Importantly, they documented the SFS as a sulcus with a low probability of remaining continuous, that is, it was frequently interrupted by other surrounding sulci (see Figure 3.1 p. 14 in Ono et al., 1990). The posterior ramus of the SFS (SFS‐p) was seen merging with the SPRS in 92% of right and 100% of left hemispheres. They also distinguished two different morphological patterns where the SFS merged with a middle frontal sulcus, depending on which sulcus (the SFS or the middle frontal sulcus) merged first posteriorly. Given that the sulci on the MFG were established much later (Petrides, 2012, 2019), Ono and colleagues could not identify these sulci with as much precision and accuracy as in the present investigation and, thus, it is unclear to which middle frontal sulcus these researchers are referring. Nevertheless, when the incidence rates for the two morphological patterns identified (i.e., the SFS or the middle frontal sulcus merging first posteriorly) are combined, they are similar to the pattern observed in the present investigation when the SFS merges with the PMFS‐i (see Figure 8.14 p. 53 in Ono et al., 1990 in comparison to Table 2 of the present examination).
In a more recent study, Juch et al. (2005) used automatic sulcal labelling to document the variability of cerebral sulci to demonstrate the significance of using individual subject anatomy for the interpretation of functional activity peaks in the frontal lobe. In this report, the SFS was identified in one (61% of left hemispheres, 52% of right hemispheres), two (22% of left hemispheres, 30% of right hemispheres), and three segments (17% of left hemispheres, 9% of right hemispheres), and was also shown to merge with the SPRS at its posterior termination point in 74% of right and 87% of left hemispheres in their sample. Other studies examined sulci on the surface of postmortem brains to define macroanatomical borders for neurosurgical interventions (Gonul et al., 2014; Koutsarnakis et al., 2017; Ribas et al., 2006). In these examinations, the SFS was consistently identified as either a continuous sulcus or discontinuous sulcal complex and its caudal termination point was found to merge most frequently with the SPRS (Gonul et al., 2014; Koutsarnakis et al., 2017; Ribas et al., 2006). Thus, the macrostructural patterns observed in our examination are consistent with those reported previously. The variance in the reported incidence is likely due to differences in the sample size used; for example, Ono et al. (1990) assessed only 25 brains and Koutsarnakis et al. (2017) examined the surface of only 10 brains. Furthermore, the reader is reminded of the methodological limitations of the investigations described above, given that they were conducted on the basis of inspection of the cortical surface of postmortem brains, which can critically limit the ability to interpret the patterns of cortical sulci (Gonul et al., 2014; Koutsarnakis et al., 2017; Ono et al., 1990; Ribas et al., 2006). Nevertheless, the presence of various morphological patterns replicated across different studies highlights the fact that the sulci of the cerebral cortex are more varied than traditional maps would suggest.
4.2. Spatial probability maps
In the present study, the morphological variability and spatial extent of the SFS were quantified using volumetric and surface spatial probabilistic mapping. The reader is reminded that the purpose of presenting both types of probability maps is to offer a thorough evaluation of the location and variability of the sulcus of interest. Volumetric probability maps represent the spatial extent of the SFS along the three axes of MNI stereotaxic space (see Figures 3, 4, 5). Surface spatial probability maps are generated using a surface registration technique that maintains the alignment of cortical folds (Fischl, Sereno, & Dale, 1999; Fischl, Sereno, Tootell, & Dale, 1999). This approach allows each individual surface to be described volumetrically in MNI stereotaxic space given that the individual subject morphology has been aligned to the average surface used for registration (see Figure 6).
A few observations are worth noting when examining the spatial probability maps of both Type I and Type II SFS. Given its morphological description, it is expected that the spatial probability maps for the Type I SFS reveal a longer sulcus in comparison with both the anterior and posterior parts of the Type II SFS. Specifically, the volumetric probability maps for the Type I SFS demonstrate its caudal y‐coordinate similar to that of the posterior ramus of the Type II SFS, while the former continues more anteriorly to a rostral y‐coordinate similar to that of the anterior ramus of the Type II SFS (see Figure 3 and compare with Figures 4 and 5). On the surface spatial probability maps, the anterior and posterior rami comprising the discontinuous morphological pattern clearly lie in more anterior or posterior positions, respectively, on the surface of the cortex (see Figure 6a,b and compare with Figure 6c–f). The coronal sections of the Type II SFS volumetric maps demonstrate an interesting trend. When the SFS is found as a discontinuous sulcal complex, the volumetric maps show that the posterior ramus of the SFS (see Figure 5) extends more caudally in left hemispheres, whereas the anterior segment of the SFS (see Figure 4) extends more posteriorly in right hemispheres. This may reflect Yakovlevian anti‐clockwise torque, which posits the expansion of cortex along the Sylvian fissure in left hemispheres because of the evolutionary development of language areas, pushing the interhemispheric fissure and structures of the right hemispheres towards the right (Drudik et al., 2023; LeMay, 1976; Toga & Thompson, 2016). In addition, the surface spatial probability maps for the Type I SFS reveal a leaner shape, which could reflect (a) its lower frequency of merging with surrounding sulci or (b) its maintenance of a more consistent position within the dorsal frontal cortex in comparison with Type II SFS (see Table 1 and Figure 6).
The SFS is defined as a primary sulcus, in the sense that it develops early during gestation by comparison to secondary and tertiary sulci and, thus, should follow a more predictable interindividual pattern (Armstrong et al., 1995; Tamraz & Comair, 2006). As expected, the spatial probability maps show that voxels with the greatest probability of belonging to the SFS are comparable for left and right hemispheres and across morphological types (Figures 3, 4, 5, 6). Interestingly, the probability maps also reveal that the location of the SFS shows variability across subjects, which may result from its high likelihood of merging with a surrounding frontal sulcus (see Tables 1 and 2, and maximum probability values in Figures 3, 4, 5, 6). Previous qualitative analyses of the SFS have consistently described the morphological variations of this sulcus (see Section 4.1), particularly in comparison to the classic sulcal maps (see Figure 2; Eberstaller, 1890; Cunningham, 1905; Bailey & Bonin, 1951; Connolly, 1950; Ono et al., 1990; Juch et al., 2005; Ribas et al., 2006; Gonul et al., 2014). This inter‐individual morphological variability is significant given that it is maintained despite linear registration of brains to the axes of MNI standard stereotaxic space for morphological analyses (Drudik et al., 2023; Sprung‐Much & Petrides, 2018, 2020; Zlatkina et al., 2022). Inspection of the volumetric probability maps reveals that the anterior and posterior ends of the SFS occur at around the same z‐coordinates in both hemispheres, and overlap closely with the depiction of the SFS in the average brain represented in MNI standard stereotaxic space that was used for registration (see Figures 3, 4, 5). This would suggest that the spatial probability maps presented here detect the high intersubject variability and high likelihood of the SFS merging with a surrounding frontal sulcus, while simultaneously revealing how the average brain cannot capture the complex morphological patterns at an individual subject level. This fact can, in part, explain the inconsistency across results from functional neuroimaging studies, which usually represent data as a group coordinate projected onto the average cortical surface and cannot resolve distinct cortical regions that are close to each other in space, but differ in functional processing (Amiez et al., 2006). Taken together, this reasoning implies that in order to establish accurate structure‐to‐function relationships, functional activation peaks should be presented in relation to individual subject sulcal and gyral morphology to account for all the features of a sulcus that may act as a functional landmark (Amiez et al., 2006, 2008; Amiez & Petrides, 2018; Juch et al., 2005; Luna et al., 1998; Rubenstein & Rakic, 1999; Tomaiuolo & Giordano, 2016; Zlatkina et al., 2016, 2022).
4.3. Anatomo‐functional relationships using sulci as morphological landmarks
A plethora of research has demonstrated that the gross morphological patterns of cortical folding can act as landmarks that reliably identify the borders between certain cytoarchitectonic and functional areas (Amiez et al., 2006; Amiez & Petrides, 2018; Brodmann, 1909; Fischl et al., 2007; Fischl, Sereno, Tootell, & Dale, 1999; Petrides & Pandya, 1994; Segal & Petrides, 2013). Thus, detailed examinations of sulcal morphology are necessary to improve the localization of functional activity to specific anatomical boundaries and establish accurate structure‐to‐function relationships, as well as to improve in‐vivo fiber‐tract dissection using DTI approaches, which should rely on accurate anatomical landmarks and gold‐standard non‐human primate cortico‐cortical connectivity research to map accurately human brain connectivity.
In the caudal dorsolateral frontal cortex, the SFS is the morphological boundary between two cytoarchitectonic areas, namely 8A and 8B (Petrides & Pandya, 1999). These areas are defined based on their differing pattern of cellular architecture and unique cortico‐cortical connectivity, which implicate each area in different aspects of cognitive function. In their parcellation of the frontal cortex, Petrides and Pandya (1999) demonstrated that area 8A, which occupies the MFG, is a distinctly granular area with a well‐developed layer IV with direct connectivity to higher order visual and auditory association cortex. By contrast, area 8B, found on the SFG, has a poorly developed layer IV, with inputs from the visuospatial parieto‐occipital region and multimodal superior temporal sulcus (area TPO). Interestingly, both area 8A and area 8B show connectivity to the multimodal parietal cortex involved in spatial processing (Petrides & Pandya, 1999). This anatomical evidence suggests that granular area 8A is involved in high‐level cognitive processing of multisensory information, while the dysgranular area 8B may act as a transition zone between agranular premotor and granular frontal cortex; both these areas are involved in the processing of spatial information from convergent sensory regions within the caudal parietal cortex. In accordance with this point of view, there is strong evidence that the caudal dorsolateral frontal cortex, where area 8A is found, is essential for the high‐level allocation of attention and selection between competing responses based on conditional operations, specifically depending on the corresponding effector and their distinct connections to other frontal areas and posterior association cortex (Amiez & Petrides, 2018; Germann & Petrides, 2020a, 2020b; Petrides, 1987, 2005a, 2005b). Although the exact function of area 8B has yet to be established, its dysgranular cellular architecture would suggest involvement in aspects of more automatic re‐orienting to visuospatial information (Lanzilotto et al., 2013; Petrides & Pandya, 1999).
The general relation between structure and function can be obtained by relating functional activation peaks to sulcal landmarks (Amiez et al., 2006; Amiez & Petrides, 2018; Germann & Petrides, 2020a, 2020b; Huntgeburth et al., 2017; Segal & Petrides, 2013; Zlatkina et al., 2022). In Figure 7, we illustrate the location of functional activity peaks in individual subjects reported by Amiez and Petrides (2018) in a functional magnetic resonance imaging (fMRI) study that examined basic saccadic eye or hand actions, as well as cognitive selection between competing hand or eye movements based on previously learned conditional relations (i.e., if instruction stimulus A is presented, select movement X; but if instruction stimulus B is presented, select movement Y). In Figure 7, we have overlaid onto the Type I SFS volumetric probability map some significant functional activity peaks reported in the Amiez and Petrides (2018) investigation. These peaks represent the location of activity related to the conditional selection of saccadic eye (see blue dots) and hand movements (see pink dots), as well as basic eye and hand movements (see green and yellow dots, respectively). The reader can see in Figure 7 that the coordinates representing functional activity in the cognitive conditional selection of a particular movement (i.e., blue and pink dots for cognitive selection of eye and hand movements) are consistently located within the SFS, anterior to the activity representing the control of their basic effectors (i.e., green and yellow dots for execution of basic eye and hand movements). These results demonstrate that the SFS acts as an important functional landmark that distinguishes activity peaks between functional areas reflecting the hierarchical organization of action control (Amiez & Petrides, 2018). Thus, the spatial probability maps provided by the present examination have the potential to reveal new links between the morphological features of the SFS and differing functional processes in the cortex which surrounds it.
FIGURE 7.

The position of the Type I superior frontal sulcus (SFS) of the left hemisphere with the significant functional activity peaks reported in Amiez and Petrides (2018). The peaks representing the location of activity related to the higher order conditional selection of saccadic eye and hand movements are shown by the blue and pink dots, respectively. By contrast, the location of functional activity related to the performance of basic eye and hand movements are shown by the green and yellow dots, respectively. The reader can see that the coordinates representing functional activity in the cognitive conditional selection of a particular movement (i.e., blue and pink dots) are consistently located anterior to the activity representing the control of their basic effectors (i.e., green and yellow dots). The volumetric probability maps presented for the SFS can aid in establishing accurate structure‐to‐function relationships in the dorsolateral frontal cortex. The x, y, z coordinates of the peaks are in MNI152 stereotaxic space.
4.4. Applications
Sulci and gyri represent the primary neuroanatomical landmarks used during neurosurgical interventions, such as tumour and focal cortical dysplasia (FCD) resections (Ribas et al., 2006; Tomaiuolo & Giordano, 2016). The SFS is considered a common site of frontal lobe epilepsy associated with FCD, an abnormal development of cortical tissue within the depth of the sulcus (McGonigal, 2022; Najm et al., 2014; Xu et al., 2023; Zhang et al., 2019). When the epileptic abnormality is drug‐resistant, a common treatment is surgical resection and research demonstrates the feasibility of using a trans‐sulcal approach, which dissects through the sulcus instead of the gyrus to reduce cortical damage (Sampath et al., 2014; Wagstyl et al., 2022; Yasargil, 1994, 1996a, 1996b; Yasargil & Abdulrauf, 2008). Specifically, the superior frontal trans‐sulcal trans‐ventricular approach dissects through the SFS as it provides an intrinsic microsurgical corridor to the lateral ventricle and the foramen of Monro for the resection of epileptic tissue or tumour removal (Harkey et al., 1989; Ono et al., 1990; Ribas, 2010; Ribas et al., 2006). However, given the vasculature found deep within sulci, trans‐sulcal techniques require precise surgical planning and skill to reduce postoperative injury (Koutsarnakis et al., 2017; Ribas et al., 2006). Furthermore, there is yet to be a consensus on the best entry point along the SFS to reduce injury to underlying white matter tracts (Chakravarthi et al., 2019; Kassam et al., 2020). Although research shows that trans‐sulcal approaches provide a shorter passage to the ventricles or deeper lesions and improved surgical outcomes, the use of this technique is often dependent on a patient's specific cortical morphology (Khoo et al., 2022; Koutsarnakis et al., 2017; McGonigal, 2022; Sampath et al., 2014; Simasathien et al., 2013). Some studies have presented the basic morphological patterns of the SFS to provide insight into this surgical pathway (Gonul et al., 2014; Koutsarnakis et al., 2017; Ribas et al., 2006; Sampath et al., 2014). However, these examinations are often incomplete as they do not provide detailed morphological descriptions of both the anterior and posterior rami of the SFS and focus primarily on the merging of the SFS to SPRS as a surgical landmark. In addition, these analyses are often limited by examining the morphology on the surface of postmortem brains. The morphological descriptions and spatial probability maps presented here have the potential to facilitate preoperative planning, as well as reduce costs for intra‐operative brain scans (Tomaiuolo & Giordano, 2016; Wang & Song, 2011).
The results of the present study will aid functional neuroimaging research investigating activity peaks found in the cortex around and within the SFS. In defining consistent morphological patterns of the SFS, as well as providing access to both volumetric and surface spatial probability maps (10.5061/dryad.6wwpzgn4x), the results can be used to improve the anatomical interpretation of functional activity with the aim of improving our understanding of structure‐to‐function relationships in the human cerebral cortex.
FUNDING INFORMATION
Canadian Institutes of Health Research (CIHR) Foundation Grant (FDN‐143212) awarded to Michael Petrides and a scholarship from Fonds de recherche du Québec–Santé (FRQS) awarded to Kristina Drudik.
CONFLICT OF INTEREST STATEMENT
The authors declare no conflict of interest.
ACKNOWLEDGEMENTS
We thank Michelle Xu for her assistance with the labelling of the superior frontal sulcus in MRI volumes.
Drudik, K. , & Petrides, M. (2024). The superior frontal sulcus in the human brain: Morphology and probability maps. Human Brain Mapping, 45(5), e26635. 10.1002/hbm.26635
DATA AVAILABILITY STATEMENT
The data that support the findings of this study are openly available in Dryad database at https://doi.org/10.5061/dryad.6wwpzgn4x.
REFERENCES
- Ad‐Dab'bagh, Y. , Einarson, D. , Lyttelton, O. , Muehlboeck, J.‐S. , Mok, K. , Ivanov, O. , Vincent, R. D. , Lepage, C. , Lerch, J. , Fombonne, E. , & Evans, A. C. (2006). The CIVET image‐processing environment: A fully automated comprehensive pipeline for anatomical neuroimaging research. In Proceedings of the 12th Annual Meeting of the Organization for Human Brain Mapping, M. Corbetta, ed. (Florence, Italy, NeuroImage). http://www.bic.mni.mcgill.ca/users/yaddab/Yasser-HBM2006-Poster.pd
- Amiez, C. , Kostopoulos, P. , Champod, A.‐S. , Collins, D. L. , Doyon, J. , Maestro, R. D. , & Petrides, M. (2008). Preoperative functional magnetic resonance imaging assessment of higher‐order cognitive function in patients undergoing surgery for brain tumors. Journal of Neurosurgery, 108(2), 258–268. [DOI] [PubMed] [Google Scholar]
- Amiez, C. , Kostopoulos, P. , Champod, A.‐S. , & Petrides, M. (2006). Local morphology predicts functional organization of the dorsal premotor region in the human brain. Journal of Neuroscience, 26(10), 2724–2731. [DOI] [PMC free article] [PubMed] [Google Scholar]
- Amiez, C. , Neveu, R. , Warrot, D. , Petrides, M. , Knoblauch, K. , & Procyk, E. (2013). The location of feedback‐related activity in the midcingulate cortex is predicted by local morphology. Journal of Neuroscience, 33(5), 2217–2228. [DOI] [PMC free article] [PubMed] [Google Scholar]
- Amiez, C. , & Petrides, M. (2018). Functional rostro‐caudal gradient in the human posterior lateral frontal cortex. Brain Structure and Function, 223(3), 1487–1499. [DOI] [PubMed] [Google Scholar]
- Armstrong, E. , Schleicher, A. , Omran, H. , Curtis, M. , & Zilles, K. (1995). The ontogeny of human gyrification. Cerebral Cortex, 5(1), 56–63. [DOI] [PubMed] [Google Scholar]
- Bailey, P. , & Bonin, G. (1951). The isocortex of man. University of Illinois Press. [Google Scholar]
- Barbeau, E. , Descoteaux, M. , & Petrides, M. (2020). Dissociating the white matter tracts connecting the temporo‐parietal cortical region with frontal cortex using diffusion tractography. Scientific Reports, 10, 8186. [DOI] [PMC free article] [PubMed] [Google Scholar]
- Brodmann, K. (1903). Beitraege zur histologischen Lokalisation der Grosshirnrinde. II. Der Calcarinustyp. Journal für Psychologie und Neurologie, 2, 133–159. [Google Scholar]
- Brodmann, K. (1908). Beitraege zur histologischen Lokalisation der Grosshirnrinde. VI. Mitteilung: Die Cortexgliederung des Menschen. Journal für Psychologie und Neurologie, 10, 231–246. [Google Scholar]
- Brodmann, K. (1909). Vergleichende Lokalisationslehre der Grosshirnrinde in ihren Prinzipien dargestellt auf Grund des Zellenbaues. Barth.
- Chakravarthi, S. S. , Kassam, A. B. , Fukui, M. B. , Monroy‐Sosa, A. , Rothong, N. , Cunningham, J. , Jennings, J. E. , Guenther, N. , Connelly, J. , Kaemmerer, T. , Nash, K. C. , Lindsay, M. , Rissell, J. , Celix, J. M. , & Rovin, R. A. (2019). Awake surgical management of third ventricular tumors: A preliminary safety, feasibility, and clinical applications study. Operative Neurosurgery, 17(2), 208–226. [DOI] [PubMed] [Google Scholar]
- Collins, D. L. , Neelin, P. , Peters, T. M. , & Evans, A. C. (1994). Automatic 3D intersubject registration of MR volumetric data in standardized Talairach space. Journal of Computer Assisted Tomography, 18(2), 192–205. [PubMed] [Google Scholar]
- Connolly, C. J. (1941). The fissural pattern in the brain of negroes and whites. The frontal lobes. American Journal of Physical Anthropology, 28(2), 133–165. [Google Scholar]
- Connolly, C. J. (1950). External morphology of the primate brain. Charles C Thomas. [Google Scholar]
- Cunningham, D. J. (1892). Contribution to the surface anatomy of the cerebral hemispheres. The Academy House. [Google Scholar]
- Cunningham, D. J. (1905). Textbook of anatomy. W. Wood and Company. [Google Scholar]
- Dale, A. M. , Fischl, B. , & Sereno, M. I. (1999). Cortical surface‐based analysis: I. Segmentation and surface reconstruction. NeuroImage, 9(2), 179–194. [DOI] [PubMed] [Google Scholar]
- Drudik, K. , Zlatkina, V. , & Petrides, M. (2023). Morphological patterns and spatial probability maps of the superior parietal sulcus in the human brain. Cerebral Cortex, 33(4), 1230–1245. [DOI] [PMC free article] [PubMed] [Google Scholar]
- Eberstaller, O. (1890). Das Stirnhirn. Urban & Schwarzenberg. [Google Scholar]
- Economo, C. F. , & Koskinas, G. N. (1925). Die Cytoarchitektonik der Hirnrinde des erwachsenen Menschen. Springer. [Google Scholar]
- Evans, A. C. , Collins, D. L. , Mills, S. R. , Brown, E. D. , Kelly, R. L. , & Peters, T. M. (1993). 3D statistical neuroanatomical models from 305 MRI volumes. 1993 IEEE Conference Record Nuclear Science Symposium and Medical Imaging Conference, 1813–1817.
- Fischl, B. , Rajendran, N. , Busa, E. , Augustinack, J. , Hinds, O. , Yeo, B. T. T. , Mohlberg, H. , Amunts, K. , & Zilles, K. (2007). Cortical folding patterns and predicting cytoarchitecture. Cerebral Cortex, 18(8), 1973–1980. [DOI] [PMC free article] [PubMed] [Google Scholar]
- Fischl, B. , Sereno, M. I. , & Dale, A. M. (1999). Cortical surface‐based analysis: II: Inflation, flattening, and a surface‐based coordinate system. NeuroImage, 9(2), 195–207. [DOI] [PubMed] [Google Scholar]
- Fischl, B. , Sereno, M. I. , Tootell, R. B. H. , & Dale, A. M. (1999). High‐resolution intersubject averaging and a coordinate system for the cortical surface. Human Brain Mapping, 8(4), 272–284. [DOI] [PMC free article] [PubMed] [Google Scholar]
- Fonov, V. , Evans, A. C. , Botteron, K. , Almli, C. R. , McKinstry, R. C. , & Collins, D. L. (2011). Unbiased average age‐appropriate atlases for pediatric studies. NeuroImage, 54(1), 313–327. [DOI] [PMC free article] [PubMed] [Google Scholar]
- Germann, J. , & Petrides, M. (2020a). The ventral part of dorsolateral frontal area 8A regulates visual attentional selection and the dorsal part auditory attentional selection. Neuroscience, 441, 209–216. [DOI] [PubMed] [Google Scholar]
- Germann, J. , & Petrides, M. (2020b). Area 8A within the posterior middle frontal gyrus underlies cognitive selection between competing visual targets. eNeuro, 7(5), 1–12. [DOI] [PMC free article] [PubMed] [Google Scholar]
- Glasser, M. F. , Sotiropoulos, S. N. , Wilson, J. A. , Coalson, T. S. , Fischl, B. , Andersson, J. L. , Xu, J. , Jbabdi, S. , Webster, M. , Polimeni, J. R. , Van Essen, D. C. , & Jenkinson, M. (2013). The minimal preprocessing pipelines for the human connectome project. NeuroImage, 80, 105–124. [DOI] [PMC free article] [PubMed] [Google Scholar]
- Gonul, Y. , Songur, A. , Uzun, I. , Uygur, R. , Alkoc, O. A. , Caglar, V. , & Kucuker, H. (2014). Morphometry, asymmetry and variations of cerebral sulci on superolateral surface of cerebrum in autopsy cases. Surgical and Radiologic Anatomy, 36(7), 651–661. [DOI] [PubMed] [Google Scholar]
- Harkey, H. , Al‐Mefty, O. , Haines, D. , & Smith, R. (1989). The surgical anatomy of the cerebral sulci. Neurosurgery, 24, 651–654. [DOI] [PubMed] [Google Scholar]
- Huntgeburth, S. C. , Chen, J.‐K. , Ptito, A. , & Petrides, M. (2017). Local morphology informs location of activation during navigation within the parahippocampal region of the human brain. Brain Structure and Function, 222(4), 1581–1596. [DOI] [PubMed] [Google Scholar]
- Jenkinson, M. , Bannister, P. , Brady, M. , & Smith, S. (2002). Improved optimization for the robust and accurate linear registration and motion correction of brain images. NeuroImage, 17(2), 825–841. [DOI] [PubMed] [Google Scholar]
- Jenkinson, M. , & Smith, S. (2001). A global optimisation method for robust affine registration of brain images. Medical Image Analysis, 5(2), 143–156. [DOI] [PubMed] [Google Scholar]
- Jovicich, J. , Czanner, S. , Greve, D. , Haley, E. , van der Kouwe, A. , Gollub, R. , Kennedy, D. , Schmitt, F. , Brown, G. , MacFall, J. , Fischl, B. , & Dale, A. (2006). Reliability in multi‐site structural MRI studies: Effects of gradient non‐linearity correction on phantom and human data. NeuroImage, 30(2), 436–443. [DOI] [PubMed] [Google Scholar]
- Juch, H. , Zimine, I. , Seghier, M. L. , Lazeyras, F. , & Fasel, J. H. D. (2005). Anatomical variability of the lateral frontal lobe surface: Implication for intersubject variability in language neuroimaging. NeuroImage, 24(2), 504–514. [DOI] [PubMed] [Google Scholar]
- Kassam, A. B. , Monroy‐Sosa, A. , Fukui, M. B. , Kura, B. , Jennings, J. E. , Celix, J. M. , Nash, K. C. , Kassam, M. , Rovin, R. A. , & Chakravarthi, S. S. (2020). White matter governed superior frontal sulcus surgical paradigm: A radioanatomic microsurgical study—Part II. Operative Neurosurgery, 19(4), E357–E369. [DOI] [PubMed] [Google Scholar]
- Khoo, A. , de Tisi, J. , Foong, J. , Bindman, D. , O'Keeffe, A. G. , Sander, J. W. , Miserocchi, A. , McEvoy, A. W. , & Duncan, J. S. (2022). Long‐term seizure, psychiatric and socioeconomic outcomes after frontal lobe epilepsy surgery. Epilepsy Research, 186, 1–8. [DOI] [PubMed] [Google Scholar]
- Koutsarnakis, C. , Liakos, F. , Kalyvas, A. V. , Skandalakis, G. P. , Komaitis, S. , Christidi, F. , Karavasilis, E. , Liouta, E. , & Stranjalis, G. (2017). The superior frontal transsulcal approach to the anterior ventricular system: Exploring the sulcal and subcortical anatomy using anatomic dissections and diffusion tensor imaging tractography. World Neurosurgery, 106, 339–354. [DOI] [PubMed] [Google Scholar]
- Lanzilotto, M. , Perciavalle, V. , & Lucchetti, C. (2013). A new field in monkey's frontal cortex: Premotor ear‐eye field (PEEF). Neuroscience & Biobehavioral Reviews, 37(8), 1434–1444. [DOI] [PubMed] [Google Scholar]
- LeMay, M. (1976). Morphological cerebral asymmetries of modern man, fossil man, and nonhuman primate. Annals of New York Academy of Science, 280, 349–366. [DOI] [PubMed] [Google Scholar]
- Luna, B. , Thulborn, K. R. , Strojwas, M. H. , McCurtain, B. J. , Berman, R. A. , Genovese, C. R. , & Sweeney, J. A. (1998). Dorsal cortical regions subserving visually guided saccades in humans: An fMRI study. Cerebral Cortex, 8(1), 40–47. [DOI] [PubMed] [Google Scholar]
- MacDonald, D. (1996). Program for display and segmentation of surfaces and volumes [Computer software]. McConnell Brain Imaging Centre, Montreal Neurological Institute. http://www.bic.mni.mcgill.ca
- Maier‐Hein, K. H. , Neher, P. F. , Houde, J. C. , Côté, M. A. , Garyfallidis, E. , Zhong, J. , Chamberland, M. , Yeh, F. C. , Lin, Y. C. , Ji, Q. , Reddick, W. E. , Glass, J. O. , Chen, D. Q. , Feng, Y. , Gao, C. , Wu, Y. , Ma, J. , He, R. , Li, Q. , … Descoteaux, M. (2017). The challenge of mapping the human connectome based on diffusion tractography. Nature Communications, 8(1), 1349. [DOI] [PMC free article] [PubMed] [Google Scholar]
- McGonigal, A. (2022). Frontal lobe seizures: Overview and update. Journal of Neurology, 269(6), 3363–3371. [DOI] [PubMed] [Google Scholar]
- Najm, I. , Tassi, L. , Sarnat, H. , Holthausen, H. , & Russo, G. (2014). Epilepsies associated with focal cortical dysplasias (FCDs). Acta Neuropathologica, 128, 5–19. [DOI] [PubMed] [Google Scholar]
- Ono, M. M. D. , Kubik, S. , & Abernathey, C. D. (1990). Atlas of the cerebral sulci. G. Thieme Verlag. [Google Scholar]
- Petrides, M. (1985a). Deficits on conditional associative‐learning tasks after frontal‐ and temporal‐lobe lesions in man. Neuropsychologia, 23(5), 601–614. [DOI] [PubMed] [Google Scholar]
- Petrides, M. (1985b). Deficits in non‐spatial conditional associative learning after periarcuate lesions in the monkey. Behavioural Brain Research, 16(2), 95–101. [DOI] [PubMed] [Google Scholar]
- Petrides, M. (1987). Conditional learning and the primate frontal cortex. In The frontal lobes revisited (pp. 91–108). The IRBN Press. [Google Scholar]
- Petrides, M. (1990). Nonspatial conditional learning impaired in patients with unilateral frontal but not unilateral temporal lobe excisions. Neuropsychologia, 28(2), 137–149. [DOI] [PubMed] [Google Scholar]
- Petrides, M. (2005a). The rostral‐caudal axis of cognitive control within the lateral frontal cortex. In From monkey brain to human brain (pp. 293–314). MIT Press. [Google Scholar]
- Petrides, M. (2005b). Lateral prefrontal cortex: Architectonic and functional organization. Philosophical Transactions of the Royal Society B: Biological Sciences, 360(1456), 781–795. [DOI] [PMC free article] [PubMed] [Google Scholar]
- Petrides, M. (2012). The human cerebral cortex: An MRI atlas of the sulci and gyri in MNI stereotaxic space. Elsevier Academic. [Google Scholar]
- Petrides, M. (2014). Neuroanatomy of language regions of the human brain. Academic Press. [Google Scholar]
- Petrides, M. (2019). Atlas of the morphology of the human cerebral cortex on the average MNI brain. Elsevier Academic. [Google Scholar]
- Petrides, M. , & Pandya, D. N. (1994). Comparative architectonic analysis of the human and the macaque frontal cortex. Handbook of Neuropsychology, 9, 17–58. [Google Scholar]
- Petrides, M. , & Pandya, D. N. (1999). Dorsolateral prefrontal cortex: Comparative cytoarchitectonic analysis in the human and the macaque brain and corticocortical connection patterns. European Journal of Neuroscience, 11(3), 1011–1036. [DOI] [PubMed] [Google Scholar]
- Ribas, G. C. (2010). The cerebral sulci and gyri. Neurosurgical Focus, 28(2), E2. [DOI] [PubMed] [Google Scholar]
- Ribas, G. C. , Yasuda, A. , Ribas, E. C. , Nishikuni, K. , & Rodrigues, A. J. J. (2006). Surgical anatomy of microneurosurgical sulcal key points. Operative . Neurosurgery, 59(4 Suppl 2), ONS177–ONS211. [DOI] [PubMed] [Google Scholar]
- Rubenstein, J. L. R. , & Rakic, P. (1999). Genetic control of cortical development. Cerebral Cortex, 9(6), 521–523. [DOI] [PubMed] [Google Scholar]
- Sampath, R. , Katira, K. , Vannemreddy, P. , & Nanda, A. (2014). Quantifying sulcal and gyral topography in relation to deep seated and ventricular lesions: Cadaveric study for basing surgical approaches and review of literature. British Journal of Neurosurgery, 28(6), 713–716. [DOI] [PubMed] [Google Scholar]
- Sarkissov, S. A. , Filimonoff, I. N. , Kononowa, E. P. , Preobraschenskaja, I. S. , & Kukuew, L. A. (1955). Atlas of the cytoarchitectonics of the human cerebral cortex. Medgiz. [Google Scholar]
- Segal, E. , & Petrides, M. (2013). Functional activation during reading in relation to the sulci of the angular gyrus region. European Journal of Neuroscience, 38(5), 2793–2801. [DOI] [PubMed] [Google Scholar]
- Sherif, T. , Rioux, P. , Rousseau, M.‐E. , Kassis, N. , Beck, N. , Adalat, R. , Das, S. , Glatard, T. , & Evans, A. C. (2014). CBRAIN: A web‐based, distributed computing platform for collaborative neuroimaging research. Frontiers in Neuroinformation, 8, 54. [DOI] [PMC free article] [PubMed] [Google Scholar]
- Simasathien, T. , Vadera, S. , Najm, I. , Gupta, A. , Bingaman, W. , & Jehi, L. (2013). Improved outcomes with earlier surgery for intractable frontal lobe epilepsy. Annals of Neurology, 73(5), 646–654. [DOI] [PubMed] [Google Scholar]
- Sprung‐Much, T. , & Petrides, M. (2018). Morphological patterns and spatial probability maps of two defining sulci of the posterior ventrolateral frontal cortex of the human brain: The sulcus diagonalis and the anterior ascending ramus of the lateral fissure. Brain Structure and Function, 223(9), 4125–4152. [DOI] [PubMed] [Google Scholar]
- Sprung‐Much, T. , & Petrides, M. (2020). Morphology and spatial probability maps of the horizontal ascending ramus of the lateral fissure. Cerebral Cortex, 30(3), 1586–1602. [DOI] [PMC free article] [PubMed] [Google Scholar]
- Tamraz, J. , & Comair, Y. (2006). Atlas of regional anatomy of the brain using MRI: With functional correlations. Springer Science & Business Media. [Google Scholar]
- Toga, A. W. , & Thompson, P. M. (2016). Mapping brain asymmetry. Nature Reviews Neuroscience, 4, 37–48. [DOI] [PubMed] [Google Scholar]
- Tomaiuolo, F. , & Giordano, F. (2016). Cerebal sulci and gyri are intrinsic landmarks for brain navigation in individual subjects: An instrument to assist neurosurgeons in preserving cognitive function in brain tumour surgery (Commentary on Zlatkina et al.). European Journal of Neuroscience, 43(10), 1266–1267. [DOI] [PubMed] [Google Scholar]
- Turner, O. A. (1948). Growth and development of the cerebral cortical pattern in man. Archives of Neurology and Psychiatry, 59, 1–15. [DOI] [PubMed] [Google Scholar]
- Turner, W. (1866). The convolutions of the human cerebrum topographically considered. Maclachlan & Stewart. [PMC free article] [PubMed] [Google Scholar]
- Vincent, R. D. , Buckthought, A. , & MacDonald, D. (2016). Display 2.0: Software for visualization and segmentation of surfaces and volumes [Computer software]. McConnell Brain Imaging Centre, Montreal Neurological Institute.
- Wagstyl, K. , Whitaker, K. , Raznahan, A. , Seidlitz, J. , Vértes, P. E. , Foldes, S. , Humphreys, Z. , Hu, W. , Mo, J. , Likeman, M. , Davies, S. , Lenge, M. , Cohen, N. T. , Tang, Y. , Wang, S. , Ripart, M. , Chari, A. , Tisdall, M. , Bargallo, N. , & Adler, S. (2022). Atlas of lesion locations and postsurgical seizure freedom in focal cortical dysplasia: A MELD study. Epilepsia, 63(1), 61–74. [DOI] [PMC free article] [PubMed] [Google Scholar]
- Wang, M. N. , & Song, Z. J. (2011). Classification and analysis of the errors in neuronavigation. Neurosurgery, 68(4), 1131–1143. [DOI] [PubMed] [Google Scholar]
- Xu, Y. , Hu, W.‐H. , Shao, X.‐Q. , Ma, Y.‐S. , Lou, L. , Zhang, K. , & Zhang, J.‐G. (2023). Long‐term seizure outcome with the surgically remediable syndrome of frontal lobe epilepsy associated with superior frontal sulcus‐related dysplasia. Frontiers in Neurology, 14, 1–10. [DOI] [PMC free article] [PubMed] [Google Scholar]
- Yasargil, M. (1994). Microneurosurgery (Vol. IVA). Georg Thieme. [Google Scholar]
- Yasargil, M. (1996a). Microneurosurgery: Microneurosurgery of CNS tumors (Vol. IVB). Georg Thieme. [Google Scholar]
- Yasargil, M. (1996b). Microneurosurgery (Vol. IVB). Georg Thieme. [Google Scholar]
- Yasargil, M. , & Abdulrauf, S. (2008). Surgery of intraventricular tumors. Neurosurgery, 62, 1029–1040. [DOI] [PubMed] [Google Scholar]
- Zhang, C. , Zhao, B. , McGonigal, A. , Hu, W. , Wang, X. , Shao, X. , Ma, Y. , Zhang, J. , & Zhang, K. (2019). Superior frontal sulcus focal cortical dysplasia type II: An MRI, PET, and quantified SEEG study. Frontiers in Neurology, 10, 106998. [DOI] [PMC free article] [PubMed] [Google Scholar]
- Zhang, Z. , Hou, Z. , Lin, X. , Teng, G. , Meng, H. , Zang, F. , Fang, F. , & Liu, S. (2013). Development of the fetal cerebral cortex in the second trimester: Assessment with 7T postmortem MR imaging. American Journal of Neuroradiology, 34(7), 1462–1467. [DOI] [PMC free article] [PubMed] [Google Scholar]
- Zilles, K. , & Amunts, K. (2012). Architecture of the cerebral cortex. In Mai J. K. & Paxinos G. (Eds.), The human nervous system (3rd ed., pp. 836–895). Academic Press. [Google Scholar]
- Zlatkina, V. , Amiez, C. , & Petrides, M. (2016). The postcentral sulcal complex and the transverse postcentral sulcus and their relation to sensorimotor functional organization. European Journal of Neuroscience, 43(10), 1268–1283. [DOI] [PubMed] [Google Scholar]
- Zlatkina, V. , Sprung‐Much, T. , & Petrides, M. (2022). Spatial probability maps of the segments of the postcentral sulcus in the human brain. Cerebral Cortex, 32(17), 3651–3668. [DOI] [PMC free article] [PubMed] [Google Scholar]
Associated Data
This section collects any data citations, data availability statements, or supplementary materials included in this article.
Data Availability Statement
The data that support the findings of this study are openly available in Dryad database at https://doi.org/10.5061/dryad.6wwpzgn4x.