Abstract
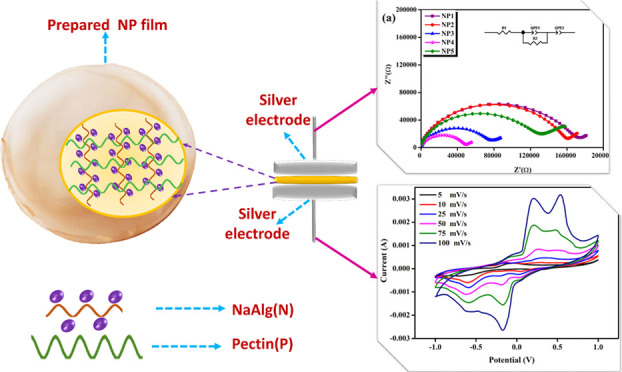
The world needs sustainable energy resources with affordable, economic, and accountable sources. Consequently, energy innovation technologies are evolving toward electrochemical applications like batteries, supercapacitors, etc. The current study involves the solid blend biopolymer electrolyte (SBBE) with different compositions of sodium alginate blended with pectin via the casting technique. The characterization of the sample was tested by X-ray diffraction (XRD), Fourier transform infrared (FTIR) spectroscopy, AC impedance, linear sweep voltammetry (LSV), and cyclic voltammetry (CV) analyses. Evidently, the sample NP4 (NaAlg/pectin = 60:40 wt %) has a higher conductivity of 1.26 × 10⁻⁷ and 3.25 × 10⁻⁶ S cm–1 at 303 and 353 K, respectively. The performances of the samples were analyzed with variations in temperature, frequency, and time responses to signify the blended nature of the electrolyte. Hence, the studied biopolymers can be constructed for electrochemical device applications.
1. Introduction
Sustainable energy resources (SERs) are a unique step toward the development of energy innovation technologies in the current generation. Most researchers are focused on battery applications, wherein polymer electrolytes have the potential to reduce energy consumption in various applications, particularly in energy storage needs.
A solid polymer electrolyte (SPE) is a type of electrolyte material that is used in solid-state batteries. It is typically composed of a polymer matrix blended with an ionic salt and a plasticizer to enhance its ionic conductivity. The polymer matrix can be either a homopolymer or a copolymer and is usually chosen based on its high thermal stability and mechanical strength. The ionic salt used in an SPE is typically a lithium salt, such as lithium perchlorate or lithium triflate, which dissociates in the polymer matrix to provide lithium ions for the battery. The plasticizer, on the other hand, is added to the electrolyte to improve its flexibility and enhance the mobility of the lithium ions. SPEs have several advantages over liquid electrolytes, including improved safety and stability, a higher energy density, and a longer cycle life.1 They also have the potential to be used in a wider range of battery chemistries, including lithium–air, lithium–sulfur, and lithium-ion batteries. However, there are also some challenges associated with SPEs, such as their relatively low ionic conductivity and the need for careful control of the polymer matrix composition and processing conditions to optimize their properties.2−4
Due to environmental concerns, recent research is being done to develop new polymers using elements that already exist naturally. The bulk of conducting polymers is made from synthetic polymers including PAM, PVS, PEG, PEO, and PVP. Such chemical polymers have been used to create mixed polymeric electrolytes, salt-doping polymer electrolytes, fillers, and plasticizer-coupled polymer electrolytes for application in electrochemical devices.5 As an outcome, tremendous progress in developing ecological materials for use in energy devices has been made owing to sustainability, biodegradability, nontoxicity, and recyclability.6 Biopolymer electrolytes are one type of material that can replace synthetic polymers in electrochemical applications. However, the structural stability and ionic conductivity of the electrolytes are still considerably behind expectations. Numerous research organizations have documented the use of biopolymer-based solid electrolytes for a range of electrochemical devices, including chitosan, starch, cellulose acetate, and kappa carrageenan.7,8
Sodium alginate and pectin are two biopolymers that can also be used together in SPEs to take advantage of their complementary properties. Both biopolymers are polysaccharides that are widely used in food, pharmaceutical, and biomedical applications due to their biodegradability, nontoxicity, and biocompatibility. Sodium alginate has good mechanical properties and high ionic conductivity when blended with various ionic salts, while pectin has a good film-forming ability and can enhance the mechanical properties of the electrolyte. Fuzlin et al. analyzed a study of biobased polymer blend electrolytes based on alginate doped with different compositions of glycolic acid and the best ionic conductivity of 5.32 × 10⁻⁵ S cm at ambient temperature with the lowest activation.9 Diana et al.10 stated that a sodium-ion battery prepared by sodium alginate doped with sodium thiocyanate exhibits a proton conductivity at 1.22 × 10⁻² S cm–1. Diana et al.11 reported a state-of-the-art solid-state sodium-ion battery synthesized by sodium alginate and sodium perchlorate biopolymers as water-soluble to enhance an ionic conductivity of 2.291 × 10⁻³ S cm–1 at room temperature. At ambient temperature, Muthukrishnan et al.12 fabricated an energy storage system developed by the polysaccharide host polymer pectin via ammonium salt with an ionic conductivity of 4.5 × 10⁻³ S cm–1.
Hence, sodium alginate and pectin are promising biopolymers for use in solid blend biopolymer electrolytes (SBBEs). Optimization of the polymer blends is most essential owing to characteristics such as (i) property enhancement, (ii) cost reduction, (iii) improving biodegradability, (iv) compatibility with the salt, and (v) innovation of new materials. Ultimately, the decision to blend the polymer is driven by the need to achieve a balance of properties that cannot be attained with a single polymer. Therefore, current research investigates the potential of the blended biopolymer, pectin, and sodium alginate to enhance the ionic conductivity.
2. Materials and Methods
2.1. Materials
Pectin was procured from Otta Chemical Private Ltd. (Mw = 194.14 g/mol), and sodium alginate (NaAlg) (Mw = 198.48 g/mol) was received from Sigma-Aldrich and is used as a material. The solvent employed in this formulation was distilled water.
2.2. Synthesis of the Electrolyte
The solution casting technique was used to prepare a blend of electrolytes of sodium alginate and pectin. Different wt % sodium alginate and pectin were in the order 20:80, 40:60, 50:50, 60:40, and 20:80 continuously stirred for 5 h separately. To get uniform dissolution, both solutions were blended and stirred after 12 h. The solution was poured into a Petri dish and dried in a vacuum oven at 65 °C for 7 h for film formation. The film was then stored in a desiccator. Using a screw gauge, the electrolyte’s thickness was determined. The thicknesses of the samples were within the range of 0.007–0.011 mm. A schematic illustration of the preparation of the NP (NaAlg and pectin) SBBEs is shown in Figure 1.
Figure 1.
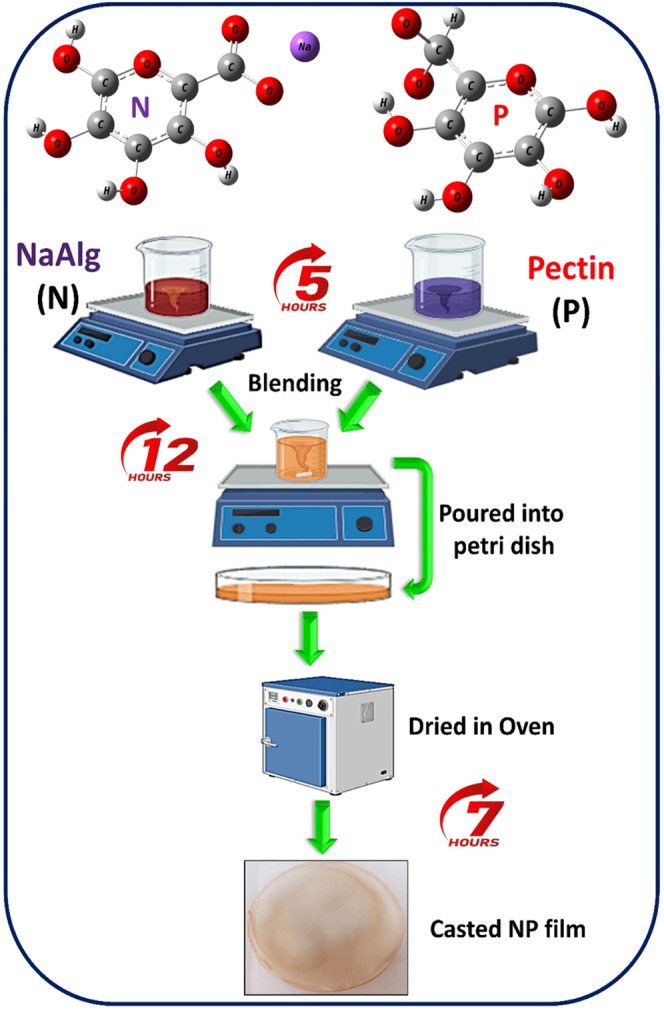
Schematic illustration of the preparation of the NaAlg and pectin (NP) biopolymer blend electrolytes.
2.3. Characterization Techniques
Using an X-ray diffractometer made by Bruker (Cu–Kα radiation 1.540 Å) with a scanning rate of 5 per min in the range of 10–60°, the amorphous/crystalline nature of the SBBE was examined. In order to examine the interactions of polymers and salt, the prepared samples are analyzed with a Fourier transform infrared spectrometer (SHIMADZU IR Tracer 100) in the wavenumber range between 4500 and 500 with 2 cm–1 resolution. HIOKI 3532–50 LCR HI-TESTER was used to measure the ionic conductivities of the prepared SBBE, over the range of 42–106 Hz. Cyclic voltammetry (CV) studies from the CH-Instrument Model 6008e were used to examine the electrochemical characteristics of the prepared sample.
3. Results and Discussion
3.1. XRD Analysis
XRD analysis is a versatile tool to identify the crystal structure of the polymer and the electrolyte components and to determine the degree of crystallinity between them. This information offers to optimize the composition of the electrolyte blend for use in various applications, especially in batteries or fuel cells.13Figure 2 shows the X-ray diffractograms of different compositions of NP biopolymer blend electrolytes. The composition of the samples varies with different concentrations of sodium alginate and pectin and are designed as NP systems, respectively. All of the samples have a small hump at 2θ ∼ 20.9, 30.1, and 42.1°, which exhibit the amorphous nature.14−16
Figure 2.
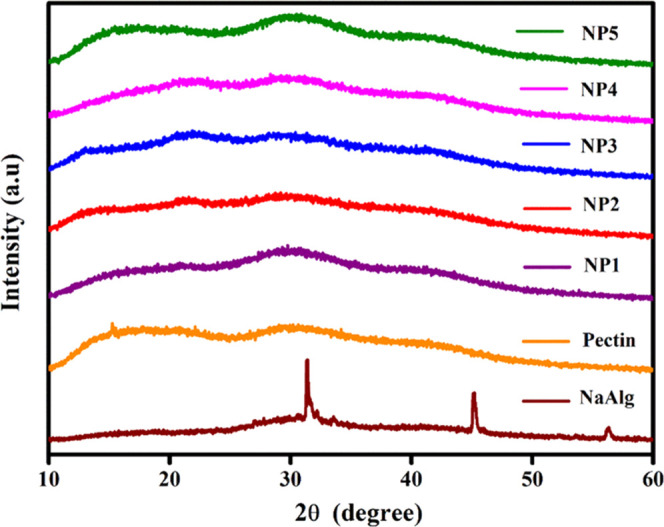
X-ray diffractograms of NP1, NP2, NP3, NP4, and NP5 biopolymer blend electrolytes.
The degree of crystallinity (χc) for the electrolytes is determined using eq 1
| 1 |
Here, Ac represents the area of the crystalline region, and Aa represents the area of the amorphous region.19 The percentage of crystallinity (χc) was calculated based on XRD, as presented in Table 2. The NP1 sample has 10.9% of crystallinity, while it has 89.1% of amorphous nature. Due to the compositional variation in the order of NP1, NP2, NP3, NP4, and NP5, the amorphous nature of samples is broadly expanding; therefore, crystallinity is gradually reduced, thereby being capable of creating an increase in the ionic conductivity of the samples.17 Furthermore, humps at 2θ ∼ 22.1°, 30.1°, and 42.1° of the NP4 sample have a possibility of higher proton conduction due to 91.4% of the amorphous phase and 8.6% of the crystallinity phase. For comparing the composition of the blending nature, the resultant percentages of amorphous nature and crystallinity of the samples are listed in Table 1. Thus, XRD analysis infers that NP4 may possess an electrochemical behavior due to its amorphous nature.
Table 2. Vibrational Assignments of Different Compositions of NP Biopolymer Blend Electrolytes.
| vibrational peaks of the polymer electrolytes (cm–1) | assignments |
|---|---|
| 3741 | OH stretching |
| 3302 | |
| 1727 | C=O stretching |
| 1596 | |
| 1412 | COO– asymmetric stretching |
| 1107, 1012 | O–H stretching |
Table 1. Degree of Crystallinity of NP Biopolymer Electrolytes.
| s.no. | polymer electrolyte NaAlg/pectin | sample code | degree of crystallinity (%) | amorphous (%) |
|---|---|---|---|---|
| 1 | 20:80 | NP1 | 10.9 | 89.1 |
| 2 | 40:60 | NP2 | 10.3 | 89.7 |
| 3 | 50:50 | NP3 | 10.1 | 89.9 |
| 4 | 60:40 | NP4 | 8.6 | 91.4 |
| 5 | 80:20 | NP5 | 18 | 82.0 |
3.2. FTIR Analysis
The complexation between NaAlg and pectin is confirmed by FTIR studies. The FTIR spectra of pure NaAlg, pure pectin, and NP1, NP2, NP3, NP4, and NP5 biopolymer blend electrolytes are shown in Figure 3. The composition of the samples varies with different concentrations of NaAlg blend pectin. When comparing these spectra, the following unique characteristics were observed and are listed in Table 2. The OH stretching vibration is found at 3741 and 3302 cm–1 in all of the systems. The band located at 1727 and 1596 cm–1 is attributed to the presence of C=O stretching vibration in pure pectin and NP systems.18 The COO– asymmetric stretching vibration was observed at 1427 cm–1.19 The appeared band at 1107 and 1039 cm–1 is due to the O–H stretching vibration of the NP system.20,21 No new chemical bonds were formed. The strong interaction of NaAlg and pectin was clearly evident from the peak shifting toward higher wavenumbers. Also, the intensity variation of the electrolytes was minimal. Hence, FTIR analysis of different electrolytes affirms that NaAlg and pectin were well complexed.
Figure 3.
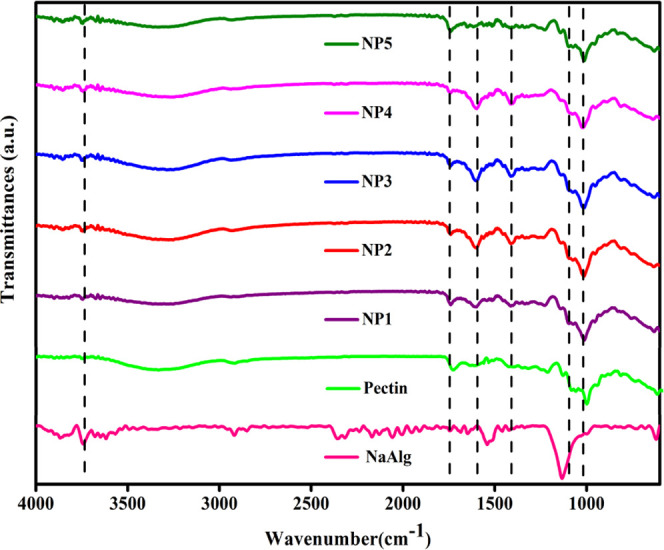
FTIR spectra of pure NaAlg, pure pectin, and NP1, NP2, NP3, NP4, and NP5 biopolymer blend electrolytes.
3.3. AC Impedance Spectroscopy
AC impedance investigation was utilized to examine the electrical characteristics of the synthesized biopolymer electrolytes. The conductivity of the solid blend biopolymer electrolyte can be estimated using the following equation:22
| 2 |
where Rb is the bulk resistance (Ω), A is the electrode area (m2), and L is the thickness of a sample (m).
The impedance spectra of blends contain a wide range of evidence involving ion formation and mobility, surface morphology behavior of a substance with electrode space charge polarization, and other relevant fields.23
3.3.1. Nyquist Plots
The Nyquist plot is a graphical representation used to understand the electrochemical behavior. By measuring the complex impedance of the material at different frequencies, it is possible to determine the bulk resistance, which is related to the ionic conductivity and diffusion coefficient of the electrolyte. The shape and size of the semicircle in the plot provide important information about the nature of the electrolyte, such as the type and concentration of ions, the degree of polymerization, and the presence of any interfacial effects.24
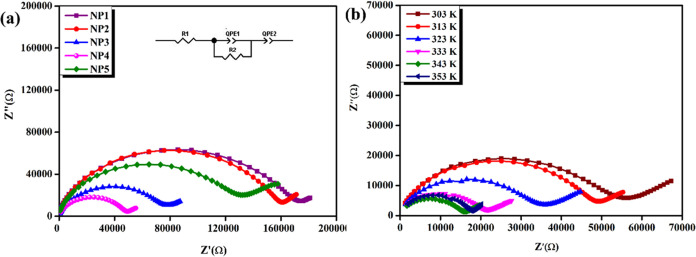
Figure 4a depicts the Nyquist plot of NP1, NP2, NP3, NP4, and NP5 at room temperature (303 K). A semicircle appeared at the beginning of the plot, at higher frequencies, representing the resistance to charge transfer occurring at the electrode interface.25−27 The inclined peak manifests the presence of a Warburg impedance. This spike reflects diffusion-controlled processes, indicating the ion’s movement toward the electrode. As a result, the ionic mobility is enhanced. The data was filtered using ZSimpWin software and possessed an equivalent circuit with a series combination of resistance and a parallel combination of capacitance. The ionic conductivity, activation energy, and relaxation time are compared for all of the samples (NP1, NP2, NP3, NP4, NP5) and are listed in Table 3. The maximum conductivity was optimized as 1.263 × 10⁻⁷ S cm (303 K) for NP4. Figure 4b illustrates the Nyquist plot impedance of the NP4 (60 wt % NaAlg:40 wt % pectin) biopolymer blend at various temperatures (303, 313, 333, 343, 353 K).28,29 On analyzing via different compositions and temperatures, the semicircular region of the NP4 sample has a non-Debye behavior of ion relaxation in the polymer matrix. Extrapolation of the peak gives a low bulk resistance and results in high conductivity from 1.263 × 10⁻⁷ (303 K) to 3.258 × 10⁻⁶ (353 K) S cm, which is evident in Table 4.
Figure 4.
(a) Nyquist plot of NP1, NP2, NP3, NP4, and NP5 at room temperature (303 K). (b) Nyquist plot of NP4 at different temperatures.
Table 3. Values of Ionic Conductivity (σ), Activation Energy (Ea), Regressive Values, and Relaxation Times of NP Polymer Electrolytes.
| polymer electrolytes | ionic conductivity (S cm–1) | activation energy Ea (eV) | regression value (R2) | relaxation time (τ) (s) |
|---|---|---|---|---|
| NP1 | 3.34 × 10⁻⁸ | 0.401 | 0.996 | 8.71 × 10⁻⁴ |
| NP2 | 2.19 × 10⁻⁸ | 0.424 | 0.998 | 3.98 × 10⁻⁴ |
| NP3 | 4.19 × 10⁻⁸ | 0.472 | 0.876 | 3.25 × 10⁻⁴ |
| NP4 | 1.26 × 10⁻⁷ | 0.391 | 0.807 | 1.77 × 10⁻⁴ |
| NP5 | 3.22 × 10⁻⁸ | 0.508 | 0.947 | 2.11 × 10⁻⁴ |
Table 4. Ionic Conductivity of Samples (NP) at Different Compositions and Temperatures.
| ionic
conductivity of polymer electrolytes (S cm–1) |
||||||
|---|---|---|---|---|---|---|
| polymer electrolytes | 303 K | 313 K | 323 K | 333 K | 343 K | 353 K |
| NP1 | 3.34 × 10⁻⁸ | 1.88 × 10⁻⁸ | 2.65 × 10⁻⁸ | 4.07 × 10⁻⁸ | 6.48 × 10⁻⁸ | 9.28 × 10⁻⁸ |
| NP2 | 2.19 × 10⁻⁸ | 4.59 × 10⁻⁸ | 5.48 × 10⁻⁸ | 7.98 × 10⁻⁸ | 1.18 × 10⁻⁸ | 1.84 × 10⁻⁸ |
| NP3 | 4.49 × 10⁻⁸ | 3.12 × 10⁻⁸ | 4.94 × 10⁻⁹ | 9.94 × 10⁻⁸ | 1.39 × 10⁻⁷ | 2.56 × 10⁻⁵ |
| NP4 | 1.36 × 10⁻⁷ | 1.25 × 10⁻⁷ | 1.83 × 10⁻⁷ | 3.19 × 10⁻⁷ | 4.04 × 10⁻⁷ | 3.55 × 10⁻⁶ |
| NP5 | 3.26 × 10⁻⁸ | 4.62 × 10⁻⁷ | 6.79 × 10⁻⁷ | 1.14 × 10⁻⁷ | 2.09 × 10⁻⁷ | 2.38 × 10⁻⁷ |
3.3.2. Conduction Spectra
Conduction spectral analysis is a useful technique to investigate the frequency-dependent electrical behavior of SBBEs. It provides information about the charge transport mechanism, including the presence of different relaxation progressions and the ionic conductivity of the material.30 To obtain the conduction spectra of a solid blend biopolymer electrolyte, one can perform impedance spectroscopy experiments over a range of frequencies. The studies are plotted as a function of frequency on a logarithmic scale to obtain the conduction spectra.24,31,32
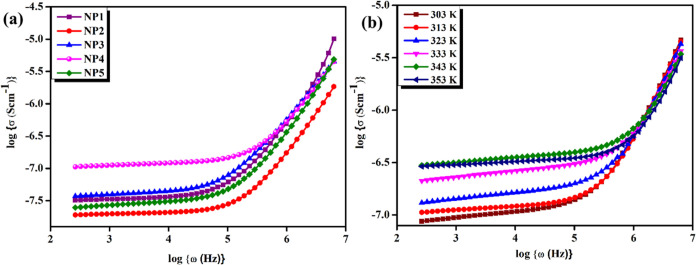
Figure 5a shows the conductance spectra of NP1, NP2, NP3, NP4, and NP5 at room temperature (303 K). The occurrence of two regions in the conduction spectra enables the identification of ion transport mechanisms. At low-frequency regions, electrode polarization affects interfacial ion dispersion.33,34 Conductivity discloses the non-Debye behavior of the polymer system when the frequency is reduced due to the accumulation of charges at the electrolyte/electrode interface, which thereby reduces the number of transportable ions. A strong ionic interaction among charge carriers in the high-frequency portion of the spectrum is related to the faster, short-range ion motions and the bulk relaxation process. The peak area includes the polyelectrolyte conductivity of DC.35,36
Figure 5.
(a) Conductance spectra of NP1, NP2, NP3, NP4, and NP5 at room temperature (303 K). (b) Conductance spectra of the NP4 (60 wt % NaAlg:40 wt % pectin) biopolymer blend electrolyte at different temperatures.
Conductance spectra of the NP4 (60 wt % NaAlg:40 wt % pectin) biopolymer blend electrolyte at various temperatures, as shown in Figure 5b, illustrate that when the ambient temperature increases, the appearance of a broad plateau area results due to the rise of conductivity. According to free volume theories, when the temperature is raised, the transportation of protons increases due to the enlarged space of the polymers. Protons are quite energetic at greater frequency propagation regions. This might be because of the production of additional porosity, resulting in fast ionic migration in this propagation zone.
3.3.3. Temperature-Dependent Ionic Conductivity Studies
The ionic conductivity of a polymer electrolyte is typically temperature-dependent and can be described by using an Arrhenius-type relationship.
| 3 |
where σ is the ionic conductivity, σo is a pre-exponential factor, Ea is the activation energy, k is the Boltzmann constant, and T is the temperature in Kelvin.21,37
| 4 |
In an Arrhenius plot, the logarithm of the conductivity (ln(σ)) is plotted on the y-axis, while the inverse temperature (1/T) is plotted on the x-axis. The slope of the resulting line is proportional to the activation energy (Ea). A typical Arrhenius plot for a polymer electrolyte shows a linear relationship between ln(σ) and 1/T over a temperature range. The slope of the line gives the activation energy, which represents the energy barrier that ions must overcome to move through the electrolyte. The pre-exponential factor σo, can be determined from the intercept of the line.38 As the temperature increases, the exponential term in the equation increases, resulting in an increase in the ionic conductivity. It happens because higher temperatures increase the mobility of ions in the electrolyte, allowing them to move more easily through the material. The Ea represents the energy barrier that ions must overcome to move through the electrolyte. A lower activation energy indicates that ions can move easily and overcome this barrier, resulting in a higher ionic conductivity.9,39
Figure 6 portrays Arrhenius’s behavior for different compositions of NP1, NP2, NP3, NP4, and NP5 biopolymer blend electrolytes at different temperatures. The activation energy is minimal for NP4 (0.3906 eV) and maximum for NP5 (0.5082 eV). Therefore, ion transportation of blended electrolytes has improved via the temperature parameter, which has inferred a lower activation energy by increasing the ionic conductivity.
Figure 6.
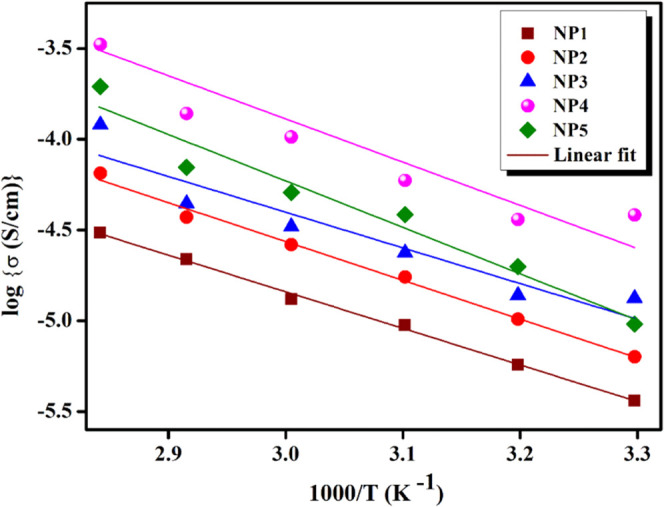
Arrhenius plot for different compositions of NP1, NP2, NP3, NP4, and NP5 biopolymer blend electrolytes at different temperatures.
3.3.4. Dielectric Spectra Analysis
Dielectric spectroscopy is a technique used to study the dynamics of polar and charged species in materials by measuring their response to an applied electric field over a range of frequencies. In the case of the SBBE, dielectric spectroscopy can be used to study the behavior of the polymer matrix and the ionic species within the blend.40
From the impedance data, it is possible to calculate the complex permittivity of the material, which contains information about the ionic conductivity and relaxation dynamics.
The complex permittivity of an SBBE can be expressed as
| 5 |
where ε′ is the real part of the dielectric constant and ε″ is the imaginary part of the dielectric loss.41,42
The storage modulus of the material, which represents its capacity to store energy in the material, is linked to the real component of the permittivity. The imaginary component of the permittivity is connected to the dielectric loss, which represents the material’s capacity to dissipate energy through frictional losses. At low frequencies, the dielectric response of a polymer electrolyte is dominated by the material’s DC conductivity, which is related to ionic species mobility. At higher frequencies, relaxation mechanisms associated with the polymer chain mobility dominate the dielectric response.
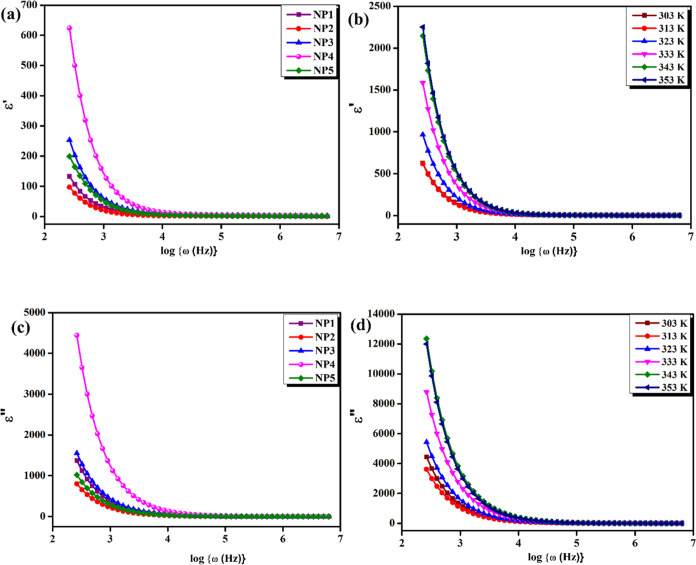
The sample NP4 (60:40) was also tested for the dielectric constant and dielectric loss over a variety of temperatures. It clearly revealed that at different temperatures, the bulk impedance steadily rises as the bulk dielectric constant also rises. Essentially, the most critically vital domains in the field of condensed matter physics are dielectric dissipation and ion conduction principles in solids, especially the ionic mobility in conducting polymers.
The loss of permittivity, also known as dielectric loss, is a measure of the energy dissipated in a material when an electric field is applied to it. In an SBBE, the loss of permittivity can be investigated by a variety of factors, including the presence of impurities or defects in the material, the motion of charged species within the material, and the relaxation of polymer chains. These methods involve applying an AC voltage to the material and measuring the resulting current or capacitance as a function of the frequency. The magnitude of the loss of permittivity in an SBBE depends on several aspects, such as the frequency of the applied electric field, temperature of the material, and concentration of the different polymers in the blend. In general, materials with high ionic conductivity tend to exhibit higher levels of loss of permittivity due to the motion of charged species within the material. However, reducing the concentration of impurities and defects in the material can aid in minimizing the loss of permittivity and can improve the overall performance of the biopolymer electrolyte. The plotted graph shown in Figure 7 illustrates clearly that both the dielectric constant and the loss of dielectric values are rising sharply in the low-frequency area. It demonstrates the non-Debye nature of electrode polarization and the impact of free charging. Higher temperatures facilitate the mobility of polymer portions and substituents, leading to enhanced ion-pair dispersion that leads to a rise in permittivity. As a result, polymer electrolytes depend on the bulk resistance and permittivity imposed by the concentration of biopolymers.
Figure 7.
(a) Variation of dielectric constant spectra ε′ vs log{ω(Hz)} of NP1, NP2, NP3, NP4, and NP5 at room temperature. (b) Variation of dielectric constant spectra ε′ vs log{ω(Hz)} of the NP4 (60 wt % NaAlg:40 wt % pectin) biopolymer blend electrolyte at different temperatures. (c) Variation of dielectric loss ε″ vs log{ω(Hz)} of NP1, NP2, NP3, NP4, and NP5 at room temperature. (d) Variation of dielectric loss ε″ vs log{ω(Hz)} of the NP4 (60 wt % NaAlg:40 wt % pectin) biopolymer blend electrolyte at different temperatures.
3.3.5. Modulus Spectrum Analysis
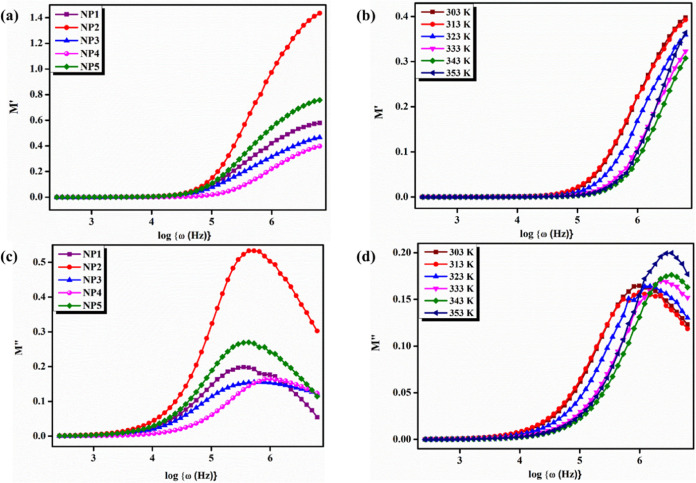
Modulus spectroscopy is a useful technique for characterizing the mechanical properties of materials, including polymer electrolytes. The real and imaginary processes of the electrical modulus produced from the current system have few impacts on the high-frequency region (Figure 8).
Figure 8.
(a) Variation of the real part of modulus M′ vs log{ω(Hz)} of NP1, NP2, NP3, NP4, and NP5 at room temperature. (b) Variation of the real part of modulus M′ vs log{ω(Hz)} of the NP4 (60 wt % NaAlg:40 wt % pectin) biopolymer blend electrolyte at different temperatures. (c) Variation of the imaginary part of modulus M″ vs log{ω(Hz)} of NP1, NP2, NP3, NP4, and NP5 at room temperature. (d) Variation of the imaginary part of modulus M″ vs log{ω(Hz)} of the NP4 (60 wt % NaAlg:40 wt % pectin) biopolymer blend electrolyte at different temperatures.
The long tail appearance of the electrical modulus spectra in the low-frequency region demonstrates that electrode polarization events contribute insignificantly to the electrical modulus of real (M′) and imaginary (M″) portions.43 Furthermore, at higher frequencies, M′ displays a maximum value, and it could be due to the conductivity relaxation process. SBBE insights about the impedance values, charge transport, fast jumping, and ionic mobility are consistent with many other polymer electrolytes that have previously been addressed.44 The amorphous area reduces and segmental mobility bases a minor relaxation peak to arise in the real (M′) and imaginary (M″) sections of the electrical modulus in SBBEs. All biopolymer electrolytes progressively increase in the modulus value as the frequency rises due to the bulk effect.45
The plotted graph clearly shows a hump during different temperature regions in both real and imaginary moduli from the modulus analysis data. A hump in the module portion signifies an apparent indication of functional materials in polymer electrolyte films at different temperatures. On comparison of real and imaginary graphs, the imaginary modulus shows a broad spectral hump, while the real modulus signifies the initial stages.
3.3.6. Tangent Spectra Analysis
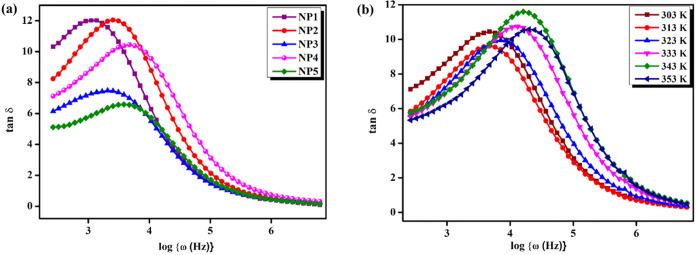
Tangent delta, also known as the loss angle or loss tangent, is a measure of energy dissipation in a substance in the presence of a force or field.46Figure 9a illustrates the loss tangent spectra of NP1, NP2, NP3, NP4, and NP5 at room temperature. The graphs show that tan δ rises with increasing frequency and later diminishes. The different weight percentages of the sodium alginate and pectin (NP) system shows the migration of the peak of the frequency response of tan δ toward a higher frequency region. Therefore, the non-Debye character of the SBBEs was confirmed by the existence of displacement and level fluctuations. Figure 9b shows the loss tangent spectra of the NP4 (60 wt % NaAlg:40 wt % pectin) biopolymer blend electrolyte at various temperatures. It has to be observed that as the temperature rises, the highest proportion of tan δ shifts to a high-frequency side, owing to the reason that the dielectric relaxation system is temperature-dependent, which leads to decrement at high temperatures. The relaxation time of the blended electrolyte NP1 is 8.709 × 10⁻⁴ s, while that of NP4 is 1.778 × 10⁻⁴ s with a higher ionic conductivity.
Figure 9.
(a) Loss tangent spectra of NP1, NP2, NP3, NP4, and NP5 at room temperature. (b) Loss tangent spectra of NP4 at different temperatures.
3.3.7. Argand Plot
An Argand plot is a graphical representation to investigate the dynamics of ion relaxation. The real component of a complex number is depicted on the x-axis, while the imaginary part is illustrated on the y-axis in an Argand plot.46 An Argand plot can be used to indicate the complex impedance of a polymer electrolyte.47 The impedance of a material describes how it responds to an applied electric field and can be represented by a complex number in the form of Z = R + iX, where R is the resistance and X is the reactance.48 The impedance is shown as a vector in the resultant plot, with the angle of the vertex showing the phase shift between the applied electric field and the generated current. The vector’s shape and direction can provide critical information about the polymer electrolyte’s characteristics, such as conductivity, dielectric constant, and polarization behavior.49Figure 10 shows Argand plots for NP1, NP2, NP3, NP4, and NP5 biopolymer blend electrolytes. From the graphical representation, the conductivity and relaxation are decreasing, while a semicircular arc increases its pathway toward the complex modulus.
Figure 10.
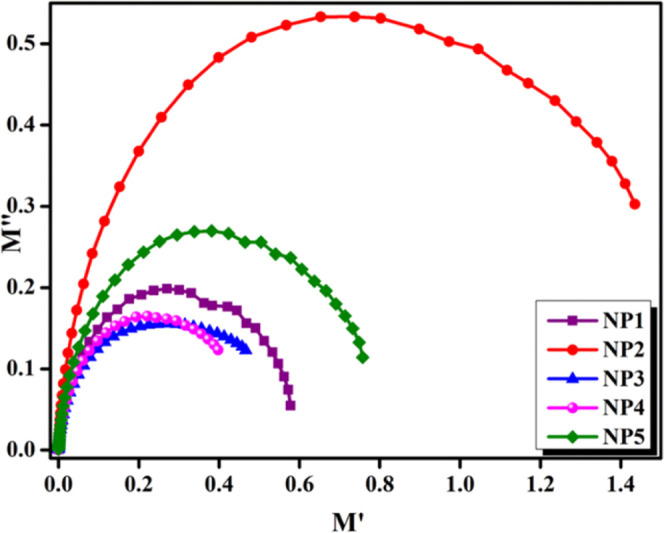
Argand plots for NP1, NP2, NP3, NP4, and NP5 biopolymer blend electrolytes.
3.4. Cyclic Voltammetry
Cyclic voltammetry (CV) is a widely used electrochemical technique to study the redox behavior of materials in solution or at the surface of solid materials.50 In the framework of an SBBE, CV can provide useful information on the electrochemical properties of the material, such as its ion transport characteristics, stability, and electrochemical stability.51Figure 11 shows the cyclic voltammogram of the high conductivity sample NP4 (60 wt % NaAlg:40 wt % pectin) is plotted in between current (A) and potential (V). The NP4 electrolyte stabilizes within the current range of −0.003 to +0.003 A and a potential range of −1 to +1 V to enhance the higher conductivity of the sample. In the plotted graph, both oxidation and reduction peaks are comparatively increasing with a scan rate from 5 to 100 mVs–1 and achieving stability. Also, the appearance of electrochemical reversibility humps might be due to the redox behavior of the sample. Consequently, an increment in the scan rate led to an enhancement in the area of the curve, as shown in Table 5. Therefore, by virtue of the analyzed data, the sample electrolyte was active in electrochemical application.
Figure 11.
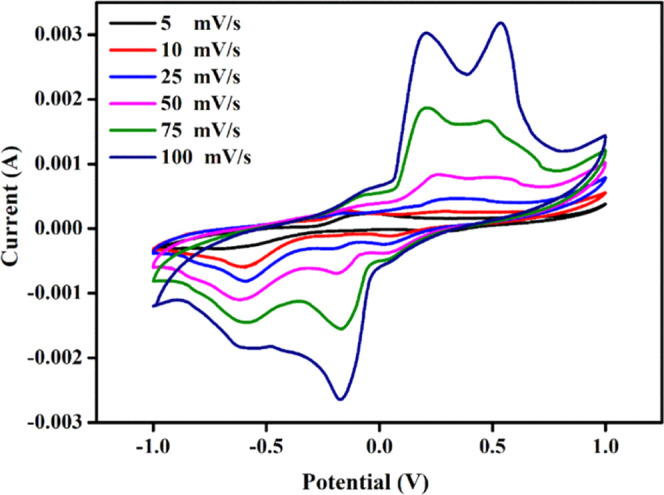
Cyclic voltammogram of the NP4 (60 wt % NaAlg:40 wt % pectin) biopolymer blend electrolyte.
Table 5. CV Analysis of Scan Rate vs Area.
| scan rate (mV/s) | area (m2) |
|---|---|
| 5 | 2.95 × 10⁻⁴ |
| 10 | 5.62 × 10⁻⁴ |
| 25 | 8.36 × 10⁻⁴ |
| 50 | 1.41 × 10⁻³ |
| 75 | 2.31 × 10⁻³ |
| 100 | 3.48 × 10⁻³ |
3.5. Linear Sweep Voltammetry
Linear sweep voltammetry (LSV) is a regularly used electrochemical technique to study the behavior of polymer electrolytes.51 In LSV, a linearly increasing or decreasing potential sweep is applied to the sample while measuring the resulting current. LSV can provide information on similar electrochemical properties as CV, such as ion transport properties, stability window, and electrochemical stability, but with a different approach.52 The linear sweep voltammogram of the highly conducting NP4 (60 wt % NaAlg:40 wt % pectin) biopolymer blend electrolyte is shown in Figure 12. The response curve of NP4 is obtained by applying a consistent energy to the cell. NP4 attains a certain breakdown voltage at 0.66 V to operate the electrolyte safely. Meanwhile, exceeding the breakdown voltage enhances the interface between the electrode potentials. From earlier reports, Shenbagavalli et al. (2021) achieved an observation of an electrochemical stability of 1.12 V as the breakdown voltage for PEO/P(VdF-HFP) with NH4SCN.
Figure 12.
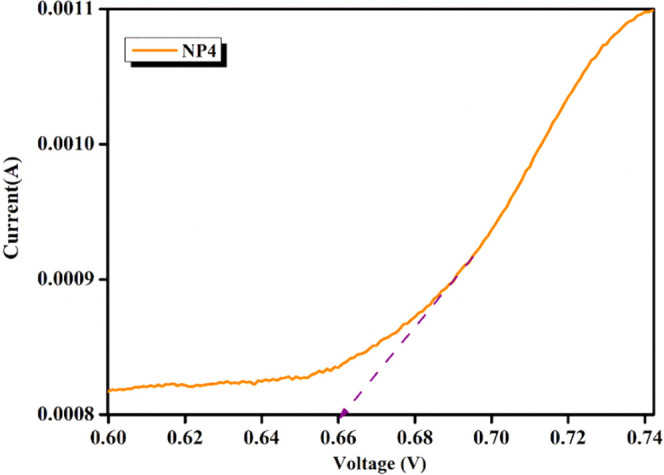
Linear sweep voltammogram of the NP4 (60 wt % NaAlg:40 wt % pectin) biopolymer blend electrolyte.
4. Conclusions
A solid blend biopolymer electrolyte is prepared by using sodium alginate and pectin (NP) via the casting method. The performance of the sample was tested with XRD and was identified to have an occurrence of amorphous nature for free ion species transportation, while FTIR confirmed complexation between the ion–ion interaction within blended electrolytes. The Nyquist plot of 60 wt % NaAlg:40 wt % pectin measures the complex impedance of the material at different frequencies and obtains the ionic conductivity as 1.264 × 10⁻⁷ S cm–1. The non-Debye behavior of the polymer system is demonstrated by the frequency dependence of ionic conductivity. The Arrhenius plot has an activation energy of the blended electrolytes (NPs) of minimal at 0.391 eV for NP4. The values of ε′ and ε″ are found to increase with an increase in temperature. A hump in the module spectra signifies the apparent evidence of functional materials in polymer electrolyte films at different temperatures. The tangent delta loss relaxation peak shifting to the high-frequency side signifies faster ion migration and enhanced conductivity. CV study reveals an electrochemical stable redox nature, while the LSV investigation of NP4 attains a breakdown voltage at 0.66 V. On analyzing these studies, the optimized SBBE sample NP4 of 60 wt % NaAlg:40 wt % pectin has the potential to be used in electrochemical device applications.
Acknowledgments
The authors thank the International Research Centre of Kalasalingam Academy of Research and Education for providing facilities and fellowships to carry out the research. This work was funded by the Researchers Supporting Project Number (RSPD2023R603), King Saud University, Riyadh, Saudi Arabia.
Data Availability Statement
The raw/processed data required to reproduce these findings cannot be shared at this time as the data also forms part of an ongoing study.
The authors declare no competing financial interest.
References
- Shamsuri N. A.; Zaine S. N. A.; Yusof Y. M.; Yahya W. Z. N.; Shukur M. F. Effect of ammonium thiocyanate on ionic conductivity and thermal properties of polyvinyl alcohol–methylcellulose–based polymer electrolytes. Ionics 2020, 26, 6083–6093. 10.1007/s11581-020-03753-9. [DOI] [Google Scholar]
- Zhao L.; Yue W.; Ren Y. Synthesis of graphene-encapsulated mesoporous In2O3 with different particle size for high-performance lithium storage. Electrochim. Acta 2014, 116, 31–38. 10.1016/j.electacta.2013.11.004. [DOI] [Google Scholar]
- Pandi D. V.; Selvasekarapandian S.; Bhuvaneswari R.; Premalatha M.; Monisha S.; Arunkumar D.; Junichi K. Development and characterization of proton conducting polymer electrolyte based on PVA, amino acid glycine and NH 4 SCN. Solid State Ionics 2016, 298, 15–22. 10.1016/j.ssi.2016.10.016. [DOI] [Google Scholar]
- Ciurduc D. E.; Boaretto N.; Fernández-Blázquez J. P.; Marcilla R. Development of high performing polymer electrolytes based on superconcentrated solutions. J. Power Sources 2021, 506, 230220 10.1016/j.jpowsour.2021.230220. [DOI] [Google Scholar]
- Sarwar M. S.; Ghaffar A.; Huang Q.; Zafar M. S.; Usman M.; Latif M. Controlled-release behavior of ciprofloxacin from a biocompatible polymeric system based on sodium alginate/poly(ethylene glycol) mono methyl ether. Int. J. Biol. Macromol. 2020, 165, 1047–1054. 10.1016/j.ijbiomac.2020.09.196. [DOI] [PubMed] [Google Scholar]
- Tao L.; Dastan D.; Wang W.; Poldorn P.; Meng X.; Wu M.; Zhao H.; Zhang H.; Li L.; An B. Metal-Decorated InN Monolayer Senses N 2 against CO 2. ACS Appl. Mater. Interfaces 2023, 15, 12534–12544. 10.1021/acsami.2c21463. [DOI] [PubMed] [Google Scholar]
- Sravanthi K.; Sundari G. S.; Erothu H. Development of bio-degradable based polymer electrolytes for EDLC application. Optik 2021, 241, 166229 10.1016/j.ijleo.2020.166229. [DOI] [Google Scholar]
- Zainuddin N. K.; Samsudin A. S. Investigation on the e ff ect of NH4Br at transport properties in k – carrageenan based biopolymer electrolytes via structural and electrical analysis. Mater. Today Commun. 2018, 14, 199–209. 10.1016/j.mtcomm.2018.01.004. [DOI] [Google Scholar]
- Fuzlin A. F.; Saadiah M. A.; Yao Y.; Nagao Y.; Samsudin A. S. Enhancing proton conductivity of sodium alginate doped with glycolic acid in bio-based polymer electrolytes system. J. Polym. Res. 2020, 27, 207 10.1007/s10965-020-02142-0. [DOI] [Google Scholar]
- Diana M. I.; Selvin P. C.; Selvasekarapandian S.; Krishna M. V. Investigations on Na-ion conducting electrolyte based on sodium alginate biopolymer for all-solid-state sodium-ion batteries. J. Solid State Electrochem. 2021, 25, 2009–2020. 10.1007/s10008-021-04985-z. [DOI] [Google Scholar]
- Sangeetha R. S. D.; Shanmugam M.; Venda I.; Prakash V. C. A.; Bella R. S. D.; Kumar G. H. Development of PVP thin films with PABA and PPA as novel polymer electrolytes. Mater. Today Proc. 2022, 51, 1802–1809. 10.1016/j.matpr.2021.07.447. [DOI] [Google Scholar]
- Muthukrishnan M.; Shanthi C.; Selvasekarapandian S.; Manjuladevi R.; Perumal P.; Chrishtopher Selvin P. Synthesis and characterization of pectin-based biopolymer electrolyte for electrochemical applications. Ionics 2019, 25, 203–214. 10.1007/s11581-018-2568-5. [DOI] [Google Scholar]
- Hemalatha R.; Alagar M.; Selvasekarapandian S.; Sundaresan B.; Moniha V. Studies of proton conducting polymer electrolyte based on PVA, amino acid proline and NH4SCN. J. Sci.: Adv. Mater. Devices 2019, 4, 101–110. 10.1016/j.jsamd.2019.01.004. [DOI] [Google Scholar]
- Chen W.; Luo M.; Yang K.; Zhou X. Simple pyrolysis of alginate-based hydrogel cross-linked by bivalent ions into highly porous carbons for energy storage. Int. J. Biol. Macromol. 2020, 158, 265–274. 10.1016/j.ijbiomac.2020.04.123. [DOI] [PubMed] [Google Scholar]
- Priya S. S.; Karthika M.; Selvasekarapandian S.; Manjuladevi R. Preparation and characterization of polymer electrolyte based on biopolymer I-Carrageenan with magnesium nitrate. Solid State Ionics 2018, 327, 136–149. 10.1016/j.ssi.2018.10.031. [DOI] [Google Scholar]
- Mohanapriya S.; Rambabu G.; Bhat S. D.; Raj V. Pectin based nanocomposite membranes as green electrolytes for direct methanol fuel cells. Arab. J. Chem. 2020, 13, 2024–2040. 10.1016/j.arabjc.2018.03.001. [DOI] [Google Scholar]
- Ataollahi N.; Ahmad A.; Lee T. K.; Abdullah A. R.; Rahman M. Y. A. Preparation and characterization of PVDF-MG49-NH4CF 3SO3 based solid polymer electrolyte. E-Polymers 2014, 14, 115–120. 10.1515/epoly-2013-0087. [DOI] [Google Scholar]
- Mazuki N. F.; Fuzlin A. F.; Saadiah M. A.; Samsudin A. S. An investigation on the abnormal trend of the conductivity properties of CMC/PVA-doped NH4Cl-based solid biopolymer electrolyte system. Ionics 2019, 25, 2657–2667. 10.1007/s11581-018-2734-9. [DOI] [Google Scholar]
- Zhou W.; Zhang H.; Liu Y.; Zou X.; Shi J.; Zhao Y.; Ye Y.; Yu Y.; Guo J. Sodium alginate-polyethylene glycol diacrylate based double network fiber: Rheological properties of fiber forming solution with semi-interpenetrating network structure. Int. J. Biol. Macromol. 2020, 142, 535–544. 10.1016/j.ijbiomac.2019.09.125. [DOI] [PubMed] [Google Scholar]
- Vahini M.; Muthuvinayagam M. AC impedance studies on proton conducting biopolymer electrolytes based on pectin. Mater. Lett. 2018, 218, 197–200. 10.1016/j.matlet.2018.02.011. [DOI] [Google Scholar]
- Perumal P.; Selvin P. C.; Selvasekarapandian S. Characterization of biopolymer pectin with lithium chloride and its applications to electrochemical devices. Ionics 2018, 24, 3259–3270. 10.1007/s11581-018-2507-5. [DOI] [Google Scholar]
- Aziz S. B.; Hadi J. M.; Dannoun E.M.A.; Abdulwahid R. T.; Saeed S. R.; Marf A. S.; Karim W. O.; Kadir M.F.Z. The Study of Plasticized Amorphous Biopolymer Blend Electrolytes Based on Polyvinyl Alcohol (PVA): Chitosan with High Ion Conductivity for Energy. Polymers 2020, 12, 1938 10.3390/polym12091938. [DOI] [PMC free article] [PubMed] [Google Scholar]
- Jansi R.; Shenbagavalli S.; Revathy M. S.; Deepalakshmi S. Solid polymer electrolytes from NaAlg: PVA: effect of ammonium thiocyanate on ionic conductivity. J. Mater. Sci. Mater. Electron. 2023, 34, 489 10.1007/s10854-023-09825-6. [DOI] [Google Scholar]
- Aziz S. B.; Asnawi A. S. F. M.; Abdulwahid R. T.; Ghareeb H. O.; Alshehri S. M.; Ahamad T.; Hadi J. M.; Kadir M. F. Z. Design of potassium ion conducting PVA based polymer electrolyte with improved ion transport properties for EDLC device application. J. Mater. Res. Technol. 2021, 13, 933–946. 10.1016/j.jmrt.2021.05.017. [DOI] [Google Scholar]
- Shetty S. K.; Hegde S.; Ravindrachary V.; Sanjeev G.; Bhajantri R. F.; Masti S. P. Dielectric relaxations and ion transport study of NaCMC:NaNO3 solid polymer electrolyte films. Ionics 2021, 27, 2509–2525. 10.1007/s11581-021-04023-y. [DOI] [Google Scholar]
- Ahmad N. H.; Isa M. I. N. Structural and Ionic Conductivity Studies of CMC Based Polymer Electrolyte Doped with NH 4 Cl. Adv. Mater. Res. 2015, 1107, 247–252. 10.4028/www.scientific.net/AMR.1107.247. [DOI] [Google Scholar]
- Kufian M. Z.; Majid S. R.; Arof A. K. Dielectric and conduction mechanism studies of PVA-orthophosphoric acid polymer electrolyte. Ionics 2007, 13, 231–234. 10.1007/s11581-007-0098-7. [DOI] [Google Scholar]
- Jeyabanu K.; Sundaramahalingam K.; Devendran P.; Manikandan A.; Nallamuthu N. Effect of electrical conductivity studies for CuS nanofillers mixed magnesium ion based PVA-PVP blend polymer solid electrolyte. Phys. B 2019, 572, 129–138. 10.1016/j.physb.2019.07.049. [DOI] [Google Scholar]
- Sheela T.; Bhajantri R. F.; Nambissan P. M. G.; Ravindrachary V.; Lobo B.; Naik J.; Rathod S. G. Ionic conductivity and free volume related microstructural properties of LiClO4/PVA/NaAlg polymer composites: Positron annihilation spectroscopic studies. J. Non-Cryst. Solids. 2016, 454, 19–30. 10.1016/j.jnoncrysol.2016.10.010. [DOI] [Google Scholar]
- Jansi R.; Shenbagavalli S.; Revathy M. S.; et al. Structural and ionic transport in biopolymer electrolyte- based PVA: NaAlg with NH 4 Cl for electrochemical applications. J. Mater. Sci. Mater. Electron. 2023, 34, 963 10.1007/s10854-023-10302-3. [DOI] [Google Scholar]
- Ong A. C. W.; Shamsuri N. A.; Zaine S. N. A.; Panuh D.; Shukur M. F. Nanocomposite polymer electrolytes comprising starch-lithium acetate and titania for all-solid-state supercapacitor. Ionics 2021, 27, 853–865. 10.1007/s11581-020-03856-3. [DOI] [Google Scholar]
- Arya A.; Sharma A. L. Effect of salt concentration on dielectric properties of Li-ion conducting blend polymer electrolytes. J. Mater. Sci. Mater. Electron. 2018, 29, 17903–17920. 10.1007/s10854-018-9905-3. [DOI] [Google Scholar]
- Jothi M. A.; Vanitha D.; Bahadur S. A.; Nallamuthu N. Promising biodegradable polymer blend electrolytes based on cornstarch:PVP for electrochemical cell applications. Bull. Mater. Sci. 2021, 44, 65 10.1007/s12034-021-02350-4. [DOI] [Google Scholar]
- Naik J.; Rathod S. G.; et al. Ionic conductivity and free volume related microstructural properties of LiClO 4/PVA/NaAlg polymer composites: Positron annihilation spectroscopic studies. J. Non-Cryst. Solids 2016, 454, 19–30. 10.1016/j.jnoncrysol.2016.10.010. [DOI] [Google Scholar]
- Hamsan M. H.; Aziz S. B.; Kadir M. F. Z.; Brza M. A.; Karim W. O. The study of EDLC device fabricated from plasticized magnesium ion conducting chitosan based polymer electrolyte. Polym. Test. 2020, 90, 106714 10.1016/j.polymertesting.2020.106714. [DOI] [Google Scholar]
- Aziz S. B.; Abdullah O. G.; Saeed S. R.; Ahmed H. M. Electrical and dielectric properties of copper ion conducting solid polymer electrolytes based on chitosan: CBH model for ion transport mechanism. Int. J. Electrochem. Sci. 2018, 13, 3812–3826. 10.20964/2018.04.10. [DOI] [Google Scholar]
- Sivadevi S.; Selvasekarapandian S.; Karthikeyan S.; Sanjeeviraja C.; Nithya H.; Iwai Y.; Kawamura J. Proton-conducting polymer electrolyte based on PVA-PAN blend doped with ammonium thiocyanate. Ionics 2015, 21, 1017–1029. 10.1007/s11581-014-1259-0. [DOI] [Google Scholar]
- Radha K. P.; Selvasekarapandian S.; Karthikeyan S.; Hema M.; Sanjeeviraja C. Synthesis and impedance analysis of proton-conducting polymer electrolyte PVA:NH4F. Ionics 2013, 19, 1437–1447. 10.1007/s11581-013-0866-5. [DOI] [Google Scholar]
- Jansi R.; Vinay B.; Revathy M. S.; Janani V. A.; Sasikumar P.; Abbas M. Investigation on polyvinyl alcohol and sodium alginate blend matrix with ammonium nitrate conducting electrolytes for electrochemical applications. J. Saudi Chem. Soc. 2023, 27, 101743 10.1016/j.jscs.2023.101743. [DOI] [Google Scholar]
- Maheshwari T.; Tamilarasan K.; Selvasekarapandian S.; Chitra R.; Kiruthika S. Investigation of blend biopolymer electrolytes based on Dextran-PVA with ammonium thiocyanate. J. Solid State Electrochem. 2021, 25, 755–765. 10.1007/s10008-020-04850-5. [DOI] [Google Scholar]
- Saha M.; Ray R.; Choudhury A. R.; De Bhowmik P.; Ballabh T. K. Impact of exfoliation/intercalation of nano-clay on structure, morphology and electrical properties of poly (ethylene oxide) based solid nanocomposite electrolytes. J. Polym. Res. 2021, 28, 299 10.1007/s10965-021-02622-x. [DOI] [Google Scholar]
- Mallaiah Y.; Jeedi V. R.; Swarnalatha R.; Raju A.; Reddy S. N.; Chary A. S. Impact of polymer blending on ionic conduction mechanism and dielectric properties of sodium based PEO-PVdF solid polymer electrolyte systems. J. Phys. Chem. Solids 2021, 155, 110096 10.1016/j.jpcs.2021.110096. [DOI] [Google Scholar]
- Sadiq M.; Khan M. A.; Raza M. M. H.; Aalam S. M.; Zulfequar M.; Ali J. Enhancement of Electrochemical Stability Window and Electrical Properties of CNT-Based PVA–PEG Polymer Blend Composites. ACS Omega 2022, 7, 40116–40131. 10.1021/acsomega.2c04933. [DOI] [PMC free article] [PubMed] [Google Scholar]
- Dennis J. O.; Shukur M. F.; Aldaghri O. A.; Ibnaouf K. H.; Adam A. A.; Usman F.; Hassan Y. M.; Alsadig A.; Danbature W. L.; Abdulkadir B. A. A Review of Current Trends on Polyvinyl Alcohol (PVA)-Based Solid Polymer Electrolytes. Molecules 2023, 28, 1781 10.3390/molecules28041781. [DOI] [PMC free article] [PubMed] [Google Scholar]
- Nandhinilakshmi M.; Vanitha D.; Nallamuthu N.; Jothi M. A.; Sundaramahalingam K. Structural, electrical behavior of sodium ion-conducting corn starch–PVP-based solid polymer electrolytes. Polym. Bull. 2023, 80, 3793–3817. 10.1007/s00289-022-04230-1. [DOI] [Google Scholar]
- Nofal M. M.; Aziz S. B.; Ghareeb H. O.; Hadi J. M.; Dannoun E. M. A.; Al-Saeedi S. I. Impedance and Dielectric Properties of PVC:NH4I Solid Polymer Electrolytes (SPEs): Steps toward the Fabrication of SPEs with High Resistivity. Materials 2022, 15, 2143 10.3390/ma15062143. [DOI] [PMC free article] [PubMed] [Google Scholar]
- Faris B. K.; Hassan A. A.; Aziz S. B.; Brza M. A.; Abdullah A. M.; Abdalrahman A. A.; Ali O. A. A.; Saleh D. I. Impedance, electrical equivalent circuit (Eec) modeling, structural (ftir and xrd), dielectric, and electric modulus study of mc-based ion-conducting solid polymer electrolytes. Materials 2022, 15, 170 10.3390/ma15010170. [DOI] [PMC free article] [PubMed] [Google Scholar]
- Samartharama B. N.; Nagaiah N.; Ambika M. R.; Demappa T.; Vipin C. Studies on structural and electrical properties of NaI doped PEO/CMC blend solid polymer electrolyte. J. Polym. Res. 2022, 29, 459 10.1007/s10965-022-03299-6. [DOI] [Google Scholar]
- Feynerol V.; El Hage R.; Helú M. B.; Fierro V.; Celzard A.; Liu L.; Etienne M. Comparative kinetic analysis of redox flow battery electrolytes: From micro-fibers to macro-felts. Electrochim. Acta 2022, 421, 140373 10.1016/j.electacta.2022.140373. [DOI] [Google Scholar]
- Kanaphan Y.; Klamchuen A.; Chaikawang C.; Harnchana V.; Srilomsak S.; Nash J.; Wutikhun T.; Treethong A.; Rattana-amron T.; Kuboon S.; Khemthong P.; Liangruksa M.; Meethong N. Interfacially Enhanced Stability and Electrochemical Properties of C/SiO x Nanocomposite Lithium-Ion Battery Anodes. Adv. Mater. Interfaces 2022, 9, 2200303 10.1002/admi.202200303. [DOI] [Google Scholar]
- Abdulwahid R. T.; Aziz S. B.; Kadir M. F. Z.; Sadiq N. M.; Halim N. A.; Hamsan M. H.; Saeed S. R.; Woo H. J. Biodegradable polymer membrane K+ ion conductor for electrochemical device application. J. Mater. Sci. 2022, 57, 19902–19923. 10.1007/s10853-022-07825-1. [DOI] [Google Scholar]
- NSM J.; SBRS A.; Ahmad N. Sodium-ion nanoionic hybrid solid electrolyte: Extended study on enhanced electrical and electrochemical properties. Solid State Ionics 2022, 377, 115882 10.1016/j.ssi.2022.115882. [DOI] [Google Scholar]
Associated Data
This section collects any data citations, data availability statements, or supplementary materials included in this article.
Data Availability Statement
The raw/processed data required to reproduce these findings cannot be shared at this time as the data also forms part of an ongoing study.


