Abstract
Loss of the Y chromosome (LOY) is observed in multiple cancer types, including 10–40% of bladder cancers1–6, but its clinical and biological significance is unknown.Here, using genomic and transcriptomic studies, we report that LOY correlates with poor prognoses in patients with bladder cancer. We performed in-depth studies of naturally occurring LOY mutant bladder cancer cells as well as those with targeted deletion of Y chromosome by CRISPR–Cas9. Y-positive (Y+) and Y-negative (Y−) tumours grew similarly in vitro, whereas Y− tumours were more aggressive than Y+ tumours in immune-competent hosts in a T cell-dependent manner. High-dimensional flow cytometric analyses demonstrated that Y− tumours promote striking dysfunction or exhaustion of CD8+ T cells in the tumour microenvironment. These findings were validated using single-nuclei RNA sequencing and spatial proteomic evaluation of human bladder cancers. Of note, compared with Y+ tumours, Y− tumours exhibited an increased response to anti-PD-1 immune checkpoint blockade therapy in both mice and patients with cancer. Together, these results demonstrate that cancer cells with LOY mutations alter T cell function, promoting T cell exhaustion and sensitizing them to PD-1-targeted immunotherapy. This work provides insights into the basic biology of LOY mutation and potential biomarkers for improving cancer immunotherapy.
The Y chromosome is essential for male sex determination and spermatogenesis7. Recent studies, aided by advances in sequencing technologies and CRISPR-mediated knockout of the entire Y chromosome8, have begun to characterize the function of the Y chromosome in a variety of physiological contexts. In ageing men, LOY has been associated with many adverse health consequences. For example, LOY in haematopoietic cells is associated with an increased risk of several diseases, including cardiac fibrosis9 and multiple cancer types1–3,10. In bladder cancer, LOY has been found in 10–40% of tumours4–6,11–15. This is unsurprising, since bladder cancer is commonly caused by environmental exposures to tobacco and industrial chemicals, which are known to result in DNA damage and LOY16–18. Here we describe how LOY and the corresponding loss of Y chromosome genes such as KDM5D and UTY confer an aggressive phenotype to bladder cancer, while also making LOY tumours more vulnerable to immunotherapy.
Here we developed Y+ and Y− cancer cell models in mice for in vitro and in vivo studies using naturally arising bladder cancer cells with LOY as well as CRISPR-mediated deletion of the entire Y chromosome. We also developed a LOY gene expression signature to interrogate human specimens. We show that cancer cells with LOY have a more aggressive growth phenotype and that low LOY gene signature scores are associated with a poor clinical prognosis for patients with cancer. Using spectral flow cytometry and GeoMX hi-plex spatial proteomic analyses, we showed that mouse tumours with LOY exhibit an immunosuppressive tumour microenvironment (TME) with significant CD8+ T cell exhaustion. We found similar results in human bladder cancer specimens with LOY using single-nuclei RNA sequencing (snRNA-seq) and histology-based analyses using co-detection by indexing (CODEX). The clinical relevance of these findings is further supported by the observation that patients with bladder cancer exhibiting LOY had an improved response to immune checkpoint blockade (ICB) targeting PD-1/PD-L1, which is commonly used to treat advanced bladder cancer19,20.
Collectively, we provide evidence linking LOY in bladder cancer to more aggressive tumour growth and a poor prognosis. Furthermore, we show that LOY tumours promote CD8+ T cell exhaustion in the TME, predisposing them to a therapeutic vulnerability to ICB in male patients.
LOY is associated with a worse patient outcome
We created a Y chromosome RNA expression signature score based on 18 Y-encoded genes that are expressed in normal bladder urothelium21 (Extended Data Fig. 1a,b). We used this score to stratify the overall survival of 300 men with locally advanced muscle-invasive bladder cancer (MIBC) in The Cancer Genome Atlas (TCGA) transcriptomic data22. The samples were divided into two groups on the basis of average Y chromosome signature scores: Yhigh (n = 182) and Ylow (n = 118) (Fig. 1a,b). Age (34–90 years), stage (tumour, lymph node or metastatic lesion), race (white, African American or Asian) and tumour grade (high or low) did not differ between Yhigh and Ylow samples (Fig. 1a). However, patients with low Y chromosome gene expression score had significantly (P = 0.029) worse overall survival compared with those with higher expression (Fig. 1c). Notably, decreased individual expression of four Y chromosome genes (KDM5D, UTY (also known as KDM6C), TBL1Y and ZFY) was also associated with a poor prognosis (Extended Data Fig. 1c). Similar results for survival were found when 834 patients with non-muscle-invasive bladder cancer (NMIBC) were evaluated23 (Extended Data Fig. 1d), suggesting that LOY is present early in disease progression.
Fig. 1 |. LOY is associated with a worse prognosis for men with MIBC.
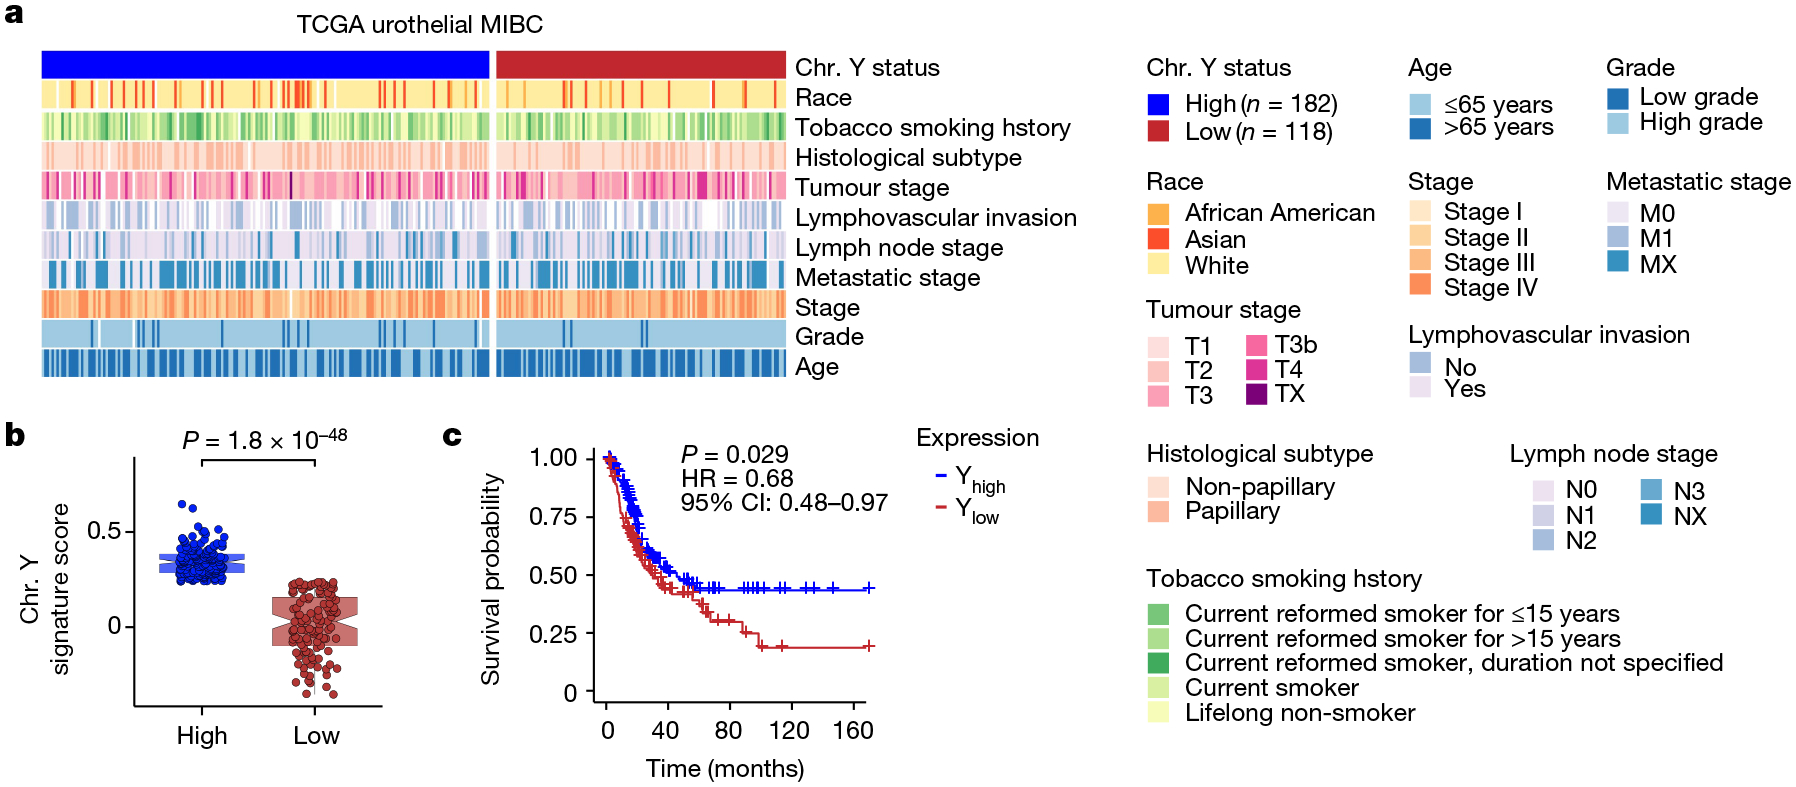
a, Heat map of clinical parameters and metadata for 300 male patients with MIBC from TCGA data. Chr. Y, Y chromosome. b,c, Plot of Y chromosome gene expression (b) and Kaplan–Meier survival curve (c) associated with Yhigh (n = 182) and Ylow (n = 118) samples identified in a. CI, confidence interval; HR, hazard ratio. Differences in gene expression and survival were based on Wilcoxon rank-sum test and log-rank statistics, respectively. In box plots, the centre line represents the mean and box edges show first and third quartiles. Minimum and maximum datapoints are included.
To confirm the robustness of the results obtained with our Y chromosome signature score, we also carried out virtual karyotyping analyses using two different methods. In the first study, we used TCGA RNA data to show that extreme downregulation of chromosome Y (EDY) increased cancer risk in 12 cancer types, including bladder cancer1. In the second study, we used TCGA DNA sequencing data and mosaic alteration detection for LOY (MADLOY) to detect LOY from genotype array intensity data24. These two studies validated our Y chromosome signature, as Ylow tumour specimens were also identified as having EDY and LOY by these techniques, and suggest that low expression of Y chromosome genes is due to the loss of the Y chromosome (Extended Data Fig. 1e).
Development of LOY mouse bladder cancer models
To determine why Ylow bladder cancer is more aggressive than Yhigh tumours, we assessed Y chromosome gene expression in MB49, a well-studied mouse bladder cancer cell line that has been shown to naturally lose the Y chromosome25–27. We selected and expanded single-cell clones from the heterogeneous MB49 parental population and assessed the expression of seven genes located on the male-specific region on chromosome Y that are commonly expressed in both mouse and human bladder cells21. Only three (Kdm5d, Uty and Ddx3y) out of the seven genes were expressed in the MB49 line (Extended Data Fig. 2a and Supplementary Table 1). We also evaluated Eif2s3y expression, as it is an additional mouse Y chromosome gene that is expressed in urothelium21. We pooled 16 clones that exhibited no Y chromosome gene expression compared to positive controls (normal mouse testis and the parental MB49 line) to create a polyclonal Y− cell line. The female bladder cell line NA13 (ref. 28) and the breast cancer line E0771 (ref. 29) served as negative controls. Similarly, we pooled together 16 clones that expressed the four Y chromosome genes at similar levels to positive controls to create a polyclonal Y+ cell line (Extended Data Fig. 2b,c). Next, using whole-exome sequencing (WES), we confirmed that the lack of Y chromosome gene expression in the MB49 sublines was due to LOY (Extended Data Fig. 2d).
Effect of LOY on cancer growth
We observed no differences in proliferation between the Y− and Y+ sublines in 2D or 3D in vitro culture (Fig. 2a and Extended Data Fig. 3a,b). To investigate the effect of LOY on tumour growth in vivo, we injected the Y− and Y+ lines subcutaneously into immune-competent wild-type male C57BL/6 mice. We found that Y− tumours exhibited an approximately twofold increased tumour growth rate compared with Y+ tumours (Fig. 2b). This observation provided compelling clinical relevance for our model system, since it paralleled the relationship observed in human tumours. We then assessed the contribution of host immunity to the differential growth by injecting each cell type into wild-type and Rag2−/−Il2rg−/− (deficient in T cells, B cells and natural killer cells) male mice. Again, Y− tumours grew significantly faster than Y+ tumours in the wild-type mice, whereas both cell types grew at the same rate in the immunocompromised Rag2−/−Il2rg−/− mice (Fig. 2c), indicating that the Y− tumours were more efficient in evading anti-tumour adaptive immunity.
Fig. 2 |. LOY and deletion of the Y chromosome genes Kdm5d and Uty promotes bladder tumour growth in an immune-competent host.
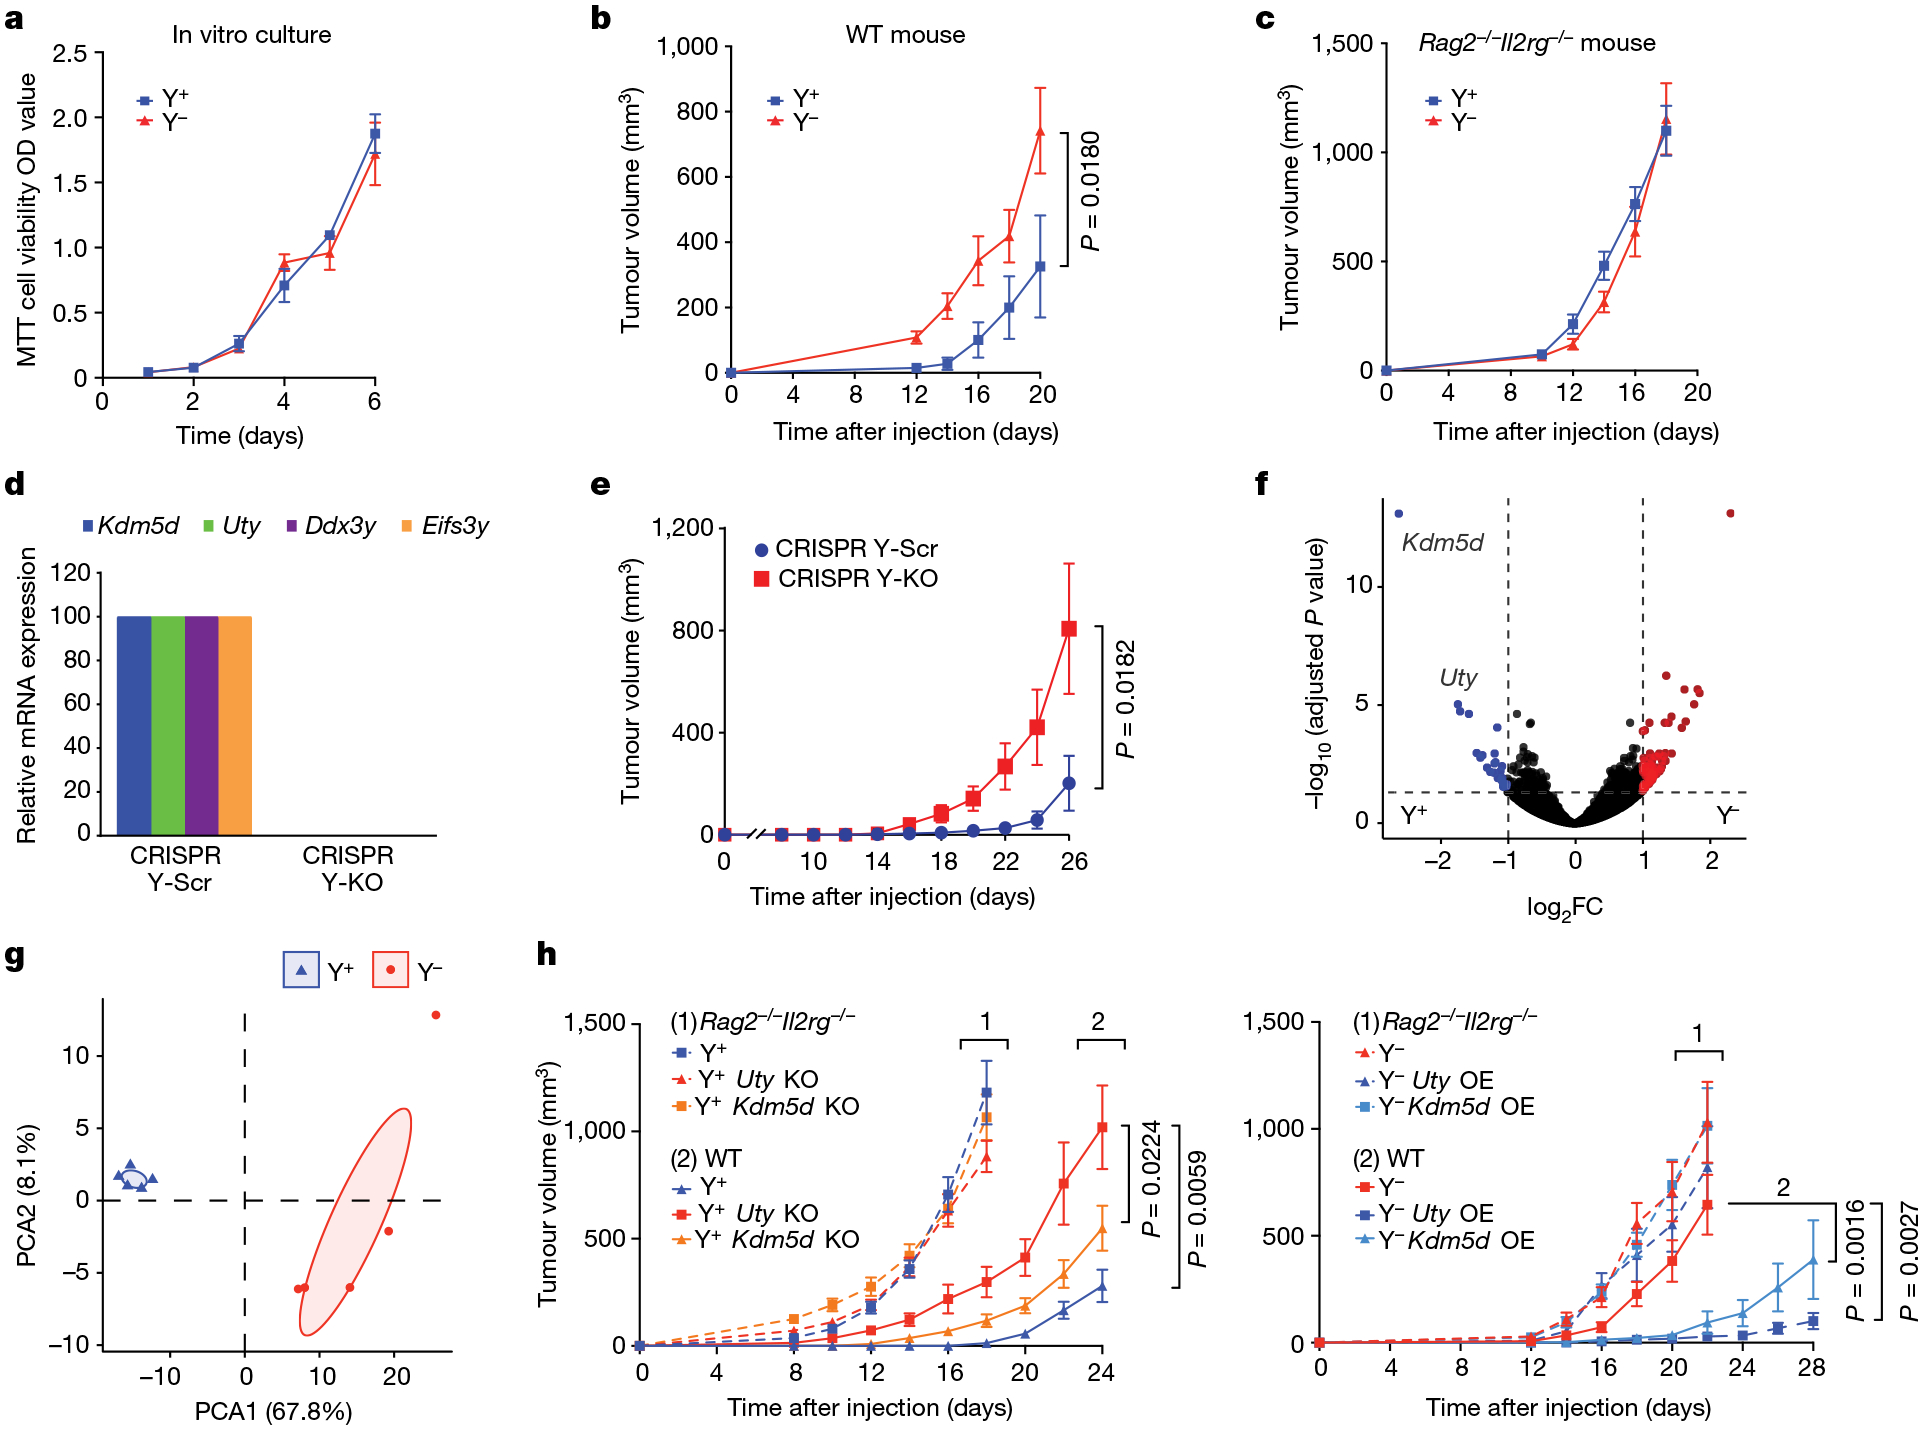
a, Proliferation of Y+ and Y− MB49 cells in vitro (by MTT cell viability assay) over a six-day time course. Data are mean ± s.e.m. n = 3 biological replicates. OD, optical density. b,c, Tumour volume of Y+ and Y− MB49 cells grown subcutaneously in wild-type (WT) C57BL/6 (b; n = 10 mice per group) or Rag2−/−Il2rg−/− (c; n = 10 mice per group) male mice. d, Relative mRNA expression (determined by RT–qPCR) of Uty, Kdm5d, Eifs3y and Ddx3y in CRISPR-generated Y-Scr and Y-KO MB49 lines. e, Tumour volume of CRISPR Y-Scr and CRISPR Y-KO MB49 cells grown subcutaneously in wild-type C57BL/6 male mice (n = 10 (Y-Scr) and 8 (Y-KO) mice per group). f, Volcano plot of statistically significant (Benjamini–Hochberg method, P < 0.05) differentially expressed genes (DEGs) from Y+ (blue) and Y− (red) MB49 cells that exhibit a positive or negative log2 fold difference in expression of greater than one. FC, fold change. g, PCA of Y+ (blue) and Y– (red) DEGs described in f. Shaded areas encompass regions where the principal component falls within a 95% confidence internal. h, Left, tumour volume of Y+ Uty-KO and Y+ Kdm5d-KO cell lines injected subcutaneously into wild-type (n = 10 mice per group) or Rag2−/−Il2rg−/− (n = 10 mice per group) male mice. Right, similarly, Y−, Uty-overexpression (OE) and Kdm5d-OE cell lines were implanted into wild-type (n = 10 mice per group) or Rag2−/−Il2rg−/− (n = 8, 6 and 6 mice per group, respectively) male mice. All mouse experiments are representative of two independent experiments. Repeated measures two-way ANOVA; comparisons were made with the Y+ and Y− controls in h. Data are mean ± s.e.m.
To separate Y chromosome loss from other potential differences in genetic background between the Y+ and Y− lines, we deleted the Y chromosome from Y+ cells using CRISPR–Cas9-mediated chromosome depletion using previously established techniques8,9 (Fig. 2d). Depletion of the Y chromosome alone (CRISPR Y-KO) promoted faster tumour growth compared with the scrambled guide RNA Y+ control (CRISPR Y-Scr) MB49 cells in immune-competent mice (Fig. 2e and Extended Data Fig. 3b,c). This essentially reproduced the findings from naturally occurring Y− bladder cancer cells.
We next aimed to define the molecular drivers in Y− tumours that contribute to immune evasion. Of the three genes shared between humans and MB49 cells, low expression of KDM5D and UTY were the only human genes whose loss of expression was associated with an unfavourable prognosis in human bladder cancer (Fig. 2f,g, Extended Data Fig. 1c and Supplementary Table 1). We therefore engineered Y+ and Y− sublines in which Uty or Kdm5d was either knocked out or overexpressed. We found that Y+ tumours in which Uty or Kdm5d was knocked out exhibited an increased growth rate compared with Y+ tumours in wild-type hosts, but no such difference was observed in Rag2−/−Il2rg−/− mice (Fig. 2h). Consistent with these results, overexpression of either Uty or Kdm5d in Y− tumours resulted in decreased tumour growth in wild-type mice but not in Rag2−/−Il2rg−/− mice (Fig. 2h). Again, all lines shared the same growth kinetics in vitro (Extended Data Fig. 3b). Together, these results demonstrate that Uty and Kdm5d contribute—at least in part—to the impaired anti-tumour immunity of Y− tumours. Further, identification of KDM5D or UTY loss in human tumours has the potential to be a useful prognostic factor in determining the clinical aggressiveness of bladder cancer.
LOY cancer cells create an immunosuppressive TME
To further determine the immunological basis of the differential growth of Y− and Y+ tumours, we sequenced the entire transcriptome from Y− and Y+ MB49 tumours grown in wild-type mice. We detected 958 DEGs (Extended Data Fig. 4a). Tumours from each genotype were separated by principal component analysis (PCA) (Extended Data Fig. 4b), supporting a distinct molecular architecture. Gene set enrichment analyses (GSEA) performed on DEGs revealed that Y+ tumours were associated with enhanced immune responses compared with Y− tumours (positive regulation of lymphocyte proliferation: normalized enrichment score (NES) = 1.59, adjusted P value = 0.01; lymphocyte mediated immunity: NES = 1.76, adjusted P value = 0.01; response to IFNγ: NES = 1.87, adjusted P value = 0.01; positive regulation of T cell activation: NES = 1.80, adjusted P value = 0.01) (Extended Data Fig. 4c). We then further genetically defined the roles of T cells and B cells using mice with deficiency in each cellular compartment. We observed similar enhanced growth of Y− tumours in wild-type as well as in B cell-deficient Ighm-knockout (KO) mice (Fig. 3a). However, the differential growth of Y+ and Y− tumours was eliminated in Rag2−/− and Tcrb−/−Tcrd−/− mice, confirming that the increased tumour growth control of Y+ tumours was due to endogenous anti-tumour T cell immunity (Fig. 3a).
Fig. 3 |. Ylow bladder cancer overcomes T cell immunity and endows an immune-suppressive TME.
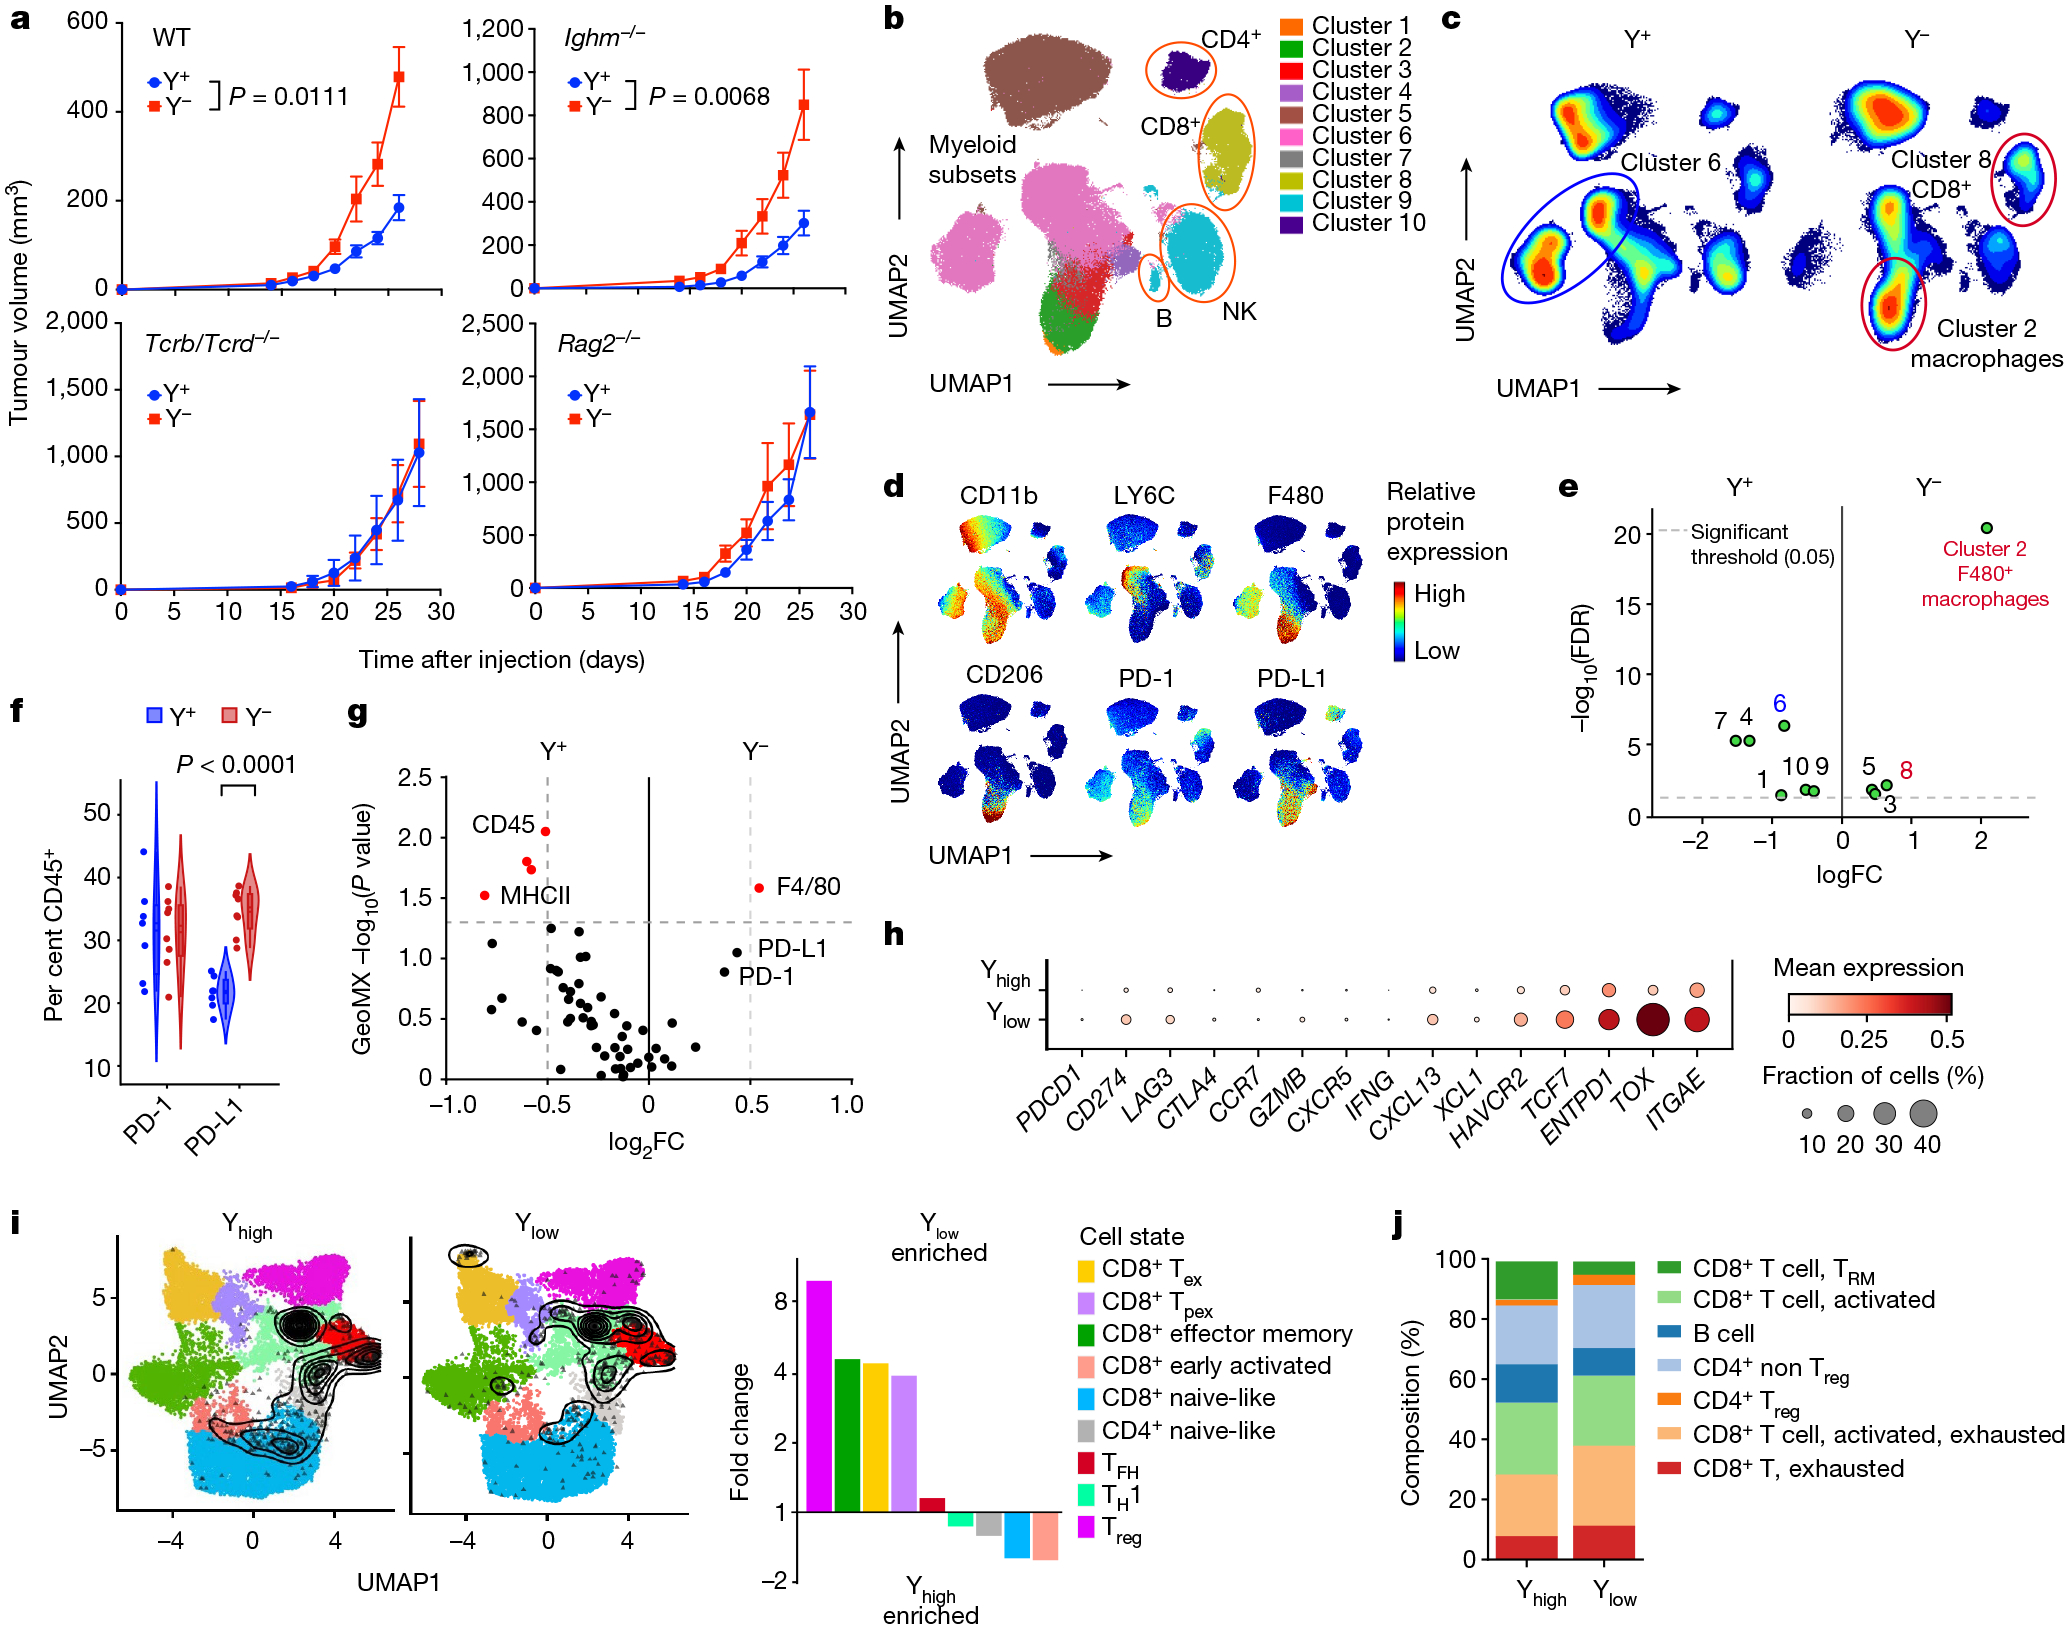
a, Tumour growth curves of Y+ and Y− MB49 cells grown subcutaneously in wild-type (n = 8 mice per group), Ighm−/− (n = 10 (Y+) and 7 (Y−) mice per group), Tcrb−/−/Tcrd−/− (n = 8 (Y+) and 9 (Y−) mice per group) or Rag2−/− (n = 8 (Y+) and 10 (Y−) mice per group) male mice. Data are representative of two independent experiments. Statistical significance was determined by repeated measures two-way ANOVA. Data are mean ± s.e.m. b, Uniform manifold approximation and projection for dimension reduction (UMAP) of spectral flow cytometry analysis of CD45+ immune cell subsets from Y+ and Y− MB49 tumours. NK, natural killer cells. c,d, Heat map of UMAP immune cell populations (c) and individual protein markers (d) from Y+ and Y− MB49 tumour-infiltrating lymphocytes detailed in b. e, Volcano plot of significantly different (P < 0.05, green) UMAP clusters between Y+ and Y− MB49 tumours. Red and blue labels (and circles in c) denote Y− and Y+-associated clusters of interest, respectively. FDR, false discovery rate. f, Violin plot of PD-1 and PD-L1 expression in Y− and Y+ MB49 CD45+ immune cells. Two-sided unpaired t-test. g, Volcano plot of statistically significant (red) GeoMX marker expression between Y+ and Y− MB49 tumours. h, Dot plot of mean gene expression (checkpoint molecules and markers of T cell activation and exhaustion) and fraction of CD45+ cells from human MIBCs by snRNA-seq. i, Left, contour plot of T cells from human MIBC snRNA-seq overlaid onto an annotated UMAP as described in Methods. Right, fold change enrichment between Ylow and Yhigh MIBC T cell subsets. Tex, exhausted T cell; TFH, T follicular helper cell; TH1, T helper 1 cell; Tpex, progenitor exhausted T cell; Treg, T regulatory cell. j, Stacked bar graph of immune cell subsets and T cell differentiation states from CODEX-stained Ylow and Yhigh human MIBC tissue sections. TRM, resident memory T cell.
We next used high-dimensional spectral flow cytometry to delineate the difference in intratumoural CD45+ immune cell populations between Y+ and Y− tumours. Y− tumours were enriched in the proportion of total CD8+ T cells (Fig. 3b–e, Extended Data Fig. 5a–c and Supplementary Fig. 1) as well as immunosuppressive (CD11b+F4/80+ LY6C−CD206+) macrophages. Tumour-infiltrating macrophages in Y+ tumours had a more inflammatory (CD11b+F4/80+LY6C+CD206−) phenotype (Fig. 3b–e and Extended Data Fig. 5a–c). Of note, the percentage of PD-L1+CD45+ immune cells (Fig. 3f) and PD-L1 expression levels (Extended Data Fig. 5d) were increased in Y− tumours. We observed similar results in CRISPR Y-Scr and CRISPR Y-KO MB49 tumours, in that the CRISPR Y-KO tumours contained a greater proportion of CD8+ T cells as well as immunosuppressive CD206+PD-L1+ macrophages (Extended Data Fig. 5e,f). Consistent with these findings, increased numbers of F4/80+ macrophages and increased PD-1/PD-L1 expression were also observed histologically in Y− MB49 tissue sections using GeoMX hi-plex spatial proteomic analysis (Fig. 3g and Extended Data Fig. 6a–c).
To determine whether the TME of Y− mouse tumours reflects the clinical data, we deconvoluted RNA-sequencing (RNA-seq) data from urothelial bladder cancer in the TCGA database and mined a previously published MIBC snRNA-seq dataset30. Similar to our comparisons of Y− and Y+ MB49 cells, CD8+ T cells in Ylow tumours exhibited increased expression of immune checkpoint molecules such as CD274 (which encodes PD-L1), LAG3 and HAVCR2 (which encodes TIM3), as well as markers for both progenitor T cells (TCF7) and terminal exhausted T cells (TOX) (Fig. 3h). We then compared the proportions of these T cell subsets between tumour types by overlaying each cell sequenced with an annotated reference UMAP31. Ylow bladder cancers contained a higher proportion of exhausted and progenitor exhausted CD8+ T cells, as well as T regulatory cells (Fig. 3i). To further validate the snRNA-seq results and to assess levels of T cell exhaustion histologically, we evaluated immune-focused CODEX results from patient-matched samples30. Consistent with our spectral flow cytometry and snRNA-seq analyses, Ylow bladder cancers contained a higher proportion of dysfunctional CD8+ T cells (Fig. 3j). Of note, higher proportions of CD8+ T cells were present in Ylow than in Yhigh bladder cancer samples (Fig. 4a–c), but TOX expression was found to be higher in all intratumoural T cell subsets of Ylow tumours, including CD8+ T cells (naive-like, early activated, exhausted, progenitor exhausted and effector memory) and CD4+ T cells (T regulatory, naive-like, T follicular helper and T helper 1 cells) (Fig. 4d). Together, the data support the notion of LOY tumours promoting CD8+ T cell exhaustion in the TME.
Fig. 4 |. Human Ylow bladder cancers are enriched with CD8+ T cells with evidence of exhaustion.
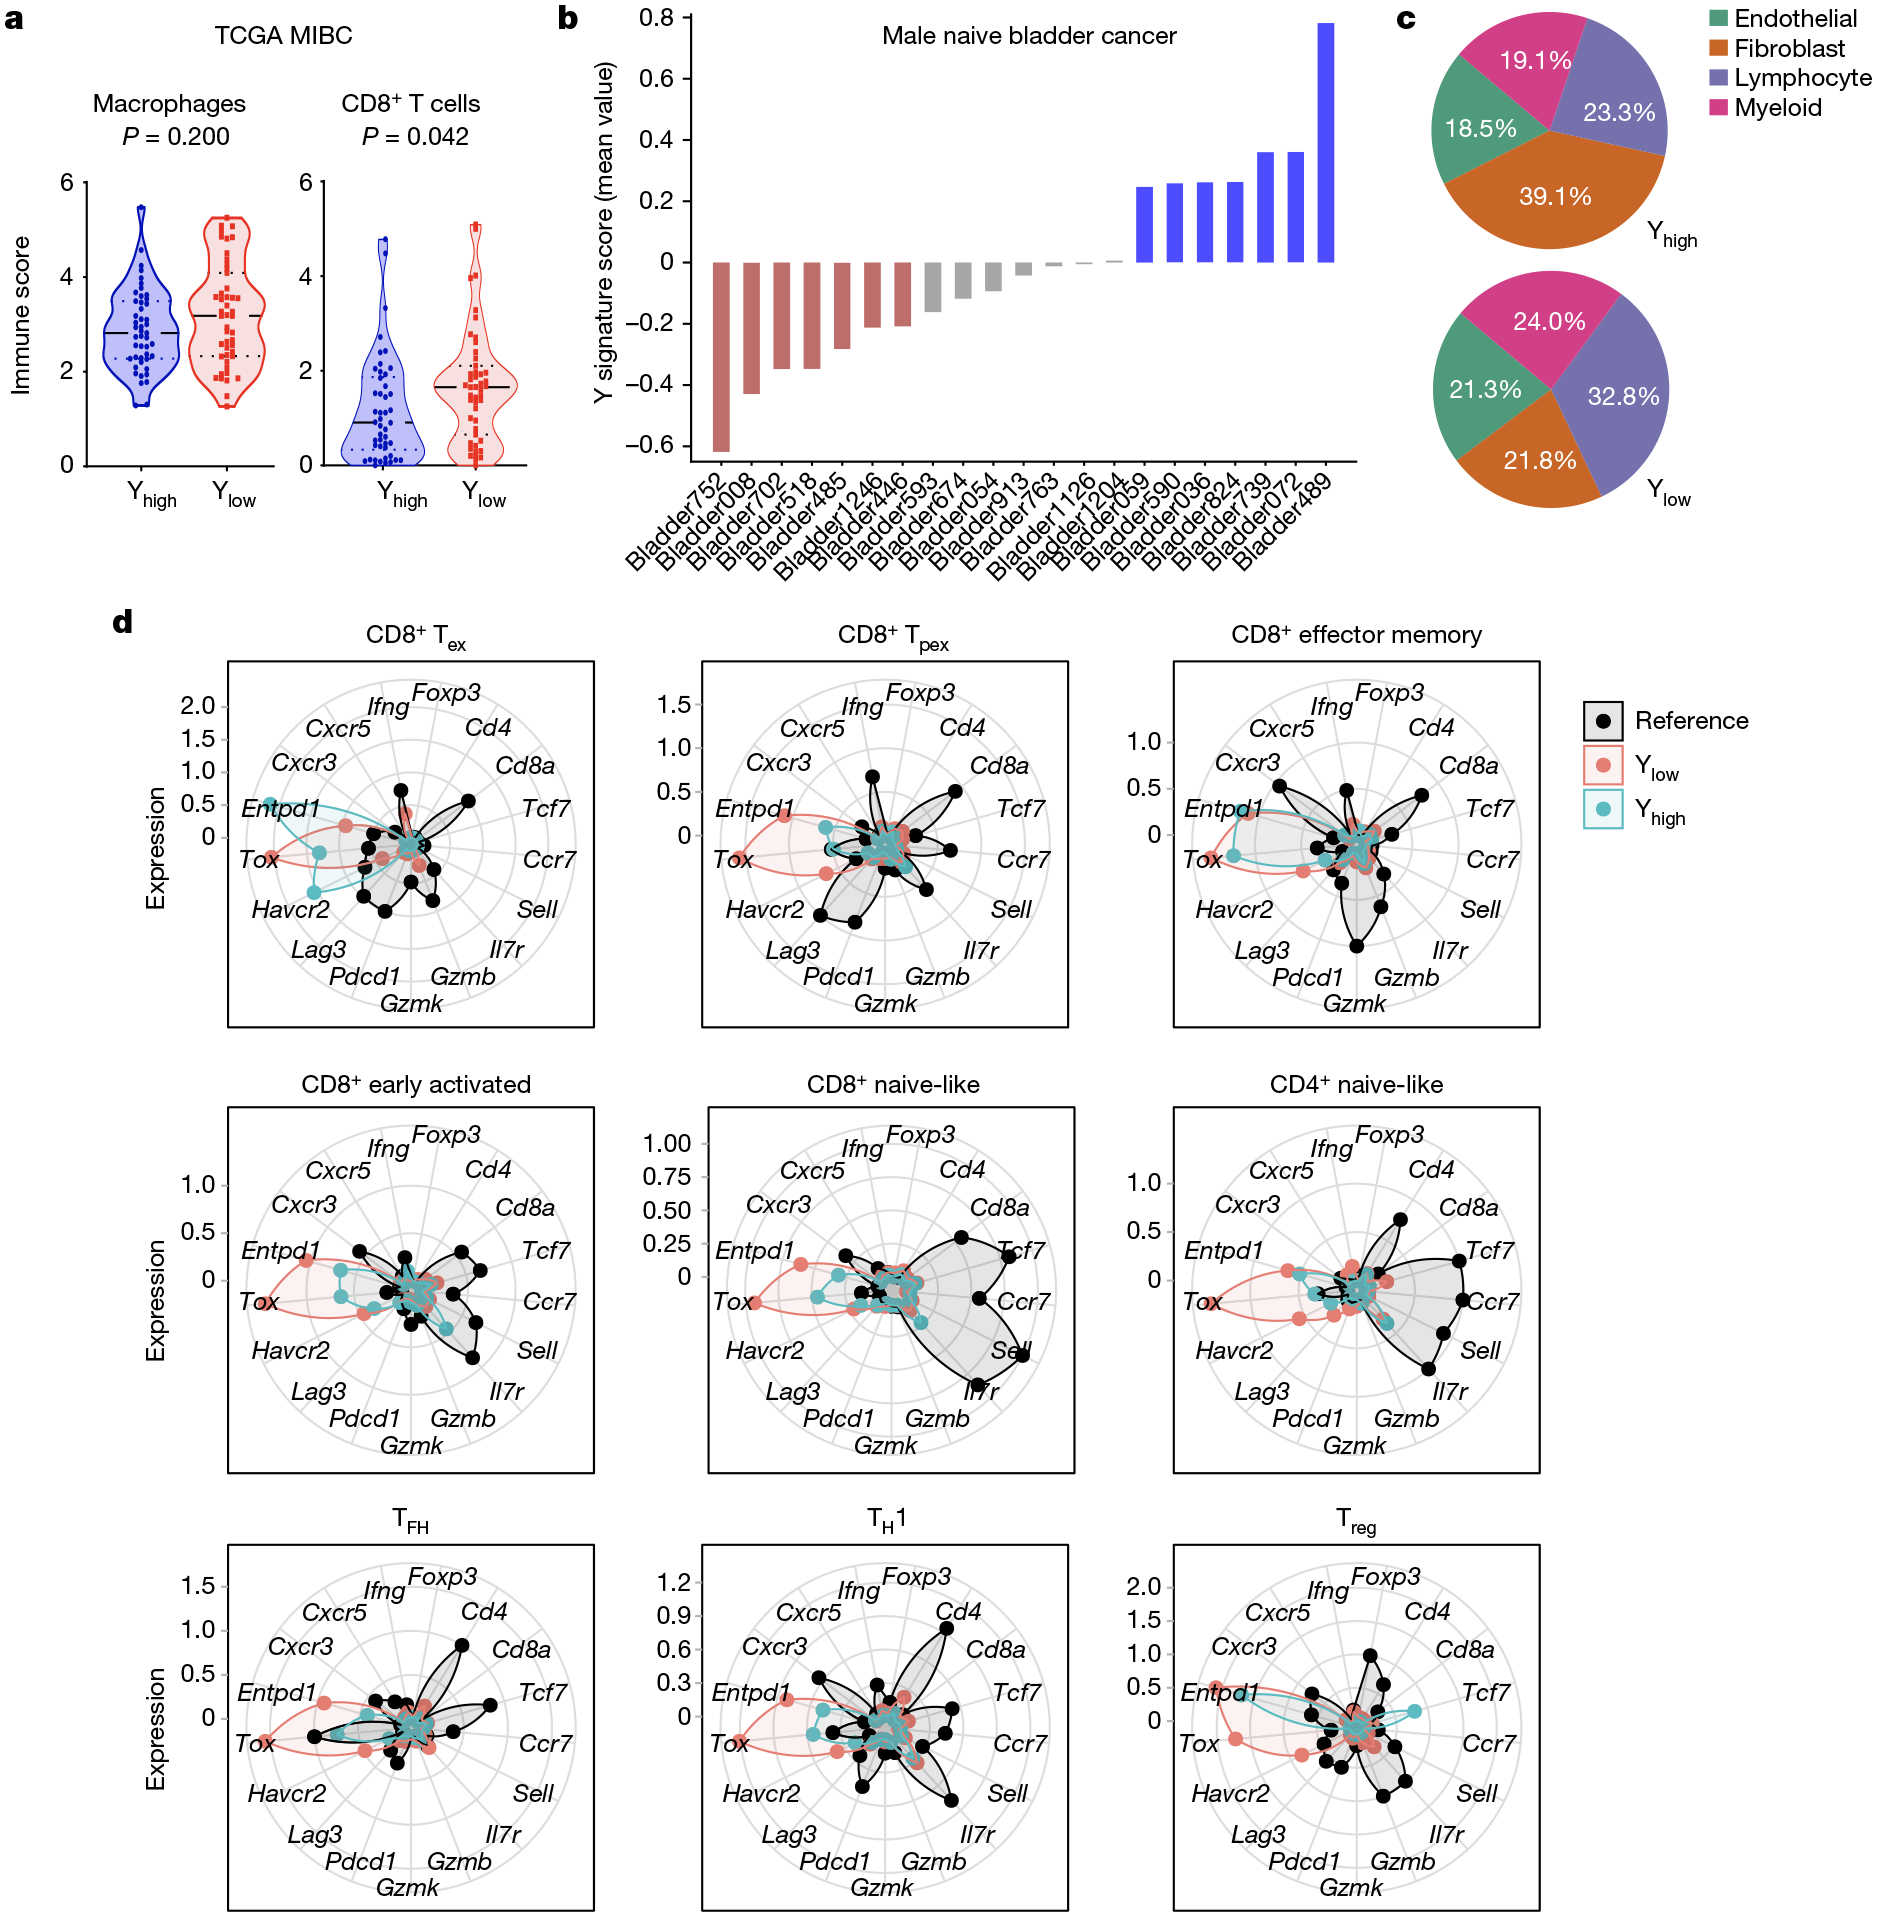
a, Violin plots of macrophages and CD8+ T cell immune scores from Yhigh and Ylow bladder cancer using urothelial bladder cancer TCGA data (n = 47 per group) and the microenvironment cell populations (MCP) counter method. Two-sided Wilcoxon rank-sum test. b, Y signature score using snRNA-seq data across 21 male naive bladder cancers. Colours denote Yhigh (blue; >0.2 mean Y signature score), Ylow (red; <0.2 mean Y signature score) and Yintermediate (grey; −0.2 to 0.2 mean Y signature score) patient samples. c, Distribution of the indicated non-epithelial immune cell types from samples described in b. d, Normalized expression of the indicated genes per T cell subtype from MIBC samples identified in b. T cells from melanoma and colon cancer samples were used to generate the reference T cell subtypes and gene expression.
Response of LOY tumours to anti-PD-1/PD-L1
Given that an increase in exhausted and progenitor exhausted CD8+ T cells in the TME is associated with an improved response to anti-PD-1/PD-L1 ICB32, we treated the Y+ and Y− MB49 lines, and the CRISPR Y-Scr and CRISPR Y-KO MB49 lines, with anti-PD-1 blocking antibodies. At the end of the course of treatment, we performed spectral flow cytometry to examine the dynamics of tumour-infiltrating CD8+ T cells with and without ICB33. Both clonally selected and CRISPR-generated Y− tumour models demonstrated an improved response to anti-PD-1 treatment compared with Y+ tumours (Fig. 5a). Consistent with our analyses of human snRNA-seq data (Fig. 3h,i), CD8+ T cells from isotype control antibody-treated Y− tumours showed increased expression of exhaustion markers such as TOX and TIM3 compared with Y+ tumours (Fig. 5b–d and Extended Data Fig. 7a). Notably, CD8+ T cells from Y− tumours exhibited a greater phenotypic response to anti-PD-1 treatment (Fig. 5d and Extended Data Fig. 7b,c)—from a more exhausted (expressing TIM3, LAG3 and TOX) to a more activated (expressing CD44, ICOS but not TOX) differentiation state (Fig. 5b,c and Extended Data Fig. 7d–f). The less aggressive nature of Y+ tumours is most apparent at earlier stages of tumour growth (Fig. 2b,e), which we attribute to a more activated lymphocytic cell state at baseline. This can be seen at both the RNA (Extended Data Fig. 4) and protein (Extended Data Fig. 7d,f) level, and is probably the reason that these tumours do not respond as well to anti-PD-1 treatment.
Fig. 5 |. Improved response of Ylow bladder cancer to anti-PD-1 ICB therapy.
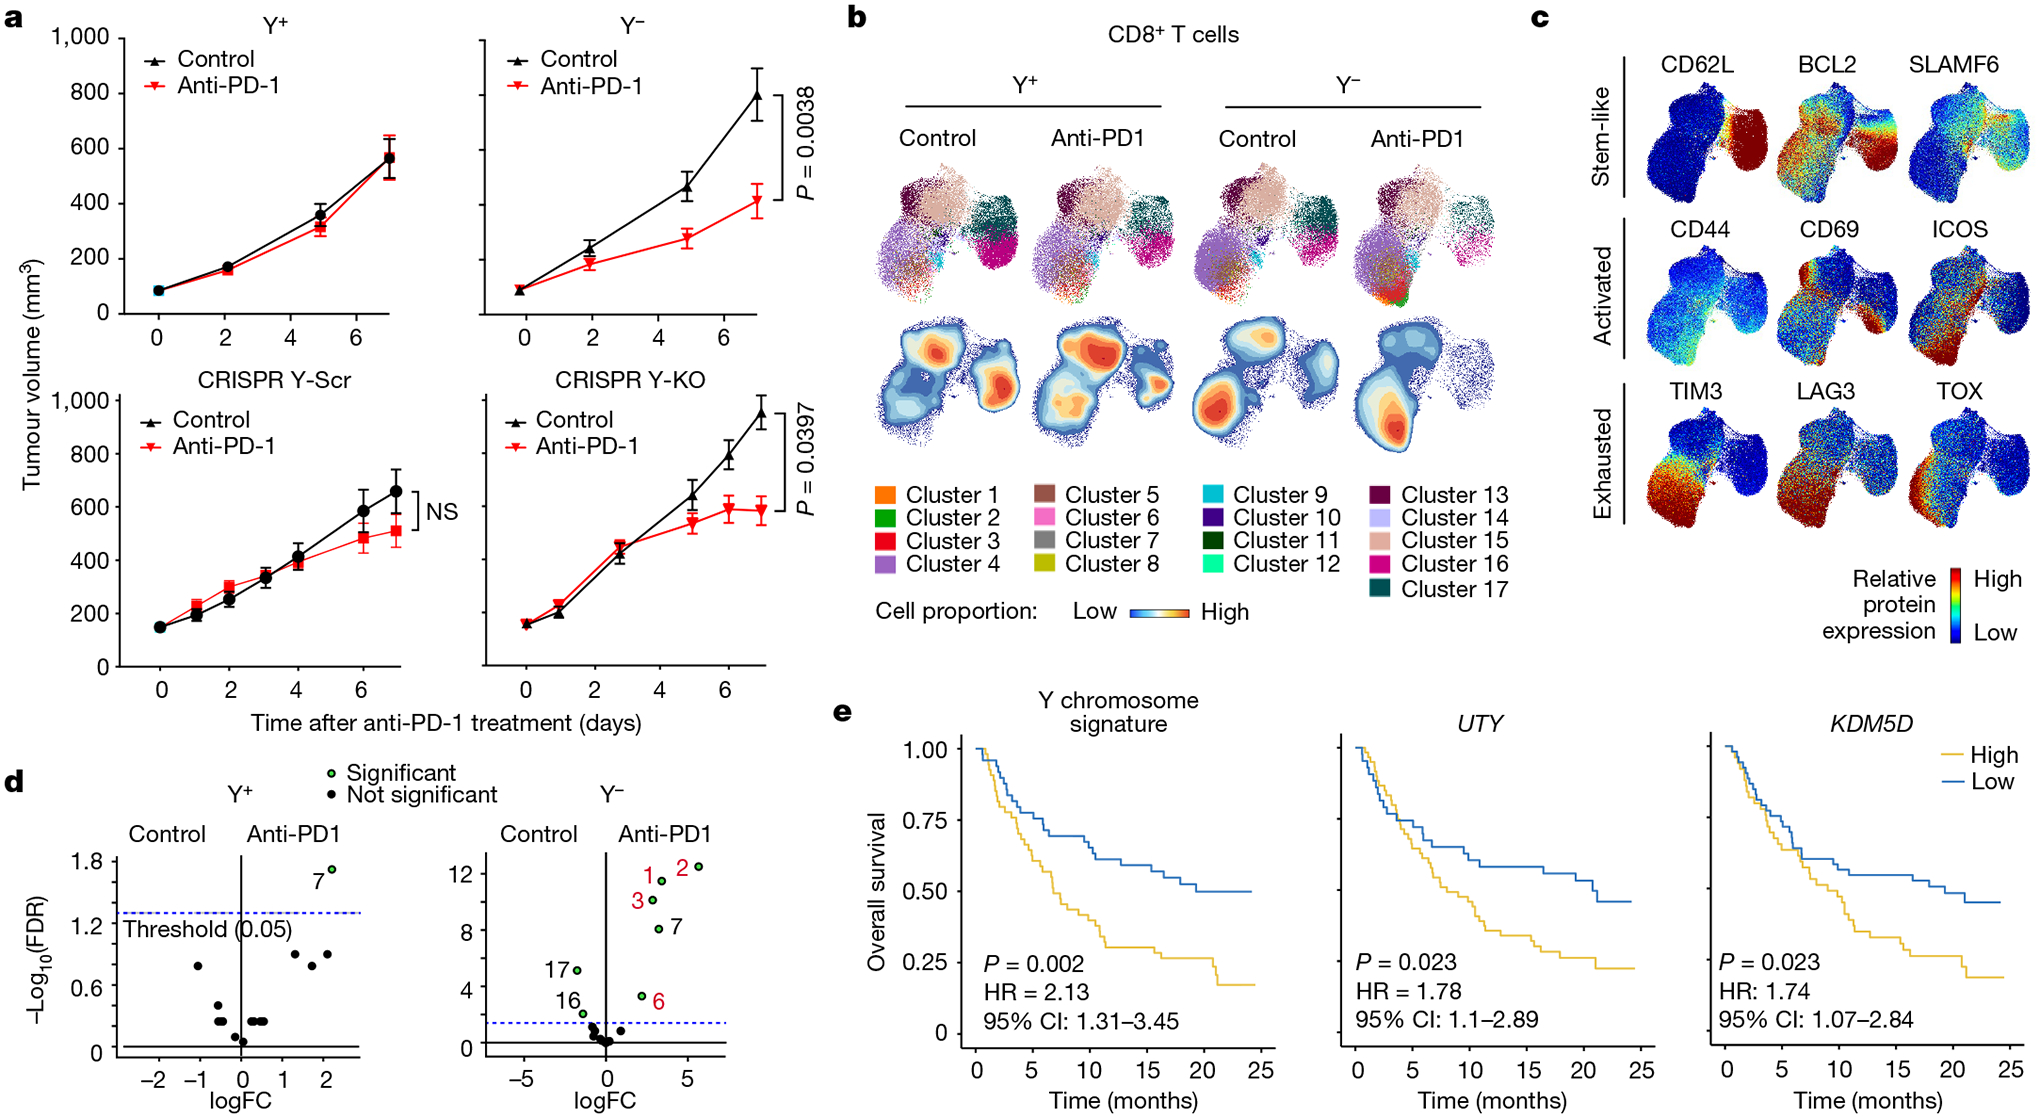
a, Tumour growth curves of Y+ and Y− (top) and CRISPR Y-Scr and CRISPR Y-KO (bottom) treated with 200 μg anti-PD-1 antibody or isotype control IgG. Y+ isotype: n = 17 mice; Y+ anti-PD-1: n = 17 mice; Y− isotype: n = 14 mice; Y− anti-PD-1: n = 16 mice. Data representative of two independent experiments. CRISPR Y-Scr isotype: n = 11 mice; CRISPR Y-Scr anti-PD-1: n = 11 mice; CRISPR Y-KO isotype: n = 15 mice; CRISPR Y-KO anti-PD-1: n = 15 mice. Repeated measures two-way ANOVA. Data are mean ± s.e.m. NS, not significant. b, UMAPs of CD8+ T cell spectral flow cytometry results from Y+ and Y− MB49 tumours seven days after treatments described in a. The UMAPs report cluster analyses (top) and cell proportions (bottom). c, UMAP heat maps of individual protein markers for stem-like, activated and exhausted T cells superimposed on the UMAPs in b. d, Volcano plot of statistically significant (green) UMAP clusters between isotype and anti-PD-1-treated Y+ and Y− MB49 tumours. e, Left, Kaplan–Meier curves for patients with Yhigh and Ylow bladder cancer treated with anti-PD-L1, from the IMvigor210 dataset. Kaplan–Meier curves for patients with bladder cancer stratified by expression of UTY (centre) and KDM5D (right). Survival differences are based on log-rank statistics.
To determine the human relevance of our preclinical work, we evaluated the overall survival of Ylow and Yhigh patients with bladder cancer from the IMvigor210 atezolizumab (anti-PD-L1) clinical trial34. Consistent with an improved response of Y− MB49 tumours to anti-PD-1 treatment, Ylow patients with bladder cancer had better outcomes after anti-PD-L1 treatment (Fig. 5e). Similar outcomes were observed if patients were stratified on the basis of UTY or KDM5D expression, underscoring the important role of these two genes in conferring the LOY phenotype (Fig. 5e). Similar to observations in our mouse models (Fig. 3f and Extended Data Fig. 5d) and evaluations of human bladder cancer specimens (Fig. 3h), PD-L1 levels were enriched in Ylow bladder cancer from the IMvigor210 trial (Fig. 6a,b).
Fig. 6 |. Increased genomic instability in Ylow bladder cancer.
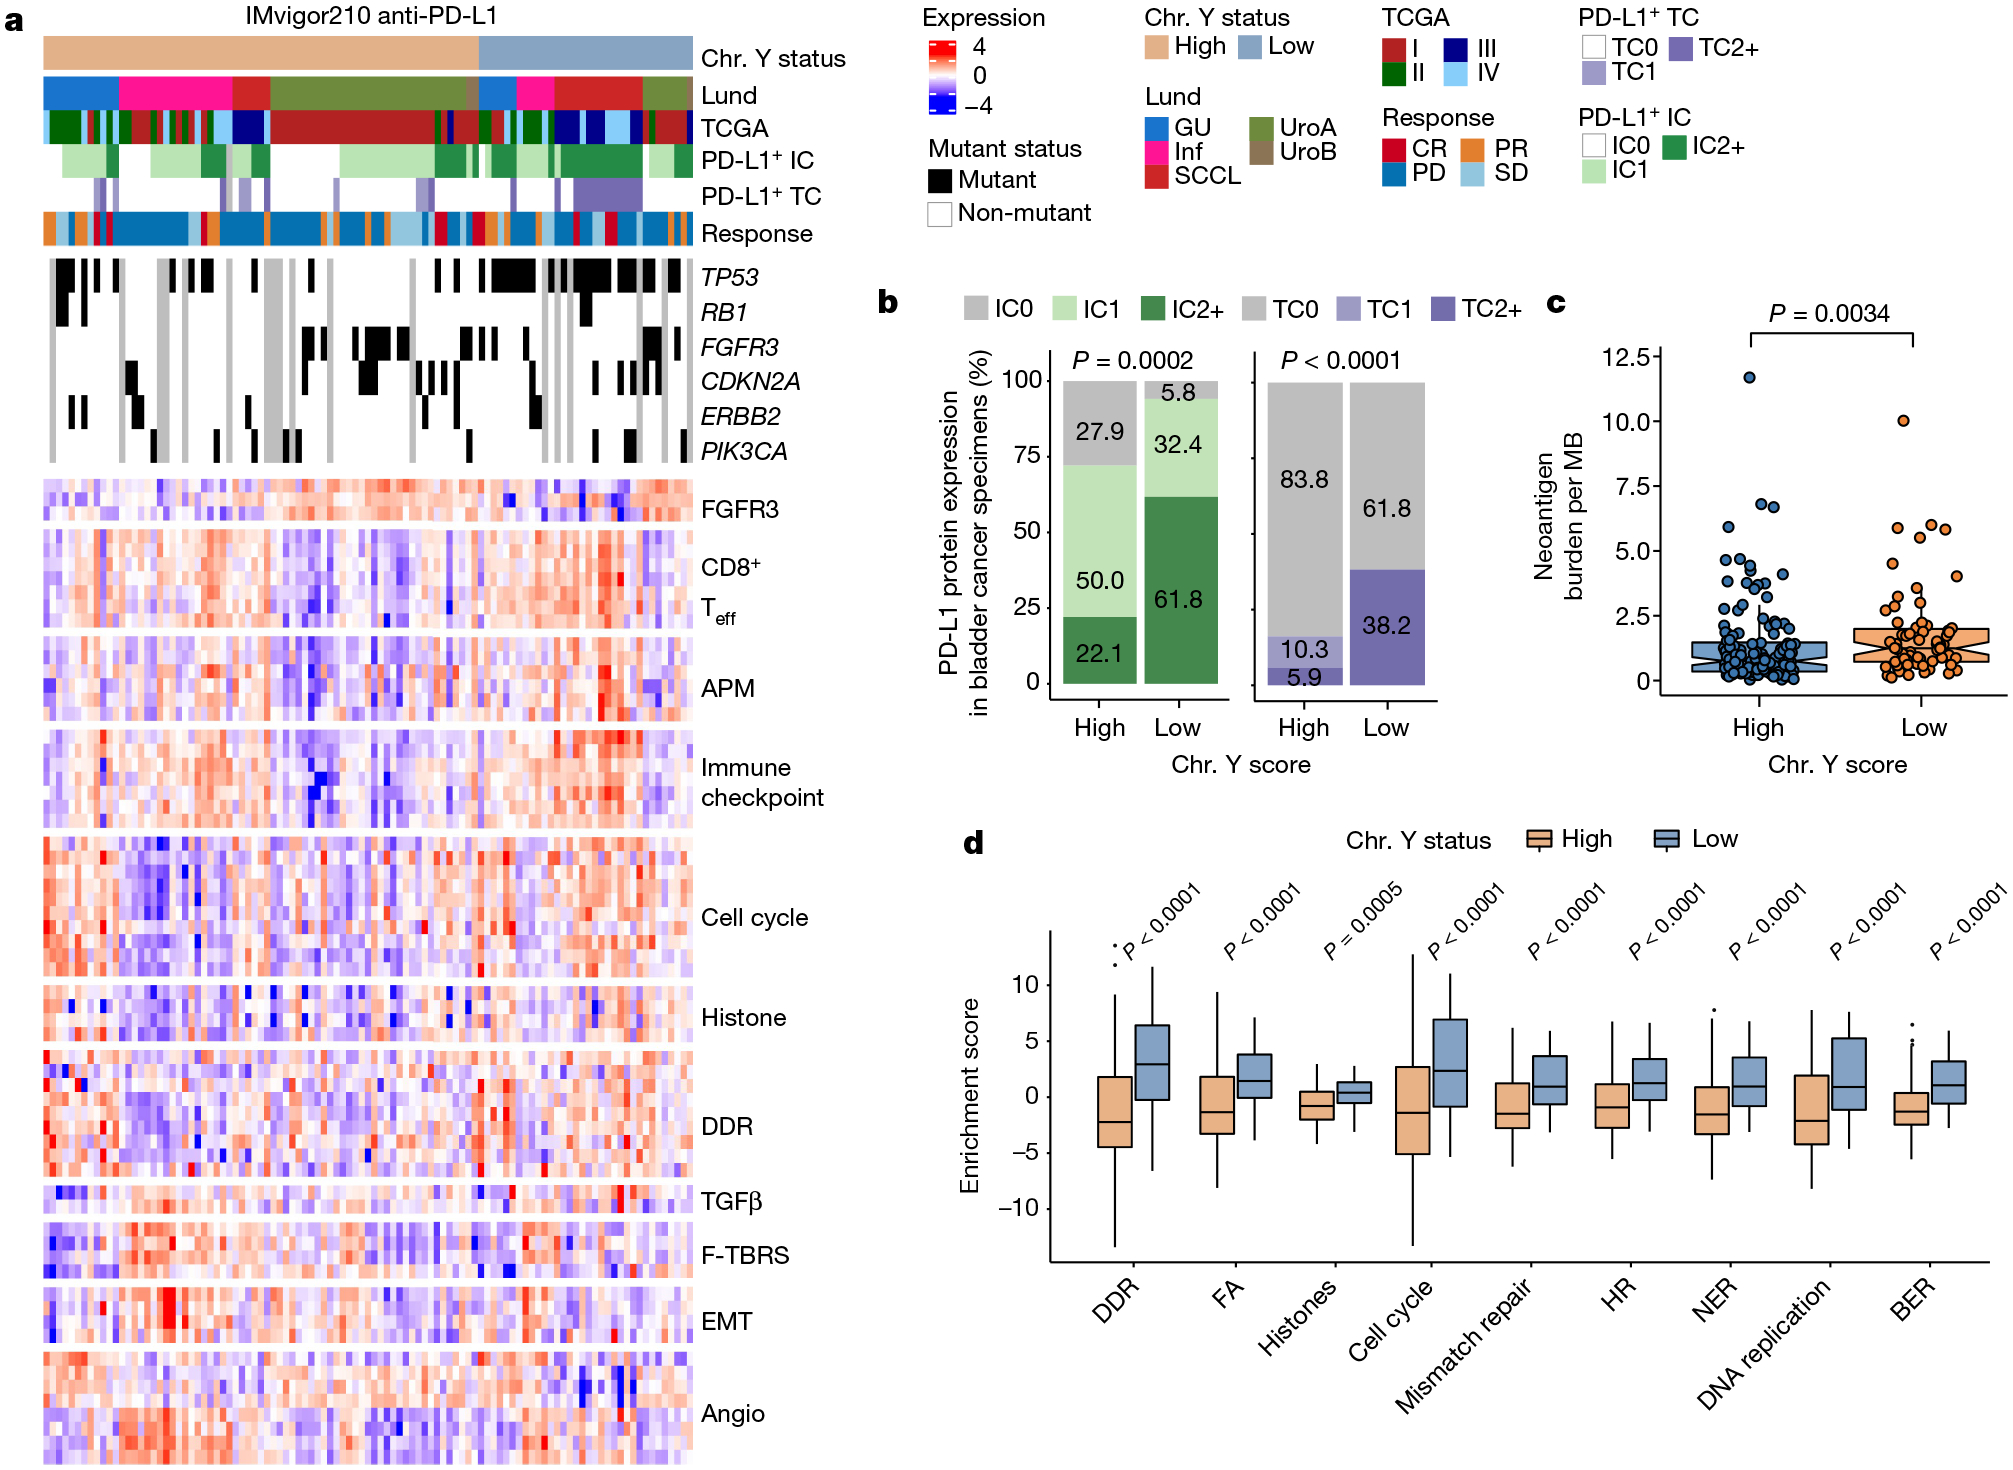
a, Heat map of the indicated pathways and associated metadata from the IMvigor210 anti-PD-L1 clinical trial. Angio, angiogenesis; APM, antigen-processing machinery; CR, complete response; EMT, epithelial-to-mesenchymal transition; F-TBRS, fibroblast TGFβ response signature; GU, genomically unstable; IC, immune cells; Inf, infiltrated; PD, progressive disease; PR, partial response; SCCL, squamous cell carcinoma-like; SD, stable disease; TC, tumour cells; Teff, T effector cells; UroA, urothelial-like A; UroB, urothelial-like B. PD-L1 immunohistochemistry scores: IC0 (<1%), IC1 (≥1% and <5%) or IC2+ (≥5%). b, Stacked bar graph of PD-L1 expression in immune cells (left) and tumour cells (right) from Yhigh and Ylow bladder cancer samples identified in a. Pearson’s Chi-squared test. c, Box plot showing neoantigen burden per megabase in Ylow (n = 67) and Yhigh (n = 129) tumours. Wilcoxon rank-sum test. d, Genomic instability pathway enrichment scores from bladder cancer described in a. Wilcoxon rank-sum test (Ylow: n = 33; Yhigh: n = 82). BER, base excision repair; FA, Fanconi anaemia; HR, homologous recombination; NER, nucleotide excision repair. In box plots, the centre line represents the mean and box edges show first and third quartiles. Minimum and maximum datapoints are included.
Of relevance, a recent report demonstrated that LOY and loss of KDM5D induced increased genomic instability in haematopoietic stem and progenitor cells35. We therefore evaluated the activation of DNA replication and repair pathways in different tumour types. The expression of markers associated with pathways including DNA damage repair (DDR), mismatch repair and nucleotide excision repair were higher in Ylow tumours (Fig. 6c,d), indicating that these tumours were indeed more genomically unstable. Further genetic evaluations of Ylow and Yhigh bladder cancer from this cohort revealed an increase in tumour neoantigen burden (TNB) in Ylow tumours that probably contributed to their increased responses to ICB (Fig. 6a,c).
Aside from an increase in TNB, we observed an increased DDR pathway activation in the Ylow TCGA tumours (Extended Data Fig. 8a–c) and in the Y− MB49 cell line (Extended Data Figs. 9 and 10). Together, these results demonstrate that LOY in bladder tumour cells contributes to the aggressive nature of Ylow bladder cancer, which can be attributed to effective evasion of T cell immunity secondary to an increased presence of PD-L1-expressing macrophages and ensuing CD8+ T cell exhaustion. Consistent with LOY tumours promoting CD8+ T cell exhaustion in the TME, we found Y− tumours to be more responsive to anti-PD-1 ICB, underscoring the translational significance of our findings.
Discussion
EDY is a male-specific signature of cancer susceptibility that is strongly linked to LOY and Y chromosome methylation patterns1. Given that bladder cancer is the fourth most common cancer in men and that LOY occurs in up to 40% of cases of bladder cancer, regardless of grade and stage36, the understanding of how LOY contributes to the poor prognoses for bladder cancer in men is an unmet medical need and a major biological question. Here we show that the aggressive behaviour of LOY bladder cancer is a consequence of T cell dysfunction. We report increased tumour-associated macrophages, high levels of immune checkpoint molecules and CD8+ T cell exhaustion in Ylow tumours. Consistent with known mechanisms of response to immunotherapy32, patients with Ylow tumours exhibit an improved response to anti-PD-1/PD-L1 ICB.
We first examined TCGA RNA-seq data for bladder cancer using a Y chromosome gene expression signature, finding that patients with LOY had a reduced overall survival following surgery. Given that the MB49 mouse bladder cancer model is widely used to investigate different aspects of bladder cancer biology and has previously been shown to lose the Y chromosome37, we used MB49 to isolate two distinct, naturally arising cell populations to represent Ylow and Yhigh tumours. Consistent with the human data, MB49 tumours with LOY grew more aggressively. Similar results were seen when knocking out UTY and KDM5D, two chromatin-modifying genes located on the Y chromosome. Overexpressing these genes in Y− cell lines rescued tumour control in the immune-competent host. Loss of UTY, the male counterpart of UTX (KDM6A) located on the X chromosome, has been reported to promote bladder cancer development36,38. Unlike UTX, UTY possesses very low demethylase activity for H3K2739, suggesting that UTY suppresses bladder cancer development in a demethylase-independent manner. By contrast, KDM5D negatively regulates the expression of genes involved in tumour cell invasion, such as matrix metalloproteinase family genes, by demethylation of their H3K4me3 marks. Downregulation of KDM5D expression increases H3K4me3 levels at target gene promoter regions, leading to a more aggressive phenotype and the development of metastasis40.
Using mouse models lacking T cells (Tcrb−/−Tcrd−/−), B cells (Ighm−/−) or both T cells and B cells (Rag2−/−Il2rg−/− or Rag2−/−), we demonstrated that the differential growth observed between Y− and Y+ MB49 tumours was T cell-dependent. Multispectral flow cytometric analysis of these tumours and in-depth analyses of human MIBC specimens using snRNA-seq and histological applications revealed that CD8+ T cells within the Y+ tumours retained their anti-tumour immunity, whereas CD8+ T cells in Y− tumours were phenotypically exhausted. Of note, the expression of TOX—a transcription factor typically known to transcriptionally and epigenetically programme CD8+ T cells towards terminal exhaustion41,42—was increased in CD8+ and CD4+ T cells in various differentiation states within Ylow bladder cancer specimens. The molecular mechanism of this effect is unclear. In particular, how the loss of Y chromosome genes from tumour cells leads to upregulation of TOX in tumour-infiltrating T cells and its role in bladder cancer progression warrants further investigation.
Our findings with LOY cancer variants were completely recapitulated with CRISPR–Cas9-mediated chromosome depletion of Y+ cells, a strong indication that the promotion of CD8+ T cell exhaustion in the TME by LOY tumours was driven entirely by the loss of the Y chromosome, and not by any cryptic clonal variations. In essence, we found that LOY tumours were able to evade adaptive immunity by promoting CD8+ T cell exhaustion. In so doing, LOY tumours were also more responsive to anti-PD-1 ICB because the primary mode of ICB is driving T cell differentiation from exhaustion to effector function. Thus, evaluation of Y chromosome gene expression—and in particular, UTY and KDM5D—could be used to select patients with bladder cancer for ICB therapy with the expectation of improved response and better survival outcomes. More speculatively, transient pharmacologic inhibition of UTY and KDM5D may offer enhanced therapeutic benefits for patients with Yhigh tumours who are undergoing ICB therapy. Future studies will be required to understand the mechanism of LOY-driven tumour evasion and to specifically define the molecular circuitry that connects the loss of UTY and/or KDM5D to CD8+ T cell exhaustion in the TME. Since age-related LOY is widespread in lymphocytes43, it will also be of benefit to investigate its effect on immune surveillance. We postulate that early LOY in tumour evolution is an adaptive strategy by tumour cells to evade immunity, with deep biological and therapeutical implications.
Methods
Cell culture
The parental MB49 cell line44 was a gift from M. Burdick. Cell lines were authenticated by morphology and WES. All cell lines tested negative for mycoplasma contamination. The MB49 Y− and Y+ sublines were cultured in DMEM supplemented with 10% fetal bovine serum (FBS) and 0.1% sodium pyruvate. NA13 cell line was isolated from N-butyl-N-(4-hydroxybutyl) nitrosamine (BBN) carcinogen-induced bladder tumours of C57BL/6 female mice45 and cultured in RPMI with 10% FBS. The E0771 breast cancer cell line E077128 (a gift from T. Lyons) was cultured in RPMI supplemented with 5% FBS. Single-cell isolations of MB49 Y− and Y+ cells were performed by serial dilution in 96-well plates.
In vivo tumour growth
Experiments were carried out at Cedar-Sinai Medical Center and The Ohio State University under protocols approved by the Institutional Animal Care and Use Committee (IACUC). Six- to eight-week-old male wild-type C57BL/6 and various syngeneic immunodeficient mice were purchased from Taconic or the Jackson Laboratory, and kept in a specific pathogen-free environment. Bladder cancer cell lines were detached, washed with PBS, and resuspended to make 106 cells per ml in phenol red-free DMEM media and left on ice. Animals were anaesthetized with isoflurane and cells were injected into the flank of each mouse subcutaneously (104 cells in 100 μl for MB49 sublines). The sample size in each experimental group was determined based on a previously published studies of similar models45. Mice were randomized to treatment groups and blinded to the researcher for the duration of the experiment. The same batch and number of cancer cells were injected per experiment, and all animals were housed under the same conditions. Investigators were blinded to group allocation during the experiment. Tumour length and width were measured using calipers, and tumour volume was calculated according to (L × W2)/2, where L is the largest diameter measurement of the tumour and W is the shortest perpendicular tumour measurement45. All analysis was performed consistently during all studies and all tumour counts were performed by the same investigator. For experiments involving PD-1 blockade, mice were treated with anti-PD-1 (200 μg, BioXCell clone 29F.1A12X) or isotype control IgG (200 μg) every 3 days starting when tumours reached ~100 mm3.
Isolation of tumour-infiltrating T cells and high-dimensional flow cytometry
Endpoint Y+ and Y−, as well as CRISPR Y-Scr and CRISPR Y-KO MB49 tumours were mechanically disrupted and subjected to digestion via 1 mg ml−1 Collagenase D (Roche) for 30 min at 37 °C with agitation. Two percent bovine serum albumin in ice-cold PBS was used to inactivate enzymatic activity. Red blood cell lysis buffer (BioLegend) was used before cells were passed through 70 μm filters to generate single-cell suspensions. Cells were then stained at 4 °C with LIVE/DEAD blue fixable viability dye for 15 min (Invitrogen), followed by extracellular surface markers and FcR block concurrently for 40 min. All intracellular staining was performed using the FoxP3 transcription factor staining kit (Invitrogen) according to the manufacturer’s instructions. All results were acquired on the Cytek Aurora, and fluorochrome-conjugated antibody panels were applied as previously described33,46. To analyse spectral flow cytometry results, live CD45+ singlets were gated from samples stained with the ‘all immune phenotyping’ flow antibody panel (Fig. 3 and Supplementary Table 2) and live CD45+CD11b−CD4−CD8+CD3+ singlets were gated from samples stained with the ‘T cell exhaustion’ panel (Fig. 5) using OMIQ to generate the presented UMAPs and heat maps.
In vitro cell proliferation and colony formation assays
Cell proliferation of MB49 sublines was determined using methyl thiazolyl diphenyl-tetrazolium bromide (MTT, Sigma). Different cell numbers (200–25,000) were seeded into 96-well plates with 150 μl of medium per well. Cells were assessed daily over an 8-day time course by adding MTT solution (1.25 mg ml−1 in DMEM) to cultures at a 1:1 ratio and incubating for two hours at 37 °C. Lysis buffer was added to dissolve the formazan crystals. Absorbance was read at 570 nm by a plate reader (BioTeK). MTT assays were performed three times in triplicate for each cell line tested. To check if Y chromosome specific genes were involved in anchorage-independent growth, soft agar colony formation assays were performed as previously described47. In brief, 15,000 cells per well in a 0.4 % agar (Sigma) were plated in triplicate in 6-well plates and cultured at 37 °C for 2 weeks. Colonies were stained with Nitro-BT (Sigma), and the images of the plates were captured under a microscope and analysed using ImageJ software.
Total RNA extraction and RT–qPCR
RNA was extracted from subcutaneous Y+ and Y− tumours or cell lysate using a RNeasy plus Mini Kit with gDNA Eliminator (Qiagen). Library preparation and RNA-seq was performed by Novogene (Sacramento, CA). cDNA was synthetized using Maxima H Minus cDNA Synthesis Master Mix (Thermo Scientific). Quantitative PCR was then performed using Quant Studio 6 Flex Real-Time PCR system (Applied Biosystems) via powerUp SYBR Green Master Mix (Applied Biosystems). Forward and reverse primer pairs used in RT–qPCR experiments are listed in the table below. To determine the changes in mRNA expression measured by RT–qPCR, the ΔΔCt method was used. β-actin served as an internal control. The genes (forward primer/reverse primer) used are as follows: Gapdh (AACTTTGGCATTGTGGAAGG/ACAC ATTGGGG GTAGGAACA), Actb (TCATGAAGTGTGACGTTGACATCCGT/CCTAGAAGCATTTGCGGTGCACGATG), Kdm5d (CATGTAAAGGAGATAAGGAACT/ATGAATGCGCTCAGATTGGG), Sry (TCCTCAAAAGAAACCGTGCAT/AGATTAATGGTTGCTAAGGACTGGAT), Ssty1 (CTGGAGCTCTACAGTGATGA/CAGTTACCAATCAACACATCAC), Eif2s3y (ATCTTGTCCTCAACCTCAGACT/TTCTTTAGCCTGGCTTTCTTTCA), Uty (TGGCCCTGATCGACTGTAAT/TGGTGCATCCAACCTAACTG), Ddx3y (TGTTAGTTGCCACACCAGGACG/TGGTGGCATTGTGTCCTGCTCA) and Rbmy (TGCTGGCTATCTTGGAGGACGT/GCGGTTGTTTCCACCTCT TGCA).
RNA-seq data analysis
Illumina Truseq adapter, polyA, and polyT sequences were trimmed with cutadapt v2.348. Trimmed reads were aligned to mouse genome version 38 (mm10) using STAR aligner v2.7.0d_022149 with parameters according to the ENCODE long RNA-seq pipeline (https://github.com/ENCODE-DCC/long-rna-seq-pipeline). Gene expression levels were quantified using RSEM v1.3.150. Ensembl gene annotations (version 84) were used in the alignment and quantification steps. RNA-seq sequence, alignment and quantification quality was assessed using FastQC v0.11.5 and MultiQC v1.8 (ref. 51). Biological replicate concordance was assessed using PCA and pairwise Pearson correlation analysis. Low expressed genes were filtered out by applying the following criterion: estimated counts (from RSEM) ≥ number of samples × 5. Filtered estimated read counts from RSEM were compared using the R Bioconductor package DESeq2 v1.22.2 based on generalized linear model and negative binomial distribution52. Genes with Benjamini–Hochberg corrected P value < 0.05 and fold change ≥ 1.5 or ≤ −1.5 were selected as DEGs.
Engineering of UTY and KDM5D expression in MB49 cells CRISPR–Cas9 editing of UTY and KDM5D in Y+ MB49 cells.
CRISPR–Cas9 KO plasmids were purchased from Santa Cruz. UTY CRISPR–Cas9 KO plasmid (m2) was a pool of 3 different guide RNA (gRNA) plasmids: A, sense: TCTTTAATAGTAAAAGCTGA (sc-423636-KO-2); B, sense: GATG AAGACGCTGTTGAACA (sc-423636-KO-2); and C, sense: ACAGTTT ACAGACTGACTAC (sc-423636-KO-2). KDM5D (SmcY) CRISPR–Cas9 KO plasmid (m) was a pool of three different gRNA plasmids: A, sense: GGACCTTTACAGCCTTAATA (sc-423031); B, sense: TTCAGTTGCTAC AGTAGACG (sc-423031); and C, sense: TCATTTAGCCTCTGAATTCG (sc-423031). The control was a non-targeting gRNA (not targeting any known gene; sc-418922). CRISPR–Cas9 plasmids were transfected into Y+ MB49 cells using UltraCrus transfection reagent according to the manufacturer’s instruction (Santa Cruz). Forty-eight hours after transfection, the medium was aspirated and replaced with fresh medium containing puromycin for selection. For validation of knockout cells, single cells were isolated as described above. RNA from each clone (using a RNeasy kit) was used to validate knockout of UTY or KDM5D.
Overexpression of UTY and KDM5D in MB49 Y− cells.
Plasmid ps100001 from Origene was used to overexpress KDM5D and UTY. Empty vector served as the negative control. Lipofectamine 3000 (Thermo Fisher) was used for all transfections according to the manufacturer’s protocol. Forty-eight hours after transfection, the medium was replaced with fresh medium containing neomycin for selection.
Genomic DNA isolation and whole-exome sequencing.
Genomic DNA was isolated from parental, Y− and Y+ MB49 cell lines using a kit from Invitrogen (catalogue no. K1820) according to the manufacturer’s instructions. DNA samples were submitted for sequencing at Novogene. Library preparation, sequencing and bioinformatics analysis were performed by Novogene. In brief, all samples were sent for WES and the sequencing data processed using the GATK best practice workflow53. The genomic DNA was randomly sheared into short fragments, end-repaired, A-tailed, and ligated with Illumina adapters. After PCR amplification, size selection, and purification, we proceeded with the hybridization capture of libraries. The captured libraries were enriched by PCR amplification and checked with Qubit and bioanalyzer for quality control. The libraries were then pooled and sequenced on Illumina platforms using the PE150 strategy. We mapped the paired-end clean reads to the mouse reference genome (Mouse, NCBI37/mm9) using BWA, sorted them with Sambamba, and marked duplicates with Picard. Finally, we computed the coverage and depth, and tested for SNP and InDel detection.
Generation of the CRISPR–Cas9-mediated Y chromosome KO MB49.
Plasmids: gRNA targeting the centromere of the Y chromosome (LOY_gRNA1_fwd CACCGGAGTTAATATAAAAAACA and LOY_gRNA1_rv AAACTGTTTTTTATATTAACTCC) alongside the non-targeting control gRNA (Control_(Neo)_gRNA1_fwd CACCGGCAGCGCGGCTATCGTGGC and Control_(Neo)_gRNA1_rv AAACGCCACGATAGCCGCGCTGCC) were a gift from K. Walsh9. LentiCRISPRv2 neo, Cas9 plasmid #98292; pLKO5.0.sgRNA.EFS.tRFP, plasmid #57823; psPAX2; plasmid #12260; and pMD2.G, plasmid #12259 were purchased from Addgene.
For lentivirus production, HEK 293T cells were seeded at a density of 4 × 10⁶ cells per 10 cm2 plate in DMEM + 5% FBS and incubated at 37 °C, 5% CO2. The plasmids (5 μg of lentiCRISPRv2 neo or pLKO5.0.sgRNAs. EFS.tRFP, 4.17 μg psPAX2, and 0.83 μg of pMD2.G per plate) were co-transfected using HEK 293T cells with Trans-IT transfection reagent (Mirus). Culture supernatant was collected 48 h after transfection, centrifuged, and filtered through a 0.45-μm filter. To Generate Cas9-stable Y+ MB49 cells, Y+ MB49 cells were transduced with lentivirus containing Cas9 plasmid (lentiCRISPRv2 neo) and selected with Geneticin (G418). Given that the LOY gRNA plasmid also contains a turbo red fluorescent protein (tRFP) marker, we sorted the cells based on tRFP 48 h after transduction into 96 wells using BD Symphony S6 cell sorter for further culturing. Single-cell clones were expanded and screened for knockout of the Y chromosome by RT–qPCR. Control cells were generated by transducing Cas9 Y+ MB49 cells with control gRNA.
Nanostring GeoMx digital spatial profiling
Haematoxylin and eosin (H&E) images of Y+ and Y− MB49 tumours were demarcated by a clinical pathologist (Cedars-Sinai Biobank Core) for regions in each core to generate a tumour microarray (TMA). Five-micrometre sections were cut from the TMA block, stained and analysed on the Nanostring GeoMx digital spatial profiling platform at the Cedars-Sinai Biobank Core per the manufacturer’s instructions54. The protein panel consisted of 68 antibodies, including mouse immune cell profiling, immuno-oncology drug targets, immune activation, immune cell typing, pan-tumour and cell death markers (Extended Data Fig. 6a). S6 ribosomal protein and histone 3 were included in the panel as housekeeping proteins.
One region of interest (ROI) per core was selected by aligning fluorescent images with H&E images predetermined by a pathologist. Regions with blood vessels and necrosis were kept to a minimum. ROI selection on each TMA core was performed such that 660-μm circles were segmented into cytokeratin+ (tumour) and cytokeratin− (stroma) regions. Barcodes from these regions were collected to generate measurements per compartment. Barcodes were sequenced, mapped, and counted by next-generation sequencing (NGS) readouts as per manufacturer’s instructions. Antibody barcodes were counted on an Ncounter platform per manufacturer’s instructions, enabling quantitative comparisons of antibodies between ROIs in Y+ and Y− subcutaneous tumours.
The GeoMx digital spatial profiling analysis suite (GEOMX-0069) allowed inspection, quality control (QC), normalization, and differential expression to be performed. In brief, normalization using Histone H3 and S6 proteins was performed. Differential expression between paired compartments was evaluated by paired t-tests with a Benjamini–Hochberg correction, while differential expression between unpaired compartments was performed by a Mann–Whitney test with Benjamini–Hochberg correction. GraphPad prism software version 8.0 (GraphPad Prism) was used for all of the statistical analyses. The student’s two tailed t-test was used to analyse all comparisons, with a Bonferroni adjustment for multiple comparisons when appropriate.
Y signature score
A gene expression signature score was created based on 18 Y-encoded genes expressed in normal bladder urothelium as previously reported (Extended Data Fig. 1b)2,21. The Y signature was obtained by the single sample gene set enrichment analysis55 (ssGSEA, package GSEApy v0.10.1) according to 18 important Y chromosome genes expressed in each of the bulk RNA-seq samples from TCGA data, IMvigor210 cohorts, and the E-MTAB-4321 cohort. For the snRNA-seq dataset, we used Scanpy (scanpy.tl.score_genes function; scanpy v1.9.1)56 to get the Y signature for each patient. The score is the average expression of a set of genes subtracted by the average expression of a reference set of genes which is randomly sampled from the gene pool for each binned expression value. Y chromosome signature scores were compared to two virtual karyotyping techniques, EDY using TCGA RNA data1 and MADLOY using TCGA DNA sequencing data24.
Gene set enrichment analysis
Genes that were differentially expressed in specific sample groups were identified using DESeq2 software (version 1.26.0)52 with the Wald test by using a design formula that included batch effect correction. Benjamini–Hochberg correction was used for multiple testing in all instances. We performed gene set enrichment analysis (GSEApy v0.10.1)55 to identify significantly differentially enriched pathways between the Y+ and Y− MB49 cell lines and tumours. The gene ontology gene set in the MSigDB database was used as the reference gene set. The default weighted enrichment statistical method was applied to the enrichment analysis, and the number of the gene set permutations for each analysis was set at 1,000. Statistical significance was set at a |normalized enrichment score| > 1, nominal P value < 0.05.
Human bladder cancer RNA-seq datasets
We performed differential gene expression analyses on publicly available urothelial bladder cancer datasets from the IMvigor210 clinical trial57, TCGA and NMIBC E-MTAB-4321 datasets58. For the analysis involving IMvigor210, only male pre-chemotherapy bladder cancer samples were used. Objective response rate, important signature score and survival data for each male patient was extracted using the R package IMvigor210CoreBiologies. For the TCGA analysis, the data levels, and the files contained in each data level package, are described below and are present on the NCI Genomic Data Commons. We estimated cell population abundance in the TCGA MIBC samples using the MCP counter method, which uses transcriptomic data to deconvolute and quantify the abundance of various immune cell types59. For the snRNA-seq analyses, data for 21 treatment-naive male patients with MIBC from our previous study30, with surgery (transurethral resection of bladder tumour or cystectomy) as their only treatment, can be downloaded from the Gene Expression Omnibus (GSE169379 and GSE171351) in our previous study. To explore this transcriptional heterogeneity, we classified single cells using the ProjecTILs60 T cell atlas derived from tumour-infiltrating T cells. The atlas consists of 16,803 high-quality single-cell transcriptomes from 25 samples (B16 melanoma and MC38 colon adenocarcinoma tumours) from six different studies61–67.
CODEX
We obtained our patient-matched CODEX data from our same bladder cancer snRNA-seq study30, Processed CODEX data can be downloaded from https://figshare.com/s/4610a15363c8306dfa36, https://figshare.com/s/2005255a8b65de23109f and https://figshare.com/s/1d8c7ed76d4b3222ada4.
The CODEX technology enables highly multiplexed analysis for up to 40 proteins using cyclic detection of DNA-indexed antibody panels. In this study, CODEX was grouped according to Y signature, which was obtained based on the snRNA-seq data of 21 male patients with bladder cancer. Seven patients with high scores were selected as the Yhigh group (>0.2 mean Y signature score) and 7 patients with low scores were selected as the Ylow group (<0.2 mean Y signature score). CODEX-stained cells were manually gated based on the intensity of PanCytoK, CD45, aSMA, CD31, CD20, CDH12, CDH18, CD68, CD3e, CD8 and CD4 into a training set consisting of broad cell types: epithelial, epithelial KRT, epithelial CDH, stromal, endothelial, general CD45+ immune, B cell, CD8+ T, CD4+ T and macrophage.
Kaplan–Meier analyses
Clinical outcomes were assessed using Kaplan–Meier survival curves and log-rank or Cox statistics. Kaplan–Meier survival analysis was performed using the survminer package in R software. The function surv_cutpoint in the R package survminer was implemented to discover the optimal cut-off value for the Y chromosome signature. This R package determines the optimal cut-off point for one or multiple continuous variables at once, using the maximally selected rank statistics from the maxstat R package. This is an outcome-oriented method providing a value of a cut-point that corresponds to the most significant relation with survival.
Quantification of tumour neoantigen burden
For each patient in the IMvigor210 and TCGA databases, we first enumerated a list of all possible 9 and 10-mer peptides bearing somatic mutations or overlapping open reading frames derived from frameshifting indels or nonstop mutations. These peptides were then evaluated for binding against the patient’s inferred HLA type using the NetMHCpan-3.0 algorithm68. The neoantigen load was defined as the total number of predicted peptide:allele binders with a rank percentile score less than or equal to the weak binder threshold (2%).
Statistical analyses
The statistical tests employed, the number of replicates, and independent experiments are specified in the text and figure legends. Basic statistical analysis was performed using GraphPad/Prism (v.9.0), while R (versions 4.1.2 or 4.2.3) and Python 3.9.4 were used for analyses of epidemiological and mutation and sequence data. Prior to conducting any statistical test, a Kolmogorov–Smirnov normality test was performed, and Bartlett or Levene tests were used to evaluate the assumption of homogeneity of variances. The unpaired Student’s t-test was applied to normally distributed variables, while the Mann–Whitney U test (also known as the Wilcoxon rank-sum test) was employed for non-normally distributed variables. Pearson’s Chi-squared test was used for analysing categorical data, with the R function chisq.test used for chi-squared analyses and wilcox.test used for Wilcoxon rank-sum tests. Significance levels were denoted using asterisks, with NS indicating non-significance. In cases where multiple hypotheses were tested, FDR correction was applied. Data analysis software such as Scanpy (v.1.7.2), Pandas (v.2.0.0), Conda (v.4.11.0), NumPy (v.1.24.2) and Scipy (v.1.10.1) was used. The R package ComplexHeatmap (v.2.11.1) was used to generate heat maps, while ggplot2 (v.3.3.5), ggpubr (v.0.6.0), and ggrepel (v.0.9.2) R packages were used for general visualization purposes.
Reporting summary
Further information on research design is available in the Nature Portfolio Reporting Summary linked to this article.
Extended Data
Extended Data Fig. 1 |. LOY is associated with a worse clinical outcome for patients with MIBC and NMIBC.
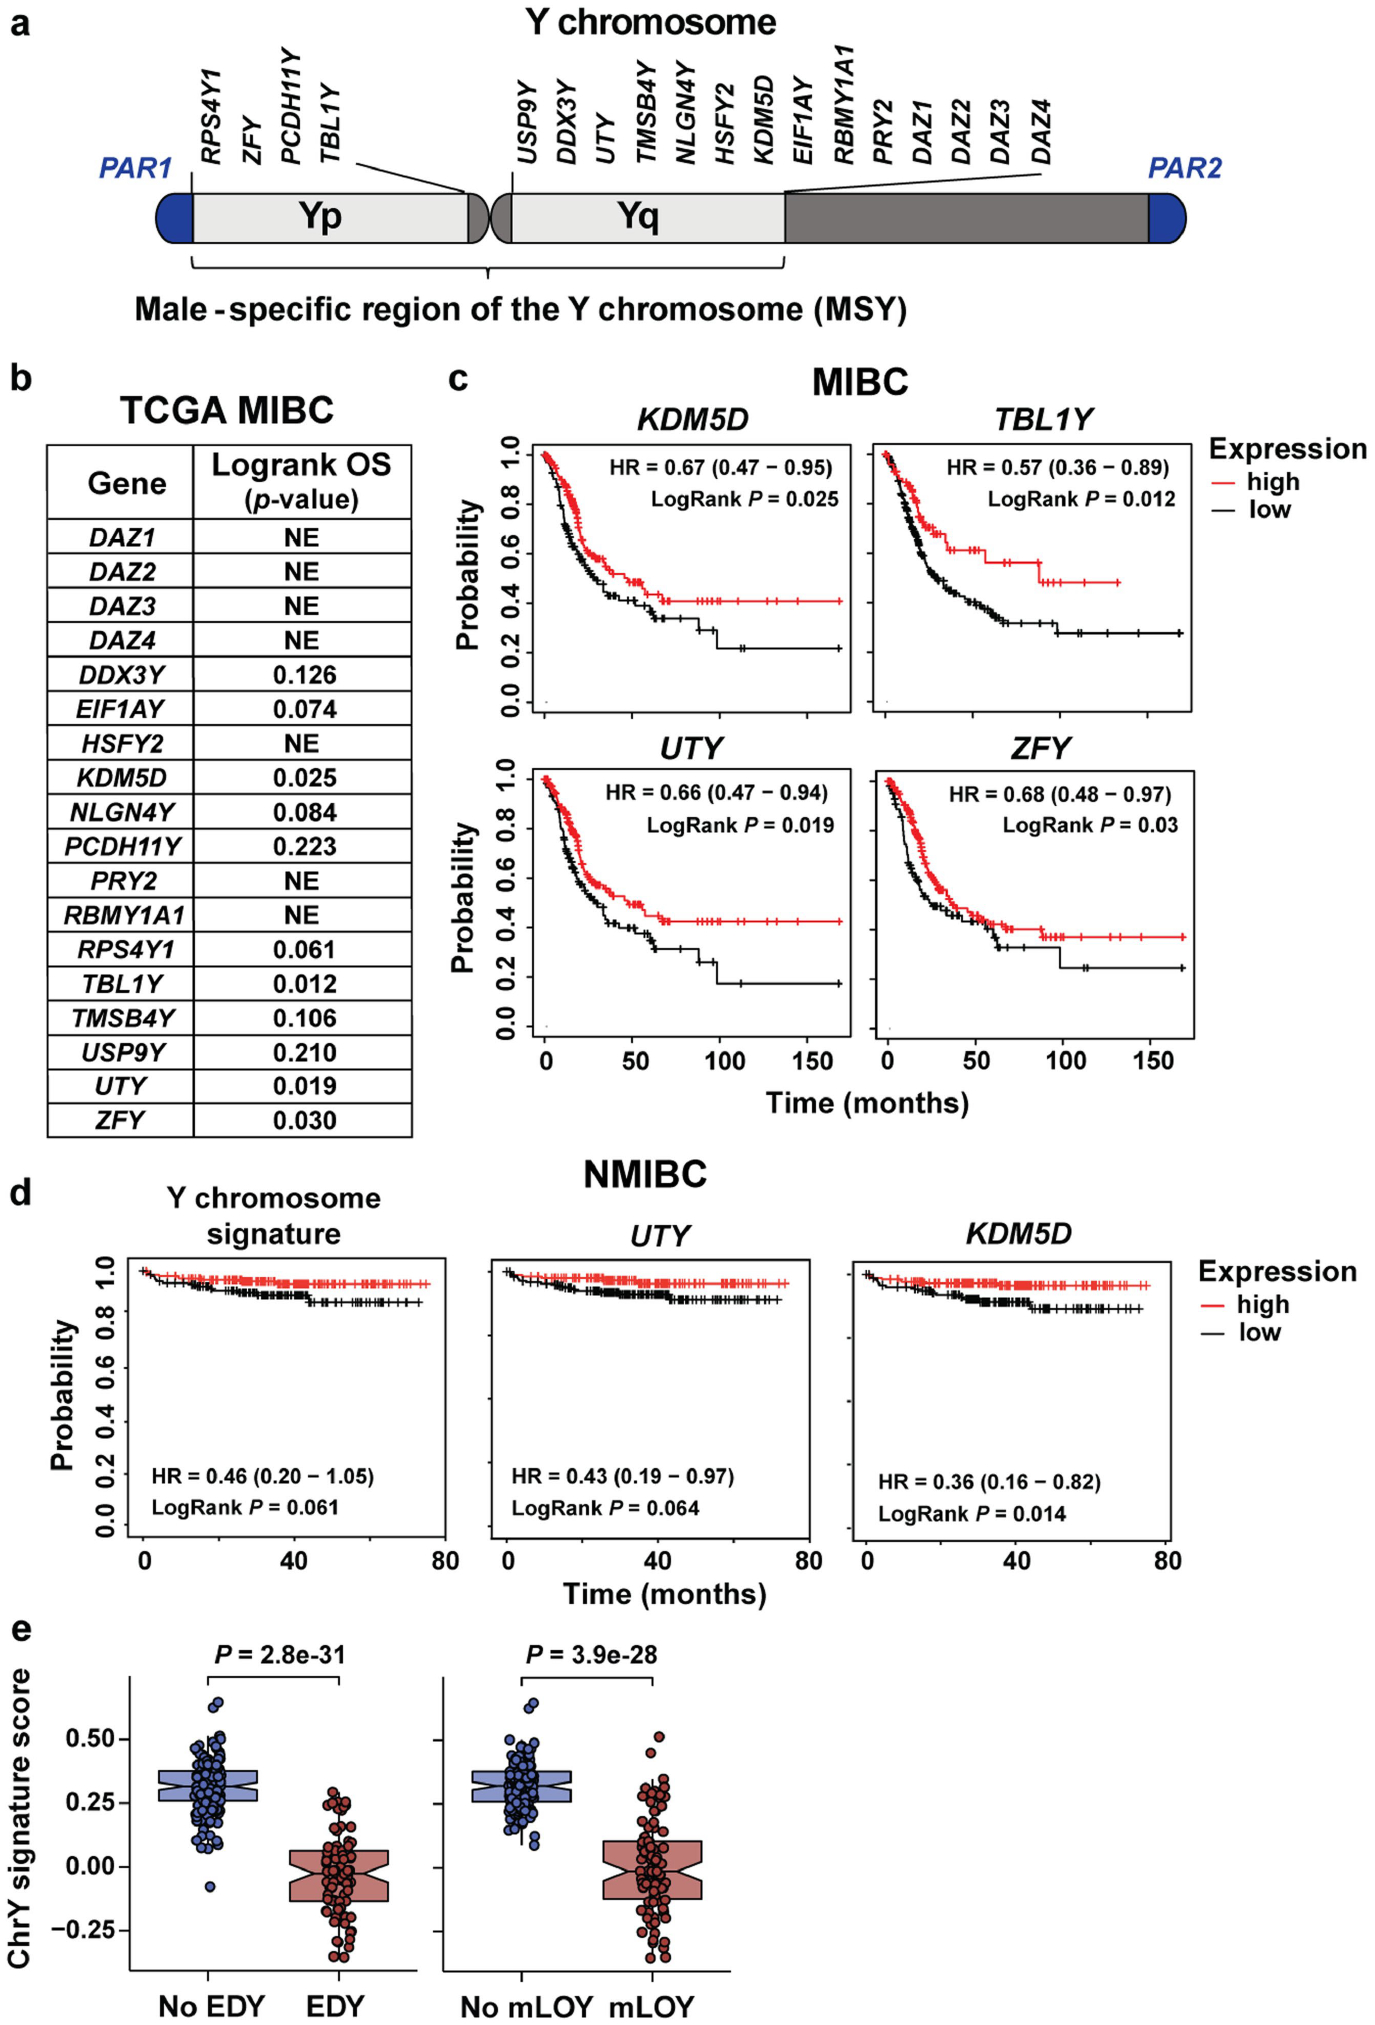
a, Y chromosome genes expressed in normal bladder urothelium that were used to create a Y chromosome gene expression signature. b, Logrank p-values based on stratification by Y chromosome gene expression (normalized FPKM) on TCGA MIBC patient overall survival (OS). Genes resulting in statistically significant OS are plotted in panel c. NE, not expressed. c, Kaplan-Meier plots of OS from TCGA data for males with MIBC and either high or low KDM5D, TBL1Y, UTY (KDM6C), or ZFY expression. d, Kaplan-Meier survival curves stratified by the Y signature score or expression levels for UTY and KDM5D in NMIBC from the E-MTAB-4321 cohort. Survival differences are based on Logrank statistics. e, ChrY gene expression signature scores of TCGA data plotted with respect to extreme downregulation of chromosome Y (EDY, left panel) and Mosaic Alteration Detection for LOY (mLOY, right panel) levels. Statistical significance was determined by Wilcoxon rank-sum test (NoLOY n = 151, LOY n = 90, NoEDY n = 165, EDY n = 76). Boxplots represent the mean with first and third quartile data. Minimum and maximum datapoints are included.
Extended Data Fig. 2 |. Generation of Y+ and Y- BC models.
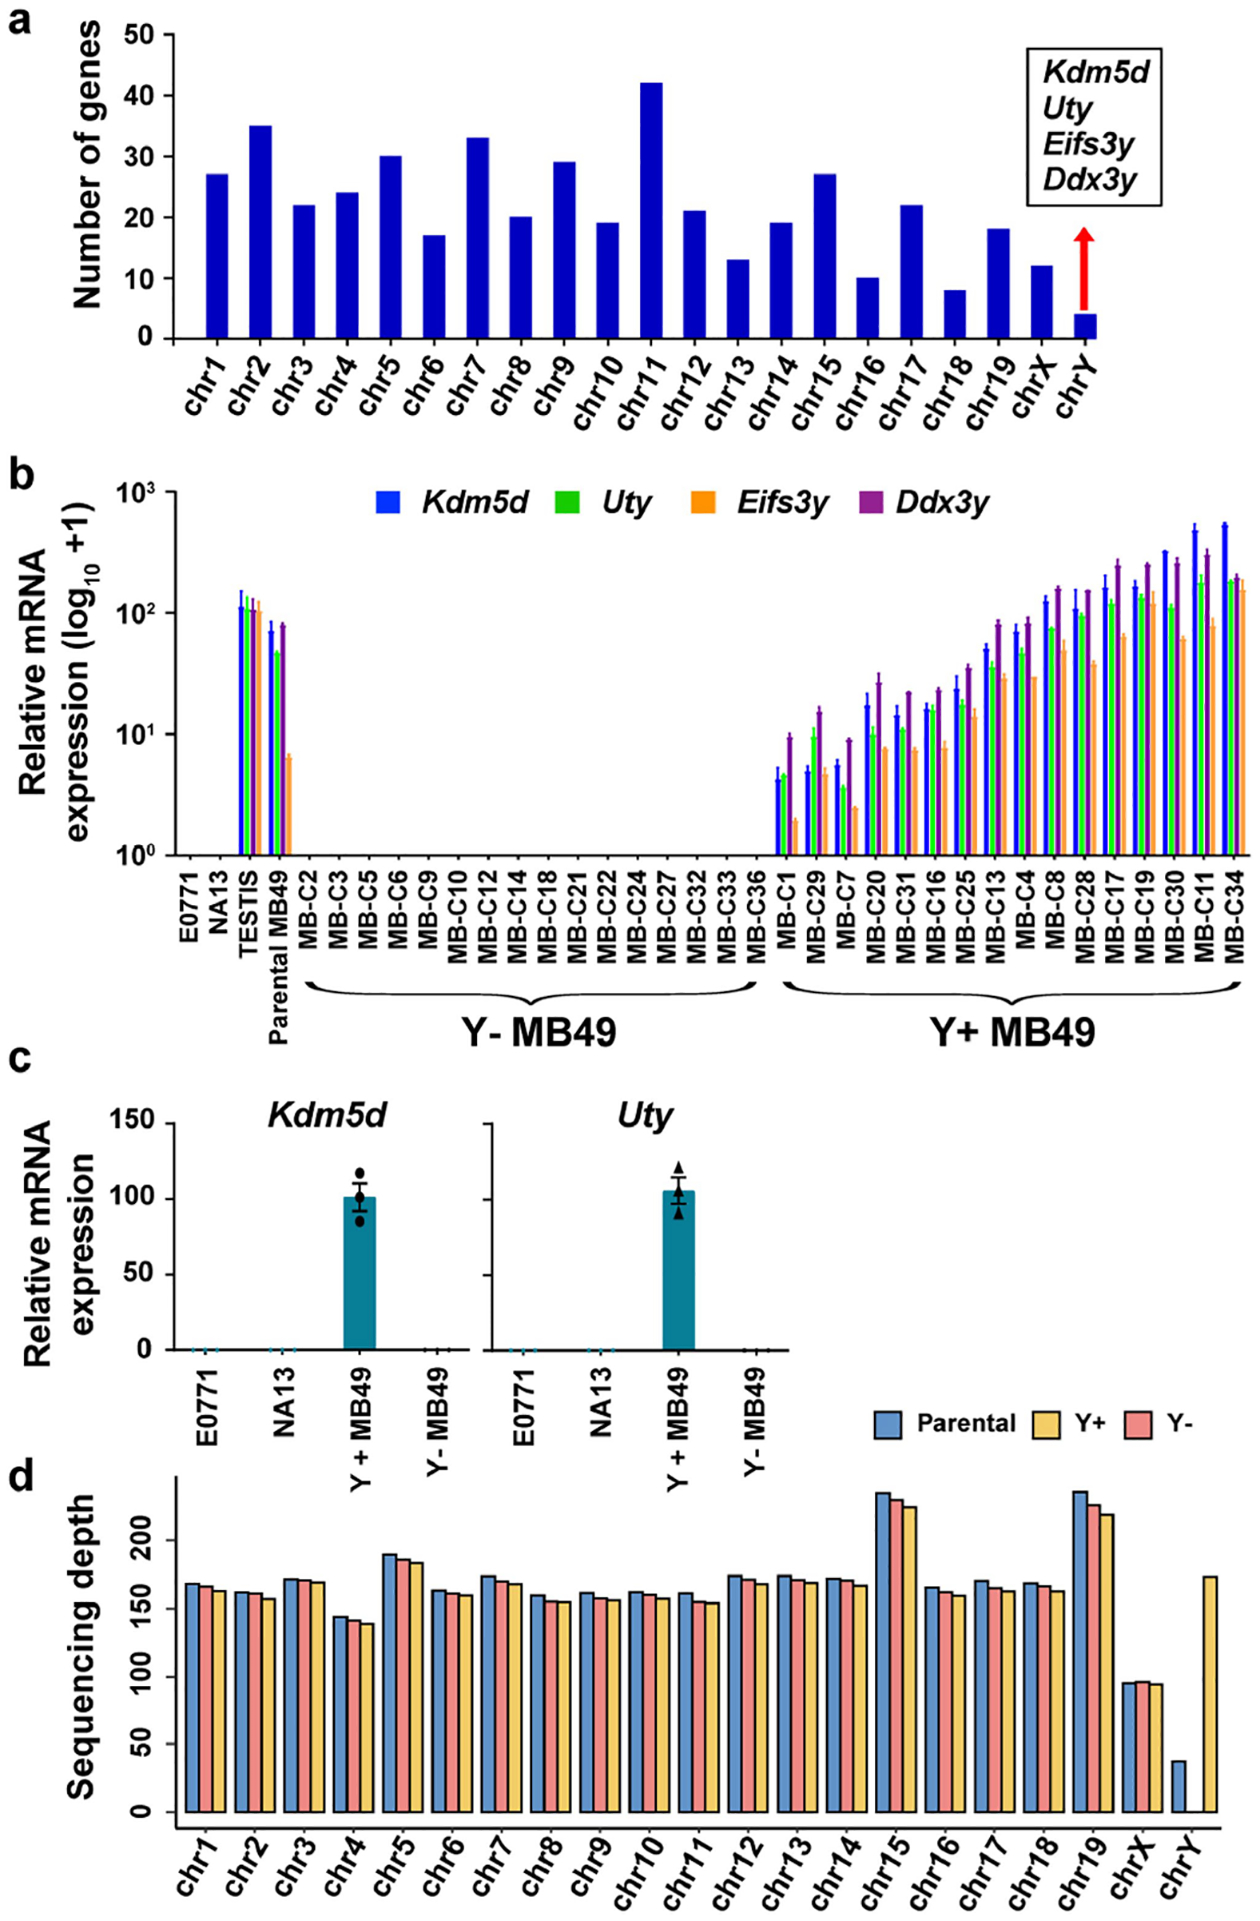
a, Histogram representation of deferentially regulated genes (DEG) from Y+ vs. Y− MB49 RNAseq data per mouse chromosome. b, qRT-PCR analysis of Uty, Kdm5d, Eifs3y, and Ddx3y expression in MB49 clones isolated from the parental MB49 compared to female murine breast cancer (E0771) and bladder cancer cells (NA13), and testis tissue. Curly brackets indicate the clonal lines used to generate the pooled Y+ and Y− MB49 sublines. c, qRT-PCR analysis of Uty and Kdm5d expression in the pooled Y+ and Y− sublines described in a. n = 3 biological replicates. Data are mean ± s.e.m. d, Bar graph of sequencing depth for each chromosome after performing whole exome sequencing (WES) on DNA from the Parental, Y−, and Y+ MB49 cell lines.
Extended Data Fig. 3 |. LOY has no effect on colony forming ability of BC in vitro.
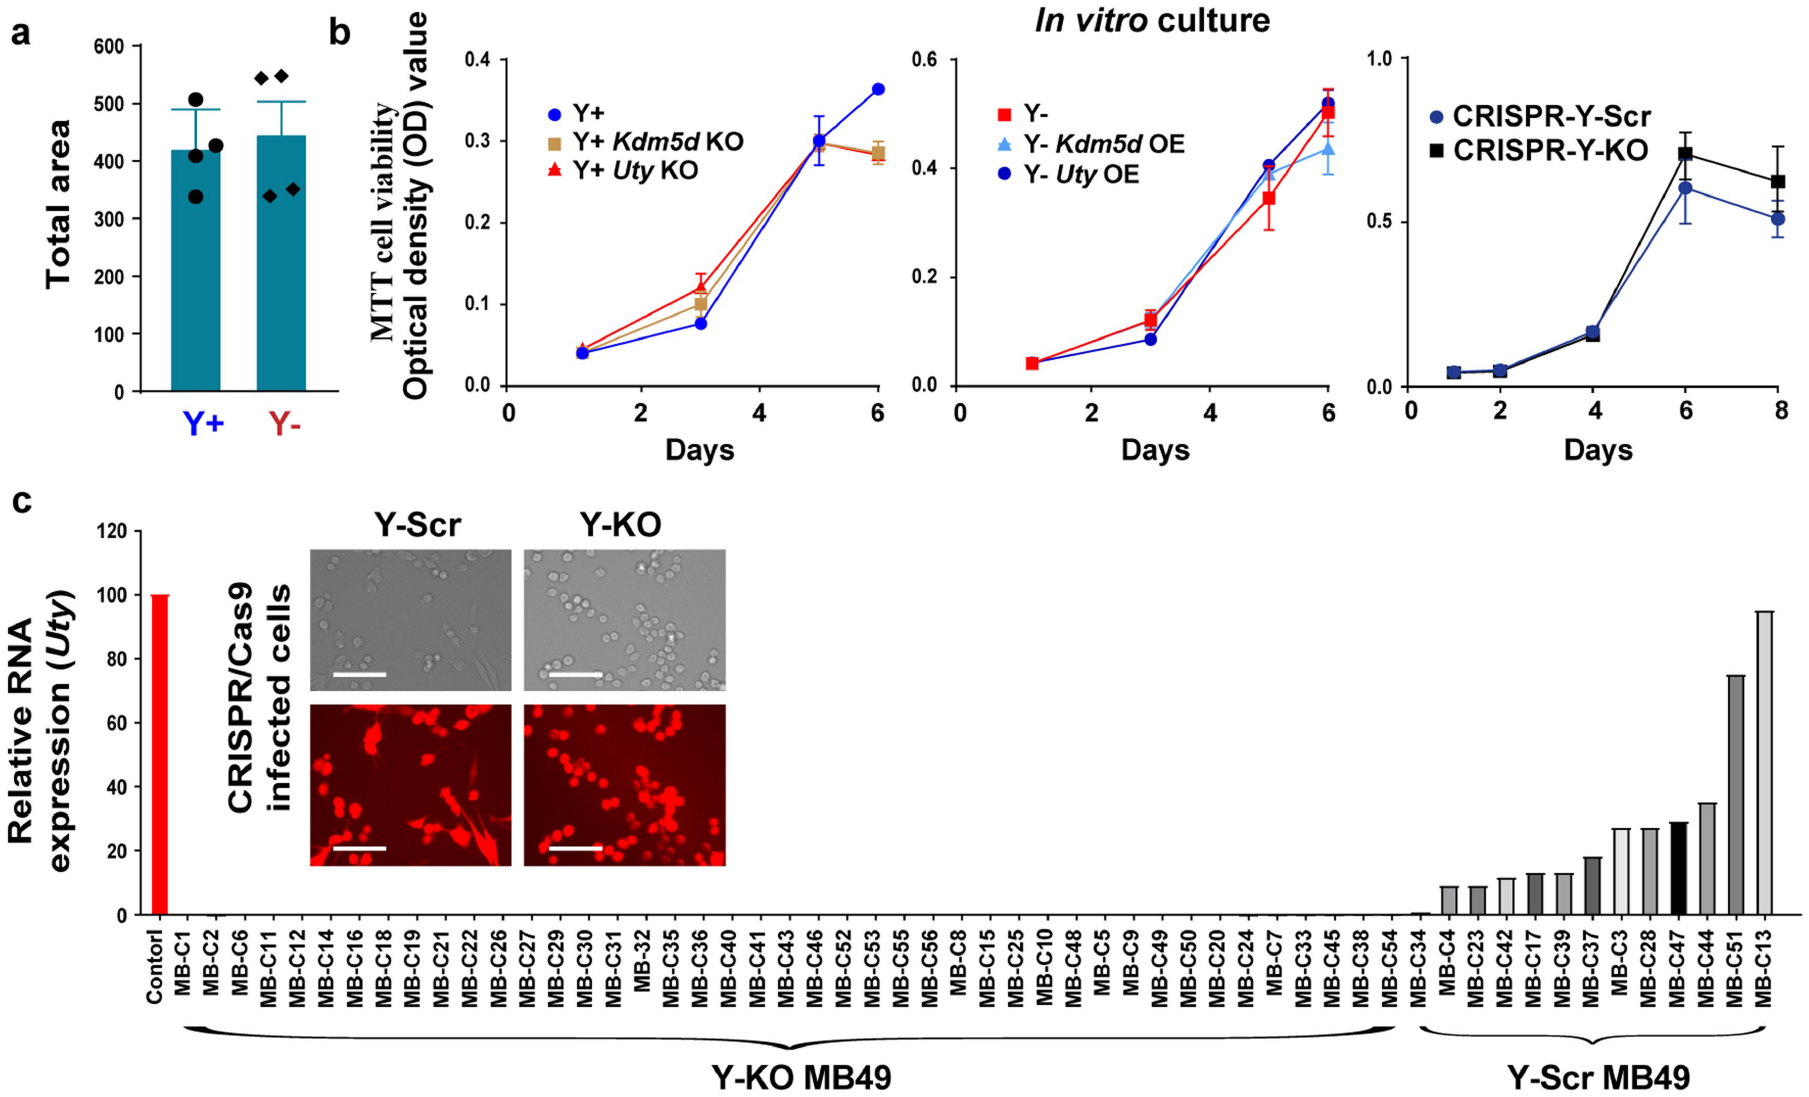
a, MB49 Y+ and Y− cells were grown in 0.4% agar for two weeks. Colonies were stained with Nitro-BT and quantified using ImageJ. Average colony number and area were determined from those with a diameter that exceeded 100 μm (n = 4 biological replicates). Data representative of three independent experiments. Statistical significance was determined by two-sided unpaired t-test, P-value = 0.722. Data are mean ± s.e.m. b, In vitro cell proliferation (MTT cell viability) over a 6–8-day time course using three sets of genetically engineered MB49 cells: Y+, Y+ Kdm5d KO, Y+ Uty KO (left panel), Y−, Y− Kdm5d OE, Y− Uty OE (middle panel), and CRISPR-Y-Scr vs. CRISPR-Y-KO (right panel). n = 3 biological replicates. Data are mean ± s.e.m. c, qRT-PCR analysis of Uty expression in MB49 clones isolated from the CRISPR-generated Y-KO and Y-Scr MB49 cell lines. Curly brackets indicate the clonal lines used to generate the pooled Y+ Control and Y− KO MB49 sublines. Representative immunofluorescence images of the CRISPR-generated Y-KO and Y-Scr MB49 cell lines. Scale bar, 150 μM.
Extended Data Fig. 4 |. Increased lymphocyte activation in Y+ tumors.
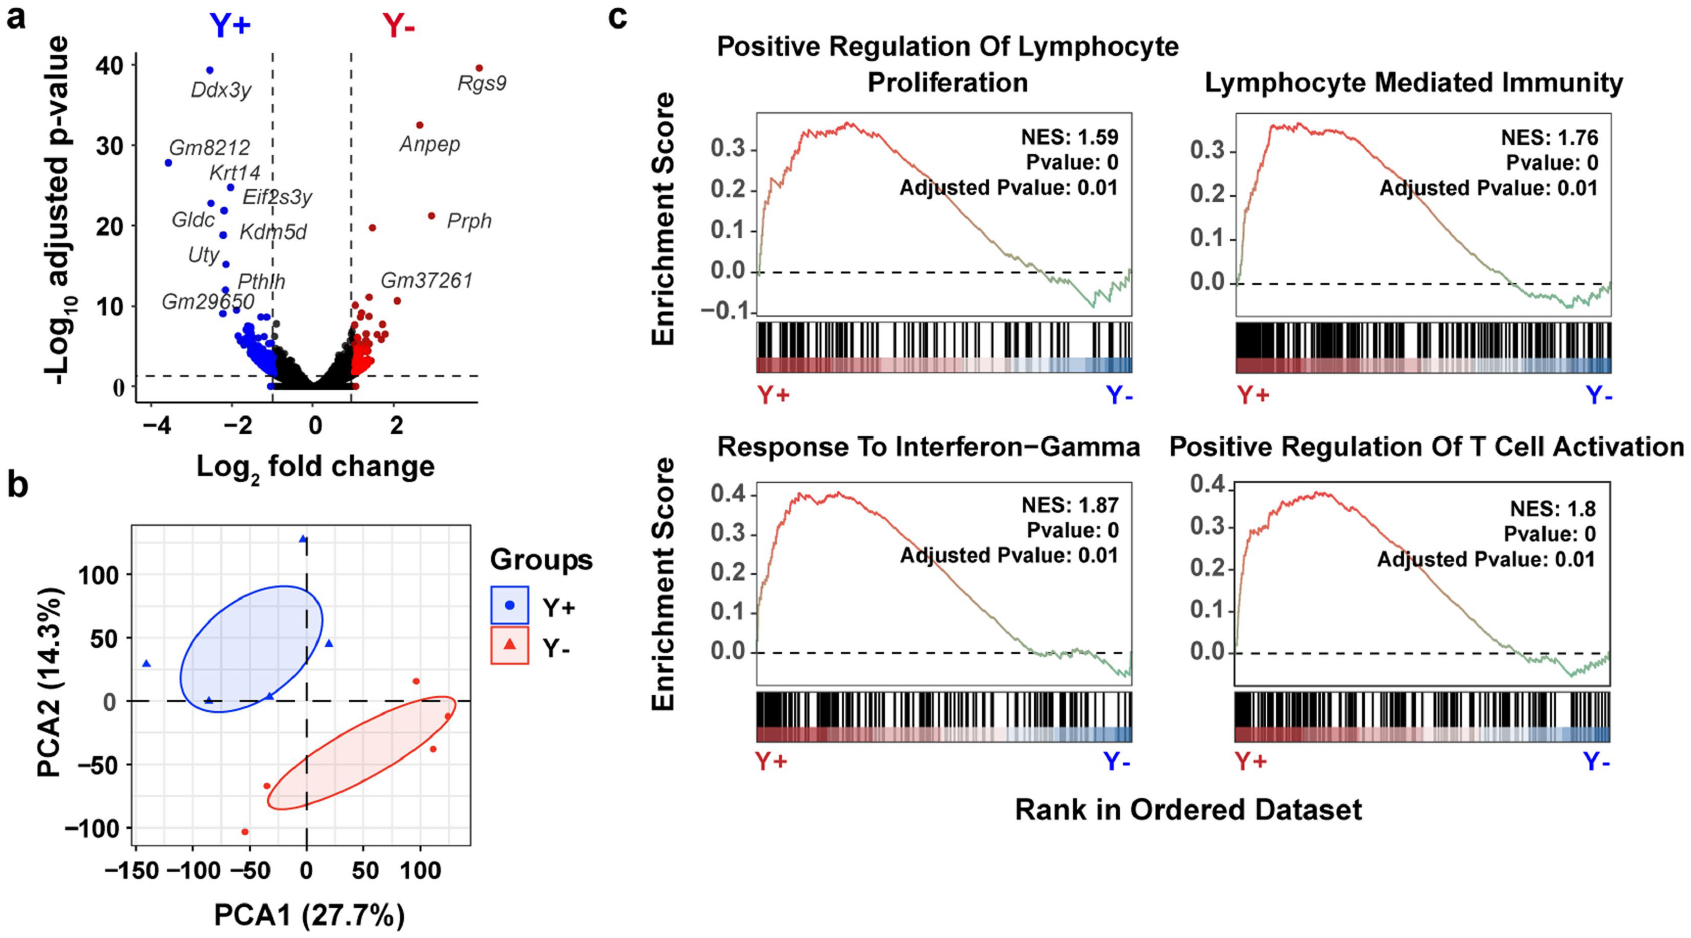
a, Volcano plot of DEGs from bulk RNA isolated from Y+ and Y− MB49 tumors grown in male WT mice. Blue (Y+ tumors) and red (Y− tumors) genes correspond to statistically significant (Benjamini-Hochberg method, P < 0.05) genes that have a | >1 log2 | fold-change in expression. b, PCA of DEGs described in a. c, Gene ontology (GO) pathway enrichment score plots of statistically significant gene set enrichment analyses (GSEA) using DEGs from a. NES, normalized enrichment score.
Extended Data Fig. 5 |. Comprehensive immune phenotyping of tumor-infiltrating leukocytes (TILs) in Y+ and Y− MB49 tumors.
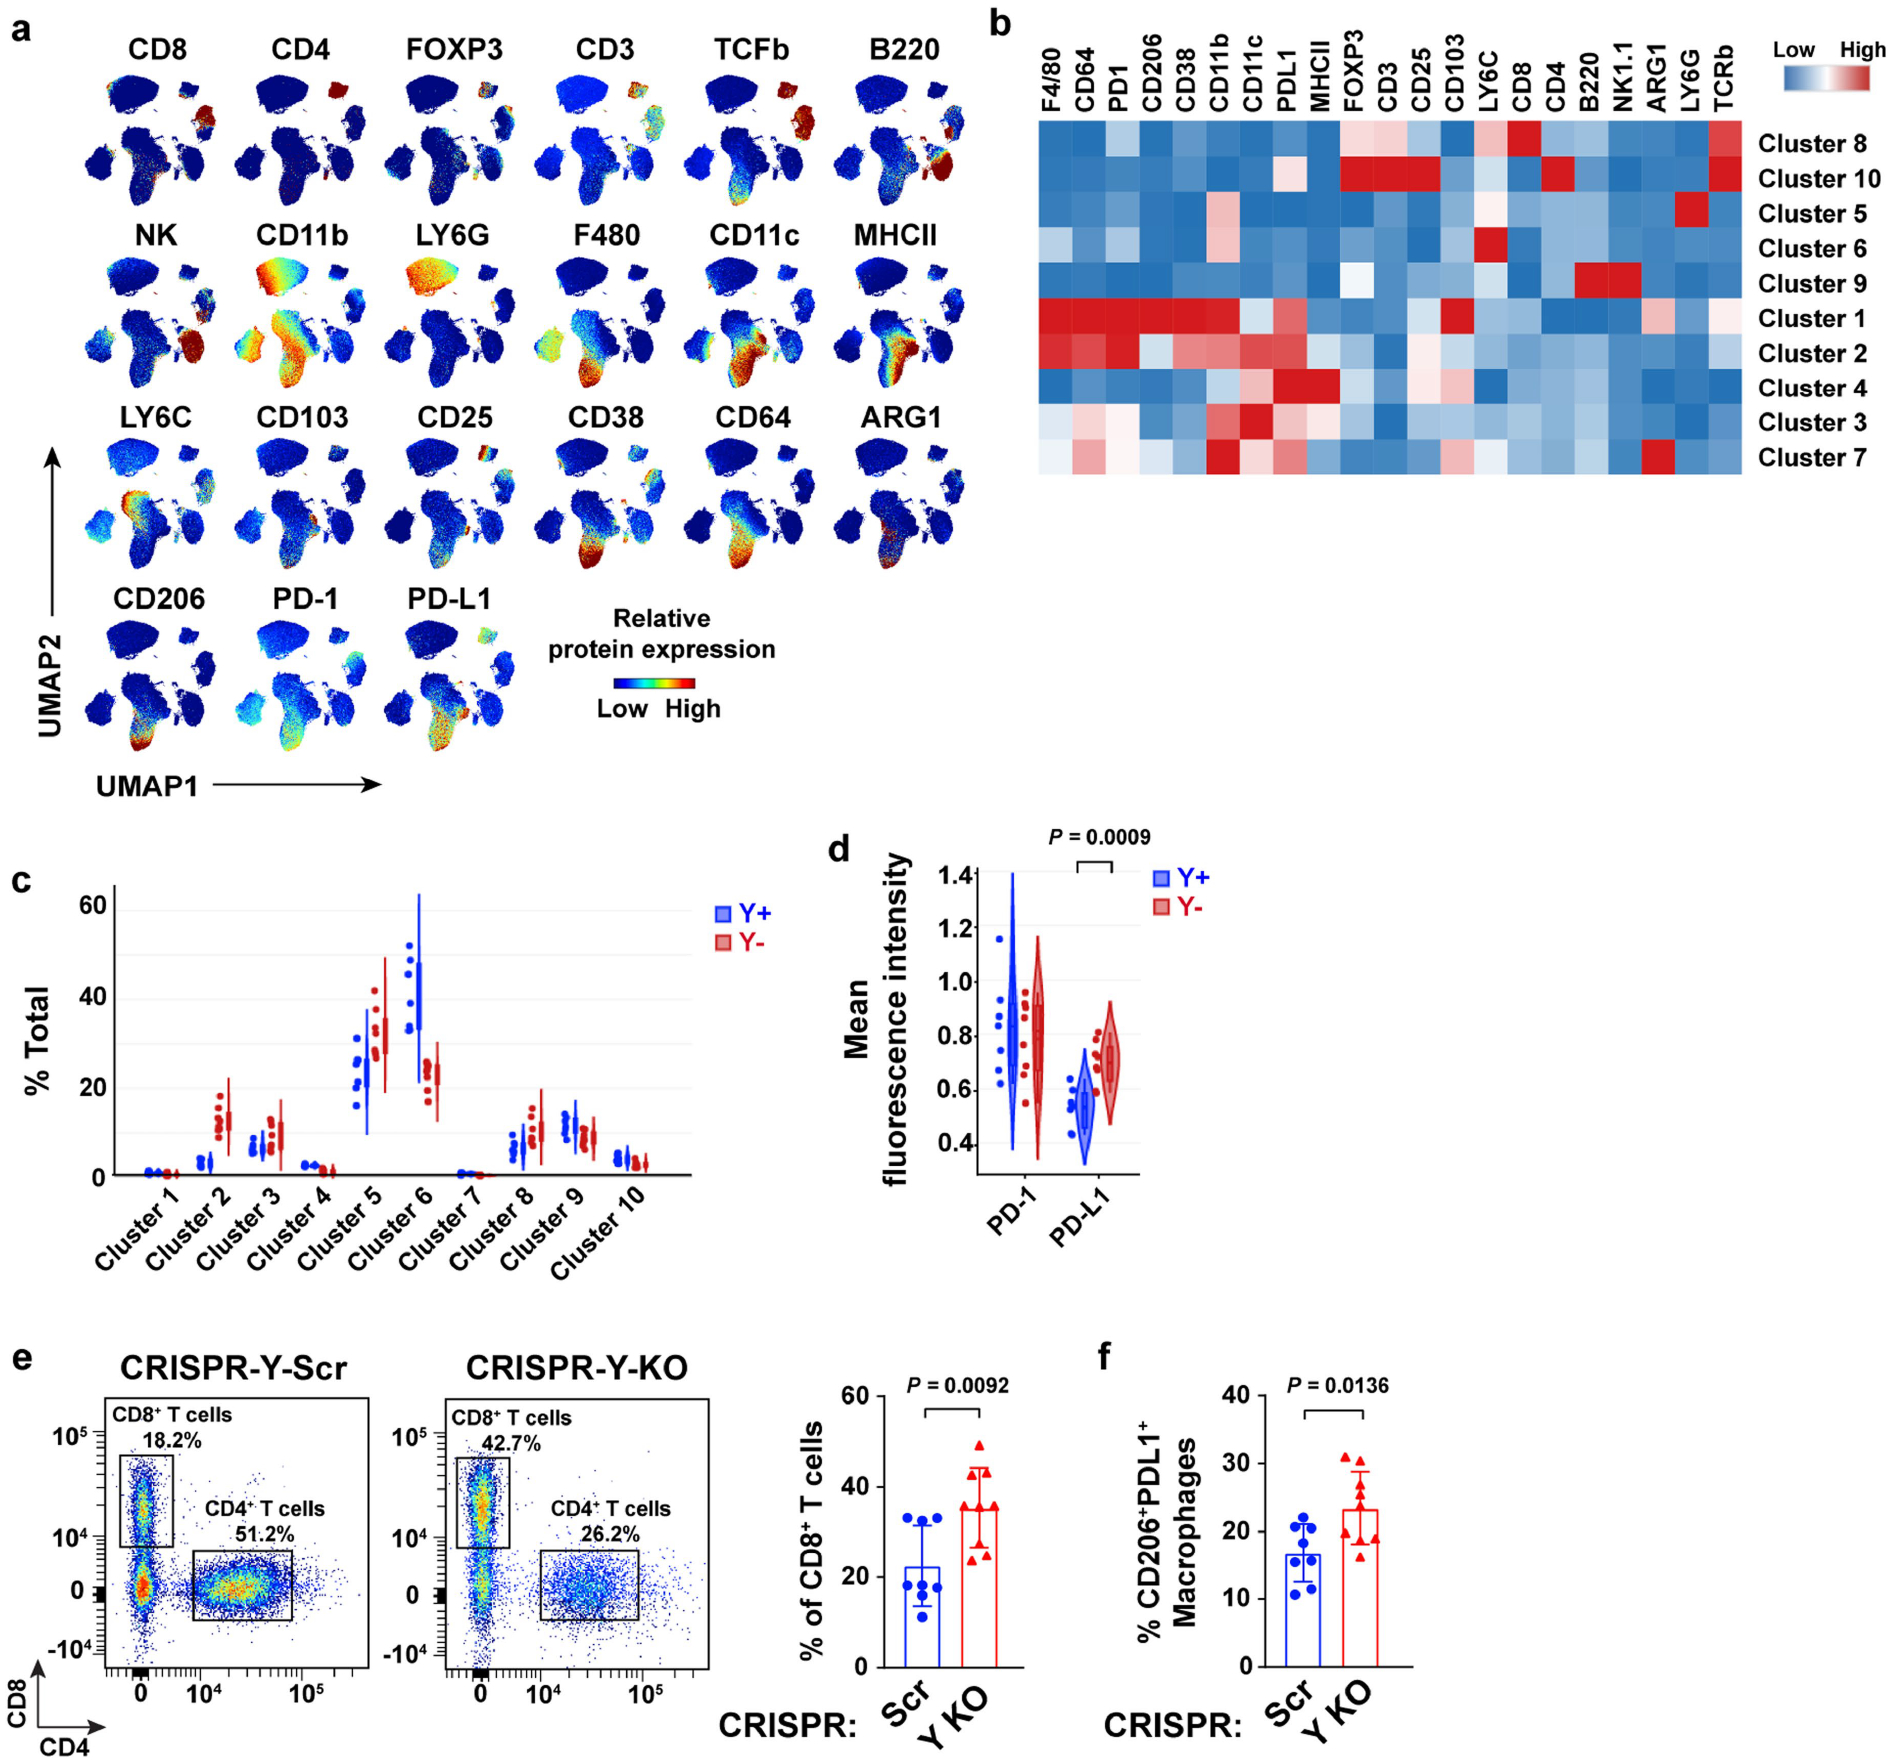
a, UMAPs demonstrating individual spectral flow cytometry analysis of protein marker expression in CD45+ immune cells isolated from Y+ and Y− MB49 tumors grown in WT male mice. b, Heatmap of relative protein expression from immune cells described in a. c, Violin plots of each tumor sample across each cluster from the CD45+ immune cell UMAP (see Fig. 3b). d, Violin plot of PD-1 and PD-L1 mean fluorescence intensity in CD45+ immune cells from Y+ and Y− MB49 tumors. e, Representative dot plots and percentages of CD8+ and CD4+ T cells gated on total CD3+ T cells from CRISPR-Y-Scr (n = 8) and CRISPR-Y-KO (n = 9), MB49 tumors grown for 22 or 17 days, respectively, in male WT mice (left panels). Percentage of CD8+ T cells of total CD3+ T cells per tumor sample (right panel). f, Percentage of CD206+PDL1+ macrophages among total CD11b+F4/80+ macrophages from Control and Y KO MB49 tumors described in e. Statistics were determined using two-sided unpaired t-tests.
Extended Data Fig. 6 |. GeoMX histological evaluation of infiltrating immune cells in Y− and Y+ MB49 tumors.
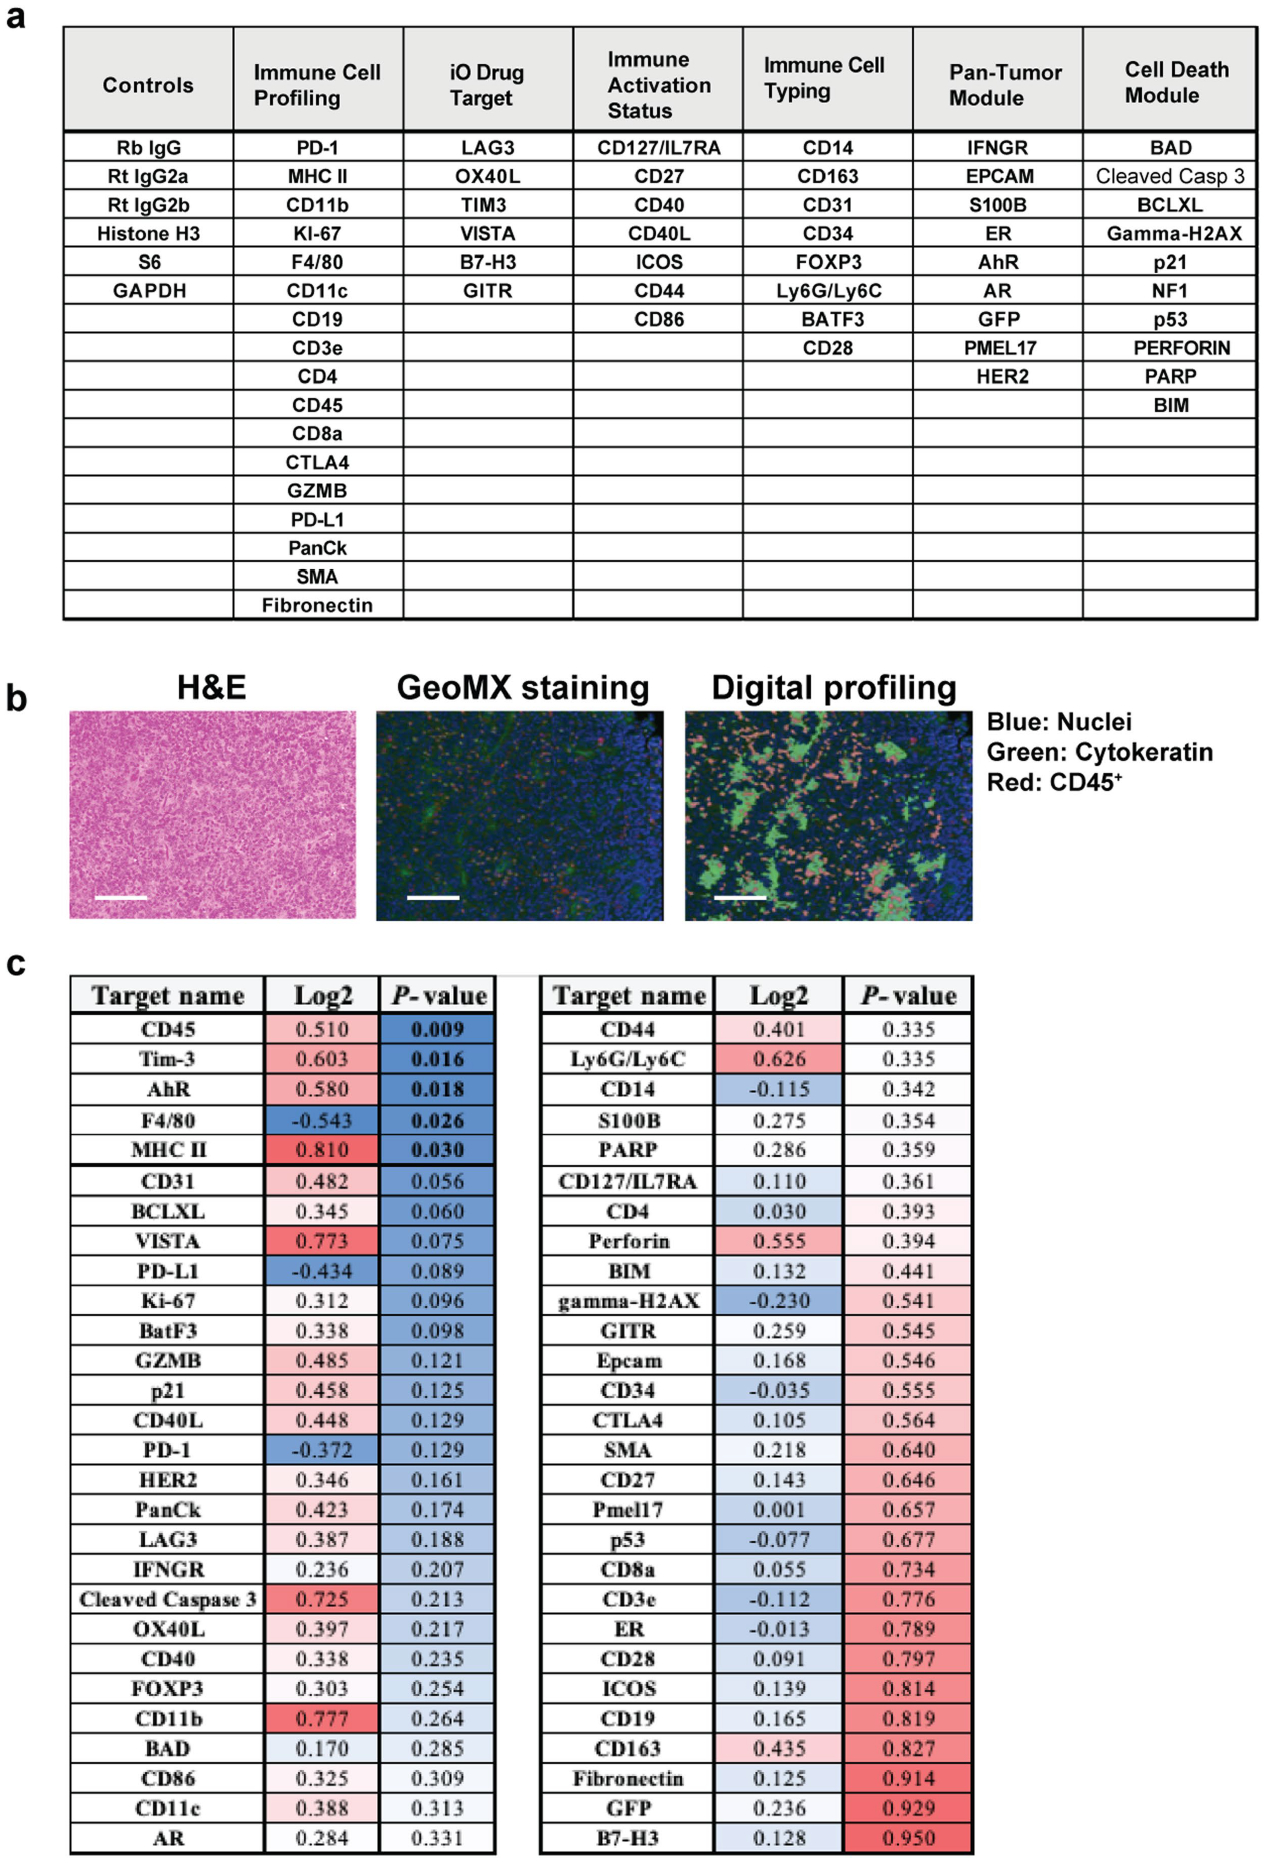
a, Table of markers that are functionally categorized for GeoMX evaluation of Y+ and Y− MB49 tumors. b, Representative H&E image (left), immunofluorescence detection of nuclei (blue), cytokeratin (green), CD45+ immune cells (red) (middle), and associated computational digital profiling (right) to quantify markers shown in a. Scale bar, 125 μM. c, Quantification (log2 fold change and P-value) of the markers listed in Y+ versus Y− MB49 tumors (n = 10 tumors per group and three TMA cores per tumor). Data representative of two independent experiments. Statistical significance was determined by two-sided unpaired t-test.
Extended Data Fig. 7 |. Characterization of tumor-infiltrating CD8+ T cells after PD-1 pathway blockade.
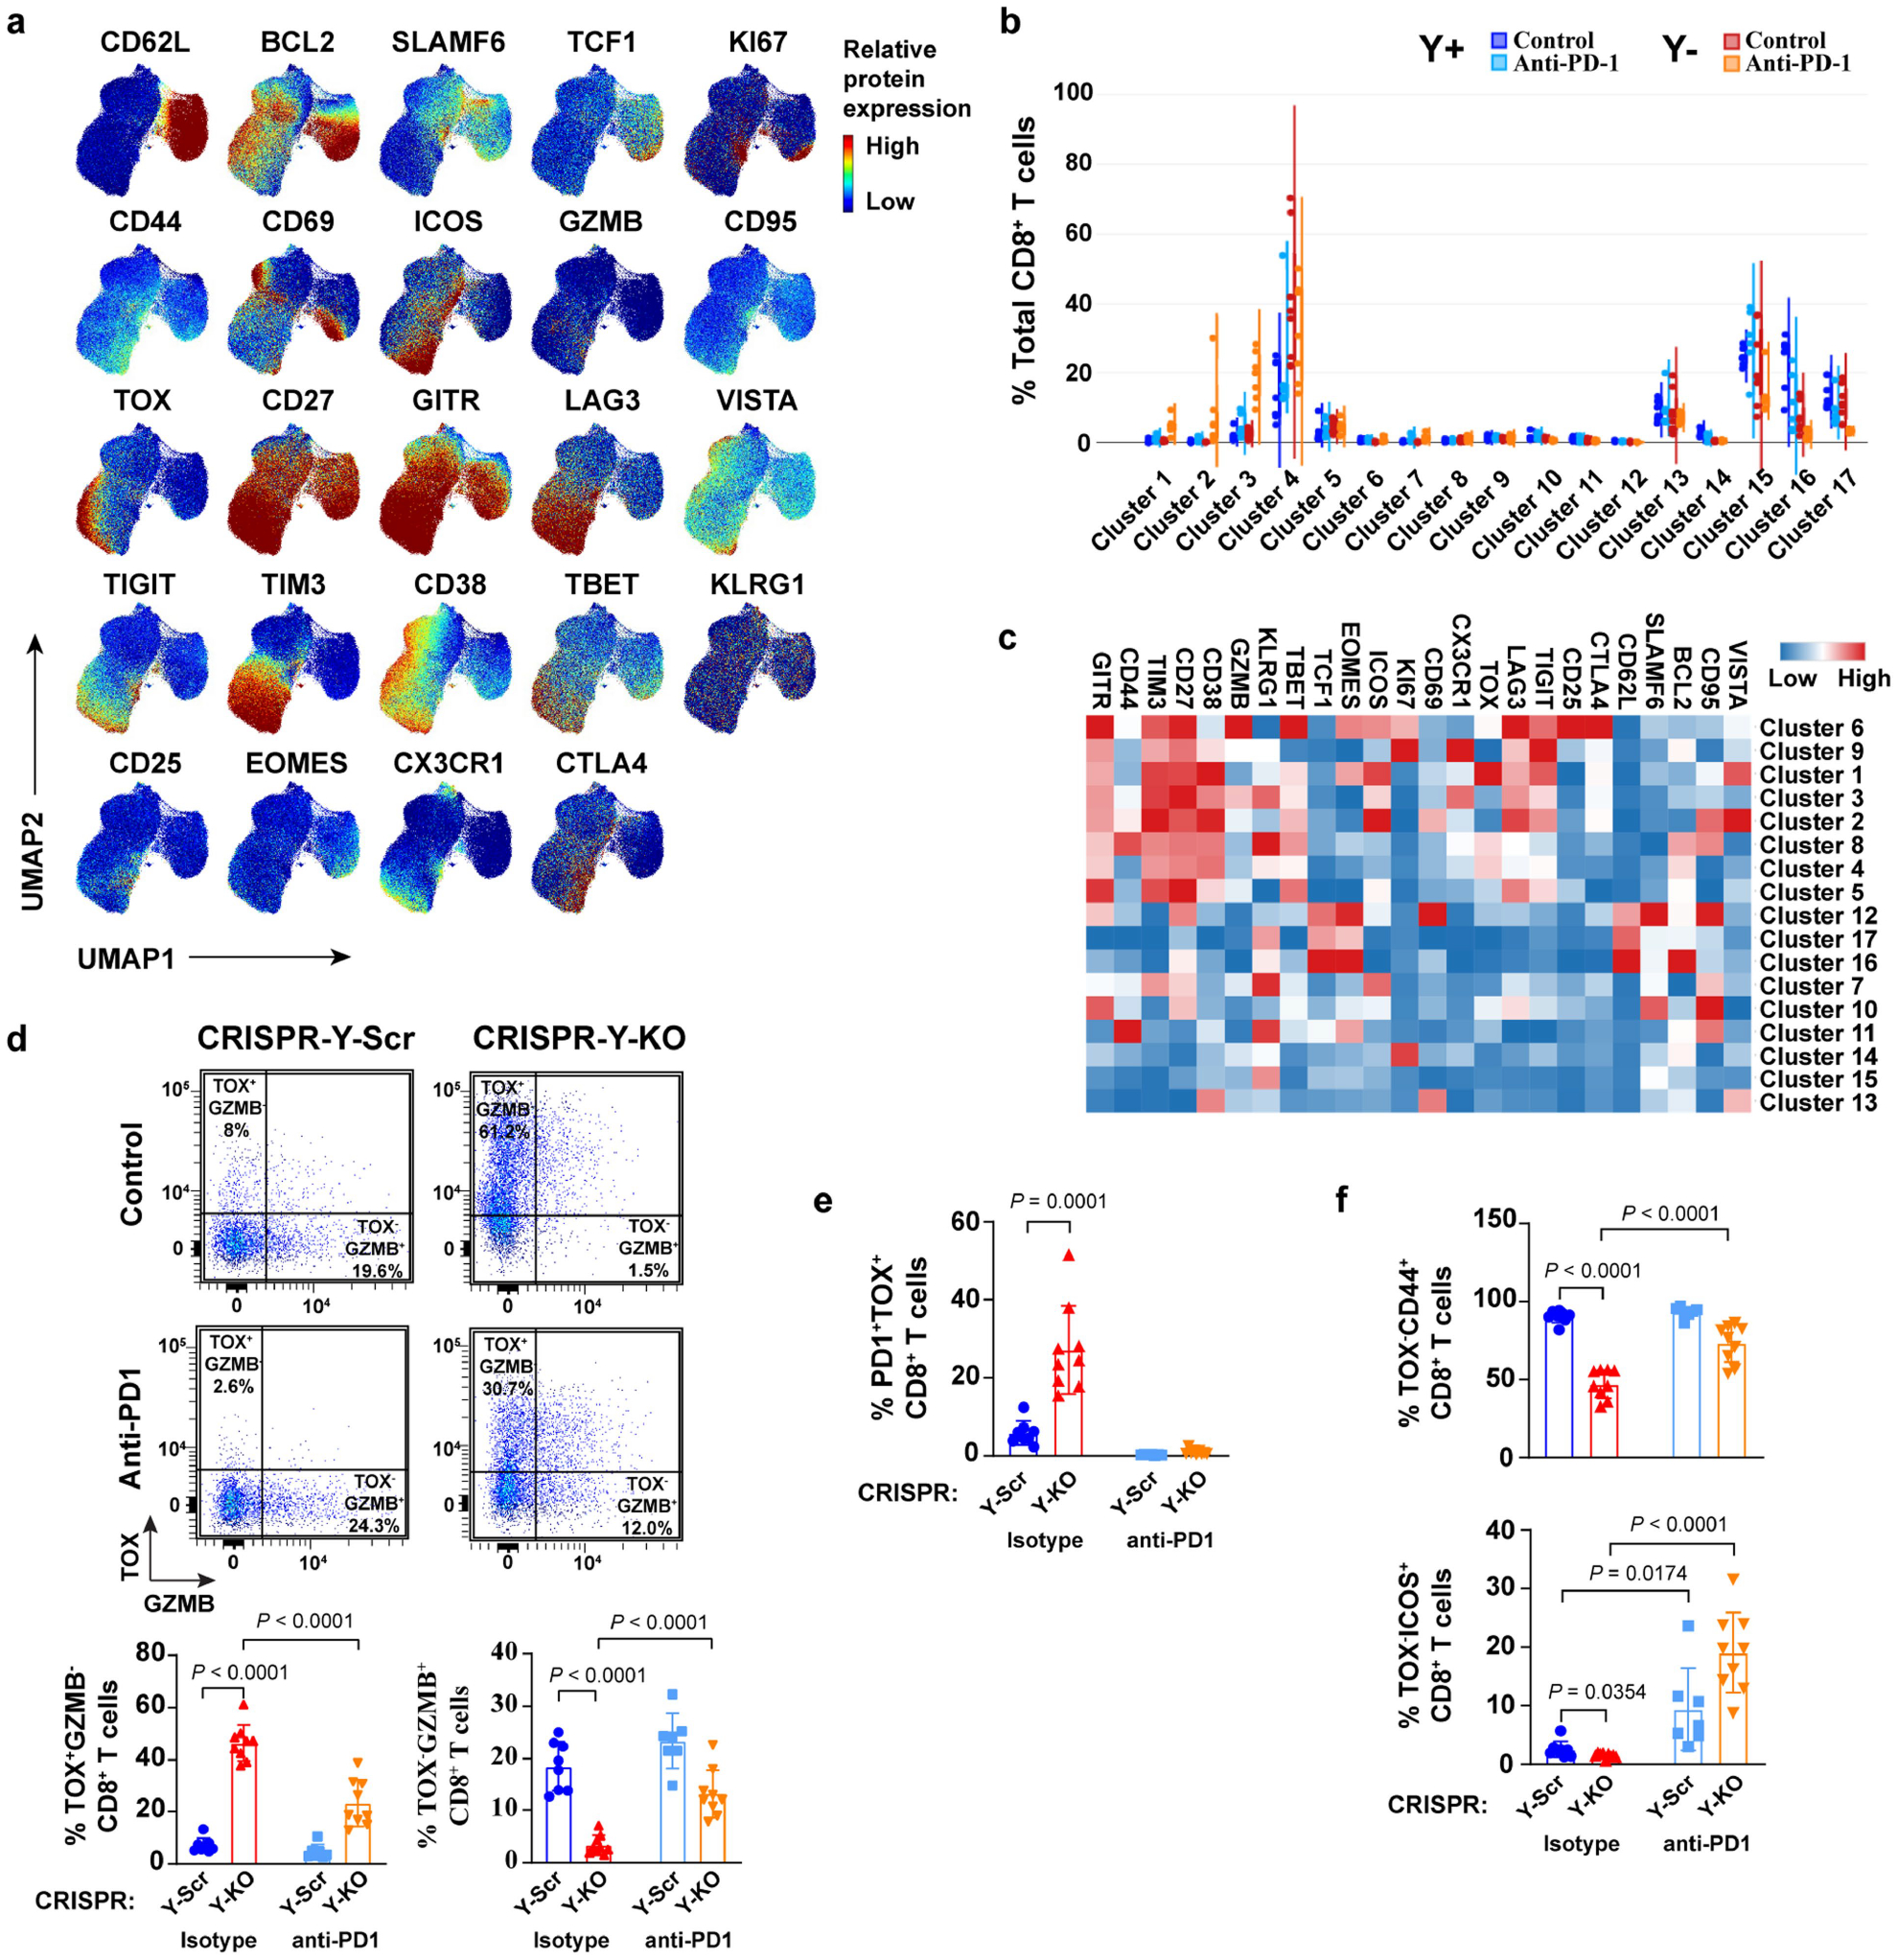
a–c, Relative spectral flow protein expression (a), sample-level violin plots per cluster (b), and heatmap of individual targets per cluster (c) after 200 μg anti-PD-1 or isotype control IgG treatments for 7 days using CD8+ T cells from Y+ and Y− MB49 tumors. d, Representative dot plots and percentages of TOX and/or GZMB-expressing CD8+ T cells from CRISPR-Y-Scr and CRISPR-Y-KO MB49 tumors grown in male WT mice after 200 μg anti-PD-1 or isotype control IgG treatments for 7 days. e–f, Percentage of PD1+TOX+ CD8+ T cells (e) and TOX−CD44+ (top panel) or TOX−ICOS+ (bottom panel) CD8+ T cells (f) from tumor samples described in d. See Fig. 5 for additional method details. Statistical significance was determined by two-sided unpaired t-test. Tests were conducted between isotype controls or between isotype controls and anti-PD1 treatment groups.
Extended Data Fig. 8 |. DDR-related pathways in TCGA Ylow vs. Yhigh BC.
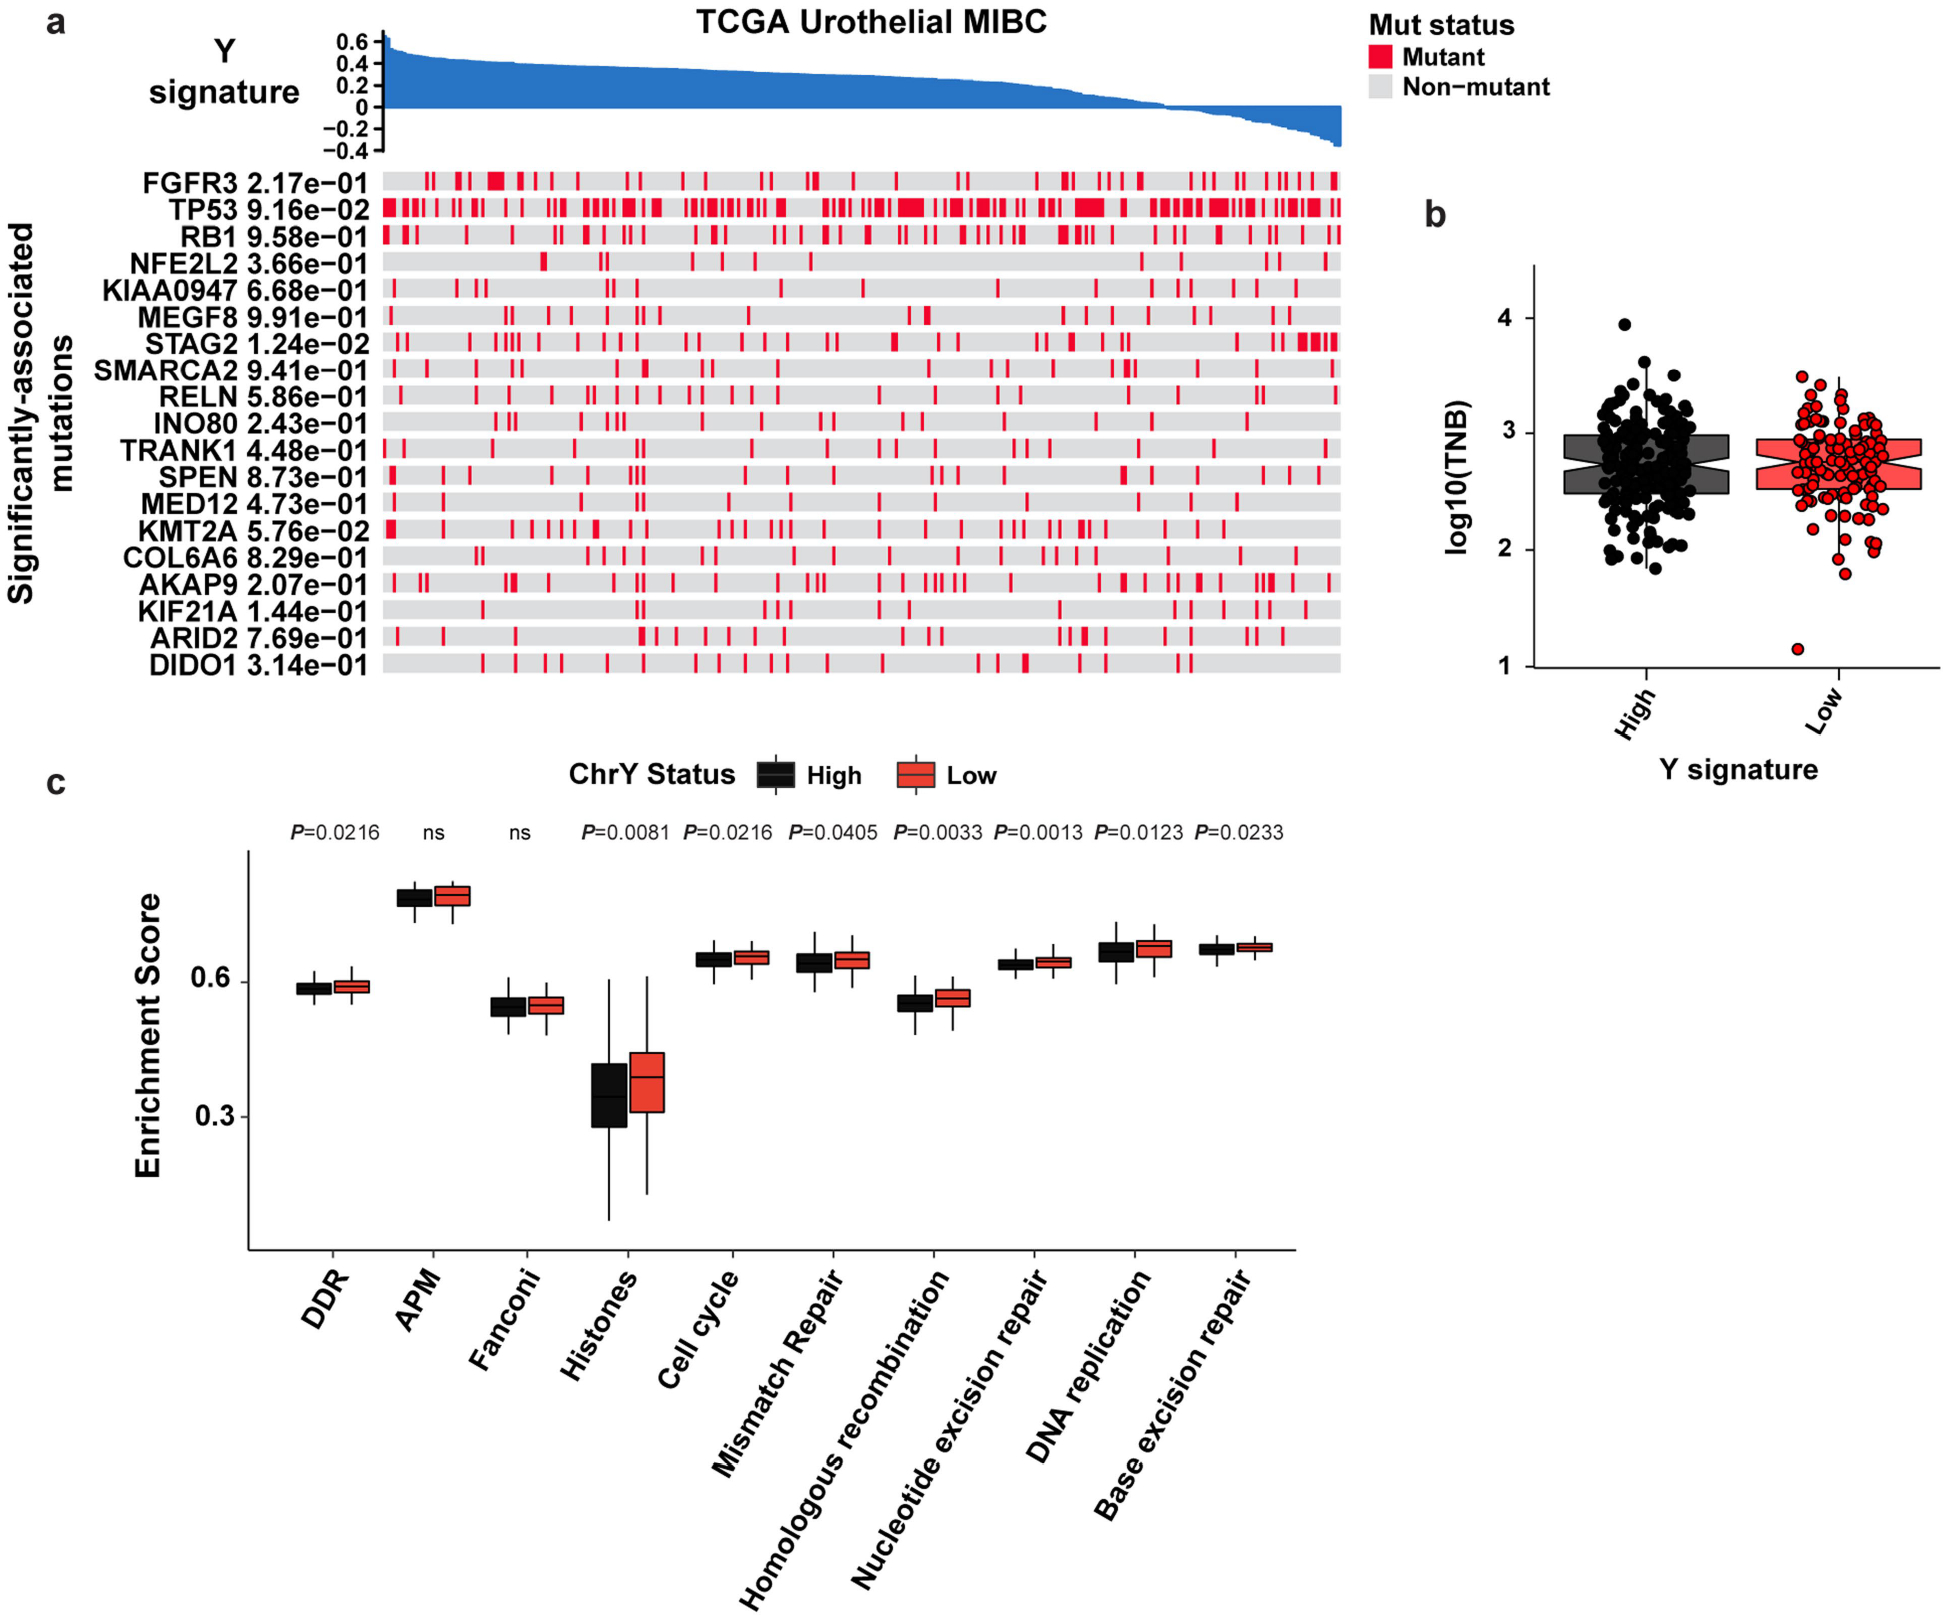
a, Heatmap of the indicated pathways and metadata from BC TCGA data. b–c, box plot of tumor neoantigen burden (TNB) per megabase (P = 0.700) (b), and associated pathway enrichment levels (c) from Yhigh and Ylow tumors described in Fig. 1a. Statistical significance was determined by Wilcoxon test (Ylow n = 118 and Yhigh n = 182). Boxplots represent the mean with first and third quartile data. Minimum and maximum datapoints are included.
Extended Data Fig. 9 |. Defective DDR pathway activation in Y− MB49 cells.
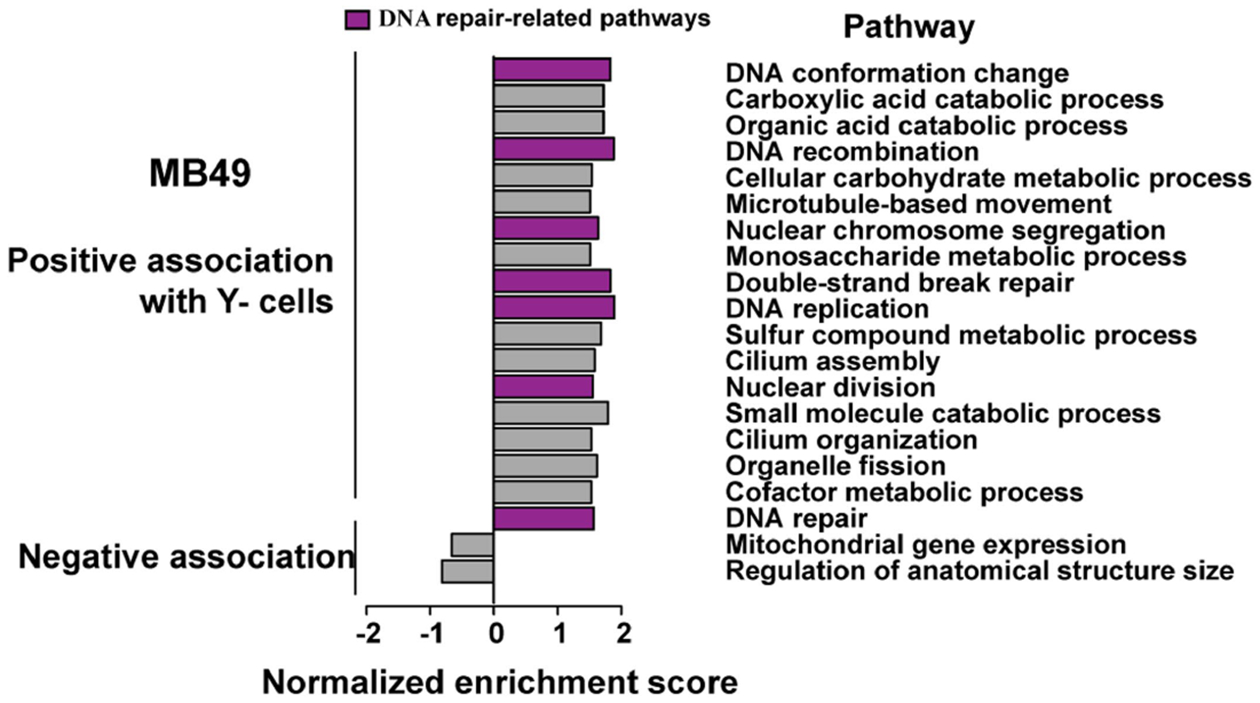
Normalized enrichment scores of statistically significant GSEA GO pathways using DEGs from Y− vs. Y+ MB49 cell cultures. Purple color denotes DNA repair-related pathways enriched in Y− cells.
Extended Data Fig. 10 |. Elevated genomic instability in LOY, Uty KO, and Kdm5d KO MB49 lines.
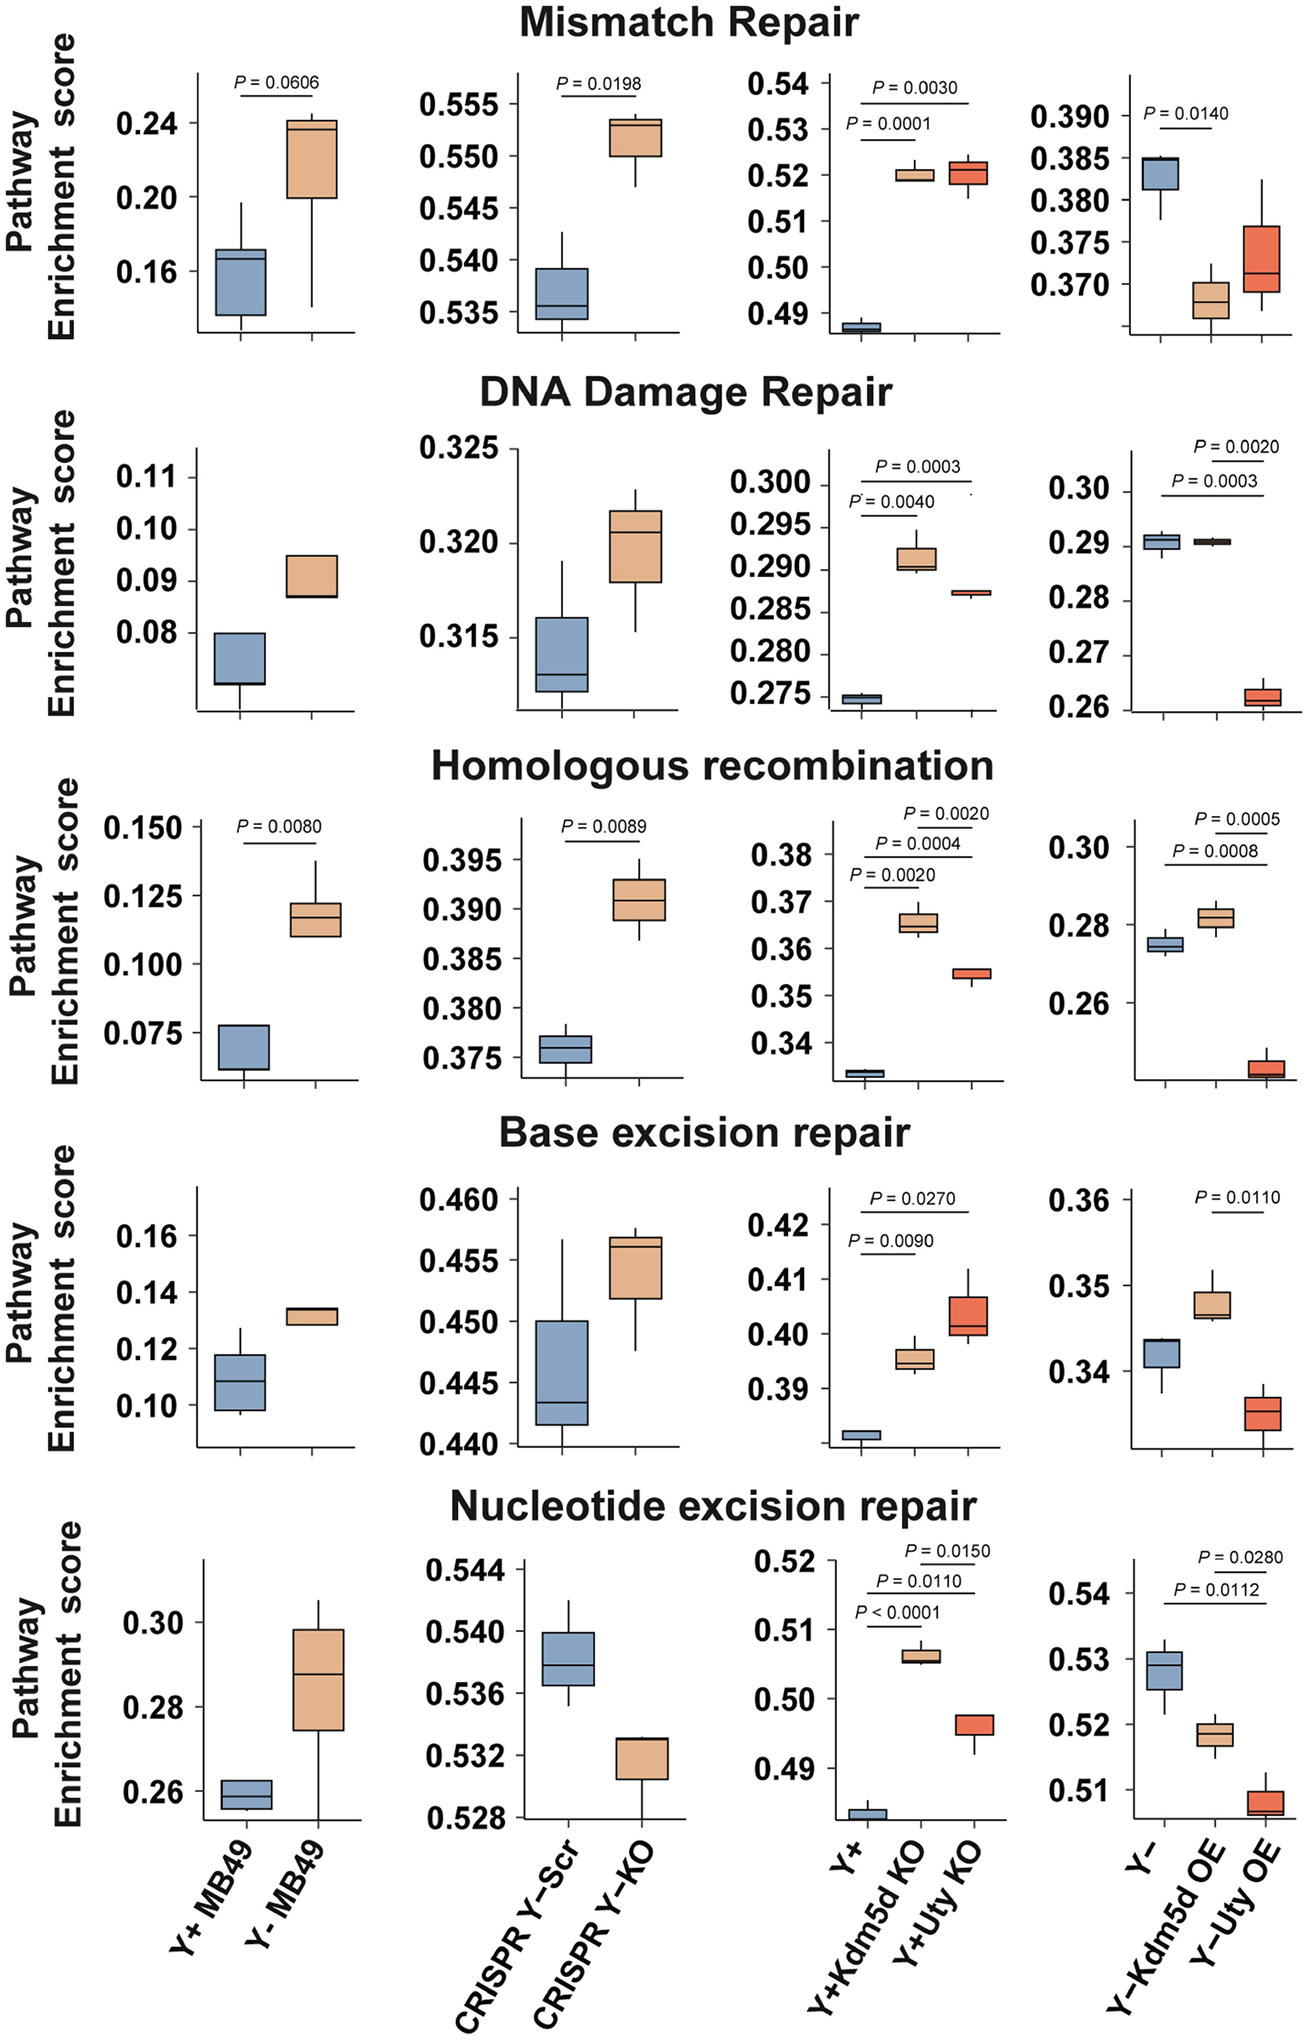
Genome instability pathway enrichment scores using RNA-seq data from control and genetically modified MB49 cell lines (Y+ and Y− cells, n = 5 technical replicates. n = 3 for all other cell lines). Two-sided unpaired t-test. Boxplots represent the mean with first and third quartile data. Minimum and maximum datapoints are included.
Supplementary Material
Acknowledgements
This work was supported in part by NIH P01CA278732 and R01CA143971 to D.T. and NIH R01CA262069, R01CA262388 and R01AI077283 to Z.L. J.M.S. and T.D.G. were supported by the Ohio State University Comprehensive Cancer Center’s Tumor Immunology T32 (2T32CA09223-16A1) post-doctoral fellowship award. We thank K. Walsh for providing the LOY gRNA plasmids, and N.-J. Song and B. Riesenberg for development of the ‘all immune phenotyping’ flow antibody panel. We acknowledge resources from the Immune Monitoring and Discovery Platform and the Pelotonia Institute for Immuno-Oncology at OSU Comprehensive Cancer Center (P30CA016058).
Footnotes
Online content
Any methods, additional references, Nature Portfolio reporting summaries, source data, extended data, supplementary information, acknowledgements, peer review information; details of author contributions and competing interests; and statements of data and code availability are available at https://doi.org/10.1038/s41586-023-06234-x.
Competing interests Z.L. reports personal consultation fees from Alphamab, HanchorBio, Henlius, Heat Biologic and Ikonisys outside the submitted work. All other authors declare no competing interests.
Supplementary information The online version contains supplementary material available at https://doi.org/10.1038/s41586-023-06234-x.
Data availability
The data supporting the findings of this study are available within the article, extended data and supplementary information files. RNA-seq and WES data are available at the Gene Expression Omnibus with accession reference GSE229233 and GSE230820. Source data are provided with this paper.
References
- 1.Caceres A, Jene A, Esko T, Perez-Jurado LA & Gonzalez JR Extreme downregulation of chromosome Y and cancer risk in men. J. Natl Cancer Inst 112, 913–920 (2020). [DOI] [PMC free article] [PubMed] [Google Scholar]
- 2.Kido T & Lau YF Roles of the Y chromosome genes in human cancers. Asian J. Androl 17, 373–380 (2015). [DOI] [PMC free article] [PubMed] [Google Scholar]
- 3.Brown DW & Machiela MJ Why Y? Downregulation of chromosome Y genes potentially contributes to elevated cancer risk. J. Natl Cancer Inst 112, 871–872 (2020). [DOI] [PMC free article] [PubMed] [Google Scholar]
- 4.Panani AD & Roussos C Sex chromosome abnormalities in bladder cancer: Y polysomies are linked to PT1-grade III transitional cell carcinoma. Anticancer Res 26, 319–323 (2006). [PubMed] [Google Scholar]
- 5.Sauter G et al. Y chromosome loss detected by FISH in bladder cancer. Cancer Genet. Cytogenet 82, 163–169 (1995). [DOI] [PubMed] [Google Scholar]
- 6.Powell I, Tyrkus M & Kleer E Apparent correlation of sex chromosome loss and disease course in urothelial cancer. Cancer Genet. Cytogenet 50, 97–101 (1990). [DOI] [PubMed] [Google Scholar]
- 7.Maan AA et al. The Y chromosome: a blueprint for men’s health? Eur. J. Hum. Genet 25, 1181–1188 (2017). [DOI] [PMC free article] [PubMed] [Google Scholar]
- 8.Adikusuma F, Williams N, Grutzner F, Hughes J & Thomas P Targeted deletion of an entire chromosome using CRISPR/Cas9. Mol. Ther 25, 1736–1738 (2017). [DOI] [PMC free article] [PubMed] [Google Scholar]
- 9.Sano S et al. Hematopoietic loss of Y chromosome leads to cardiac fibrosis and heart failure mortality. Science 377, 292–297 (2022). [DOI] [PMC free article] [PubMed] [Google Scholar]
- 10.Forsberg LA et al. Mosaic loss of chromosome Y in peripheral blood is associated with shorter survival and higher risk of cancer. Nat. Genet 46, 624–628 (2014). [DOI] [PMC free article] [PubMed] [Google Scholar]
- 11.Fadl-Elmula I et al. Karyotypic characterization of urinary bladder transitional cell carcinomas. Genes Chromosomes Cancer 29, 256–265 (2000). [PubMed] [Google Scholar]
- 12.Sauter G, Moch H, Mihatsch MJ & Gasser TC Molecular cytogenetics of bladder cancer progression. Eur. Urol 33, 9–10 (1998). [DOI] [PubMed] [Google Scholar]
- 13.Smeets W, Pauwels R, Laarakkers L, Debruyne F & Geraedts J Chromosomal analysis of bladder cancer. III. Nonrandom alterations. Cancer Genet. Cytogenet 29, 29–41 (1987). [DOI] [PubMed] [Google Scholar]
- 14.Sauter G et al. DNA aberrations in urinary bladder cancer detected by flow cytometry and FISH. Urol. Res 25, S37–S43 (1997). [DOI] [PubMed] [Google Scholar]
- 15.Neuhaus M et al. Polysomies but not Y chromosome losses have prognostic significance in pTa/pT1 urinary bladder cancer. Hum. Pathol 30, 81–86 (1999). [DOI] [PubMed] [Google Scholar]
- 16.Siegel RL, Miller KD, Fuchs HE & Jemal A Cancer statistics, 2021. CA Cancer J. Clin 71, 7–33 (2021). [DOI] [PubMed] [Google Scholar]
- 17.Johansson SL & Cohen SM Epidemiology and etiology of bladder cancer. Semin. Surg. Oncol 13, 291–298 (1997). [DOI] [PubMed] [Google Scholar]
- 18.Dumanski JP et al. Smoking is associated with mosaic loss of chromosome Y. Science 347, 81–83 (2015). [DOI] [PMC free article] [PubMed] [Google Scholar]
- 19.Tabayoyong W & Gao J The emerging role of immunotherapy in advanced urothelial cancers. Curr. Opin. Oncol 30, 172–180 (2018). [DOI] [PubMed] [Google Scholar]
- 20.Rouanne M et al. Development of immunotherapy in bladder cancer: present and future on targeting PD(L)1 and CTLA-4 pathways. World J. Urol 36, 1727–1740 (2018). [DOI] [PubMed] [Google Scholar]
- 21.Prokop JW & Deschepper CF Chromosome Y genetic variants: impact in animal models and on human disease. Physiol. Genomics 47, 525–537 (2015). [DOI] [PMC free article] [PubMed] [Google Scholar]
- 22.Robertson AG et al. Comprehensive molecular characterization of muscle-invasive bladder cancer. Cell 171, 540–556.e525 (2017). [DOI] [PMC free article] [PubMed] [Google Scholar]
- 23.Lindskrog SV et al. An integrated multi-omics analysis identifies prognostic molecular subtypes of non-muscle-invasive bladder cancer. Nat. Commun 12, 2301 (2021). [DOI] [PMC free article] [PubMed] [Google Scholar]
- 24.Gonzalez JR et al. MADloy: robust detection of mosaic loss of chromosome Y from genotype-array-intensity data. BMC Bioinformatics 21, 533 (2020). [DOI] [PMC free article] [PubMed] [Google Scholar]
- 25.Summerhayes IC & Franks LM Effects of donor age on neoplastic transformation of adult mouse bladder epithelium in vitro. J. Natl Cancer Inst 62, 1017–1023 (1979). [PubMed] [Google Scholar]
- 26.Chan E, Patel A, Heston W & Larchian W Mouse orthotopic models for bladder cancer research. BJU Int 104, 1286–1291 (2009). [DOI] [PubMed] [Google Scholar]
- 27.White-Gilbertson S, Davis M, Voelkel-Johnson C & Kasman LM Sex differences in the MB49 syngeneic, murine model of bladder cancer. Bladder 3, e22 (2016). [DOI] [PMC free article] [PubMed] [Google Scholar]
- 28.Tu MM et al. Targeting DDR2 enhances tumor response to anti-PD-1 immunotherapy. Sci. Adv 5, eaav2437 (2019). [DOI] [PMC free article] [PubMed] [Google Scholar]
- 29.Sugiura K & Stock CC The effect of 2,4,6-triethylenimino-s-triazine on the growth of a variety of mouse and rat tumors. Cancer 5, 979–991 (1952). [DOI] [PubMed] [Google Scholar]
- 30.Gouin KH 3rd et al. An N-cadherin 2 expressing epithelial cell subpopulation predicts response to surgery, chemotherapy and immunotherapy in bladder cancer. Nat. Commun 12, 4906 (2021). [DOI] [PMC free article] [PubMed] [Google Scholar]
- 31.Becht E et al. Dimensionality reduction for visualizing single-cell data using UMAP. Nat. Biotechnol 37, 38–44 (2019). [DOI] [PubMed] [Google Scholar]
- 32.Hashimoto M et al. CD8 T cell exhaustion in chronic infection and cancer: opportunities for interventions. Annu. Rev. Med 69, 301–318 (2018). [DOI] [PubMed] [Google Scholar]
- 33.Kwon H et al. Androgen conspires with the CD8+ T cell exhaustion program and contributes to sex bias in cancer. Sci. Immunol 7, eabq2630 (2022). [DOI] [PMC free article] [PubMed] [Google Scholar]
- 34.Mariathasan S et al. TGFβ attenuates tumour response to PD-L1 blockade by contributing to exclusion of T cells. Nature 554, 544–548 (2018). [DOI] [PMC free article] [PubMed] [Google Scholar]
- 35.Zhang Q et al. Mosaic loss of chromosome Y promotes leukemogenesis and clonal hematopoiesis. JCI Insight 7, e153768 (2022). [DOI] [PMC free article] [PubMed] [Google Scholar]
- 36.Minner S et al. Y chromosome loss is a frequent early event in urothelial bladder cancer. Pathology 42, 356–359 (2010). [DOI] [PubMed] [Google Scholar]
- 37.Fabris VT et al. Cytogenetic characterization of the murine bladder cancer model MB49 and the derived invasive line MB49-I. Cancer Genet 205, 168–176 (2012). [DOI] [PubMed] [Google Scholar]
- 38.Ler LD et al. Loss of tumor suppressor KDM6A amplifies PRC2-regulated transcriptional repression in bladder cancer and can be targeted through inhibition of EZH2. Sci. Transl. Med 9, eaai8312 (2017). [DOI] [PubMed] [Google Scholar]
- 39.Walport LJ et al. Human UTY(KDM6C) is a male-specific N-methyl lysyl demethylase. J. Biol. Chem 289, 18302–18313 (2014). [DOI] [PMC free article] [PubMed] [Google Scholar]
- 40.Li N et al. JARID1D is a suppressor and prognostic marker of prostate cancer invasion and metastasis. Cancer Res 76, 831–843 (2016). [DOI] [PMC free article] [PubMed] [Google Scholar]
- 41.Seo H et al. TOX and TOX2 transcription factors cooperate with NR4A transcription factors to impose CD8+ T cell exhaustion. Proc. Natl Acad. Sci. USA 116, 12410–12415 (2019). [DOI] [PMC free article] [PubMed] [Google Scholar]
- 42.Khan O et al. TOX transcriptionally and epigenetically programs CD8+ T cell exhaustion. Nature 571, 211–218 (2019). [DOI] [PMC free article] [PubMed] [Google Scholar]
- 43.Thompson DJ et al. Genetic predisposition to mosaic Y chromosome loss in blood. Nature 575, 652–657 (2019). [DOI] [PMC free article] [PubMed] [Google Scholar]
- 44.Lattime EC, Gomella LG & McCue PA Murine bladder carcinoma cells present antigen to BCG-specific CD4+ T-cells. Cancer Res 52, 4286–4290 (1992). [PubMed] [Google Scholar]
- 45.Tu MM et al. Inhibition of the CCL2 receptor, CCR2, enhances tumor response to immune checkpoint therapy. Commun. Biol 3, 720 (2020). [DOI] [PMC free article] [PubMed] [Google Scholar]
- 46.Song NJ et al. Treatment with soluble CD24 attenuates COVID-19-associated systemic immunopathology. J. Hematol. Oncol 15, 5 (2022). [DOI] [PMC free article] [PubMed] [Google Scholar]
- 47.Richmond CS et al. Glycogen debranching enzyme (AGL) is a novel regulator of non-small cell lung cancer growth. Oncotarget 9, 16718–16730 (2018). [DOI] [PMC free article] [PubMed] [Google Scholar]
- 48.Martin M Cutadapt removes adapter sequences from high-throughput sequencing reads. EMBnet J 17, 10–12 (2011). [Google Scholar]
- 49.Dobin A et al. STAR: ultrafast universal RNA-seq aligner. Bioinformatics 29, 15–21 (2013). [DOI] [PMC free article] [PubMed] [Google Scholar]
- 50.Li B & Dewey CN RSEM: accurate transcript quantification from RNA-Seq data with or without a reference genome. BMC Bioinformatics 12, 323 (2011). [DOI] [PMC free article] [PubMed] [Google Scholar]
- 51.Ewels P, Magnusson M, Lundin S & Kaller M MultiQC: summarize analysis results for multiple tools and samples in a single report. Bioinformatics 32, 3047–3048 (2016). [DOI] [PMC free article] [PubMed] [Google Scholar]
- 52.Love MI, Huber W & Anders S Moderated estimation of fold change and dispersion for RNA-seq data with DESeq2. Genome Biol 15, 550 (2014). [DOI] [PMC free article] [PubMed] [Google Scholar]
- 53.DePristo MA et al. A framework for variation discovery and genotyping using next-generation DNA sequencing data. Nat. Genet 43, 491–498 (2011). [DOI] [PMC free article] [PubMed] [Google Scholar]
- 54.Hernandez S et al. Challenges and opportunities for immunoprofiling using a spatial high-plex technology: the NanoString GeoMx((R)) digital spatial profiler. Front. Oncol 12, 890410 (2022). [DOI] [PMC free article] [PubMed] [Google Scholar]
- 55.Hänzelmann S, Castelo R & Guinney J GSVA: gene set variation analysis for microarray and RNA-seq data. BMC Bioinformatics 14, 7 (2013). [DOI] [PMC free article] [PubMed] [Google Scholar]
- 56.Wolf FA, Angerer P & Theis FJ SCANPY: large-scale single-cell gene expression data analysis. Genome Biol 19, 15 (2018). [DOI] [PMC free article] [PubMed] [Google Scholar]
- 57.Rosenberg JE et al. Atezolizumab in patients with locally advanced and metastatic urothelial carcinoma who have progressed following treatment with platinum-based chemotherapy: a single-arm, multicentre, phase 2 trial. Lancet 387, 1909–1920 (2016). [DOI] [PMC free article] [PubMed] [Google Scholar]
- 58.Hedegaard J et al. Comprehensive transcriptional analysis of early-stage urothelial carcinoma. Cancer Cell 30, 27–42 (2016). [DOI] [PubMed] [Google Scholar]
- 59.Becht E et al. Estimating the population abundance of tissue-infiltrating immune and stromal cell populations using gene expression. Genome Biol 17, 218 (2016). [DOI] [PMC free article] [PubMed] [Google Scholar]
- 60.Andreatta M et al. Interpretation of T cell states from single-cell transcriptomics data using reference atlases. Nat. Commun 12, 2965 (2021). [DOI] [PMC free article] [PubMed] [Google Scholar]
- 61.Bassez A et al. A single-cell map of intratumoral changes during anti-PD1 treatment of patients with breast cancer. Nat. Med 27, 820–832 (2021). [DOI] [PubMed] [Google Scholar]
- 62.Daud AI et al. Tumor immune profiling predicts response to anti-PD-1 therapy in human melanoma. J. Clin. Invest 126, 3447–3452 (2016). [DOI] [PMC free article] [PubMed] [Google Scholar]
- 63.Gros A et al. PD-1 identifies the patient-specific CD8+ tumor-reactive repertoire infiltrating human tumors. J. Clin. Invest 124, 2246–2259 (2014). [DOI] [PMC free article] [PubMed] [Google Scholar]
- 64.Miller BC et al. Subsets of exhausted CD8+ T cells differentially mediate tumor control and respond to checkpoint blockade. Nat. Immunol 20, 326–336 (2019). [DOI] [PMC free article] [PubMed] [Google Scholar]
- 65.Siddiqui I et al. Intratumoral Tcf1+PD-1+CD8+ T cells with stem-like properties promote tumor control in response to vaccination and checkpoint blockade immunotherapy. Immunity 50, 195–211.e110 (2019). [DOI] [PubMed] [Google Scholar]
- 66.Thommen DS et al. A transcriptionally and functionally distinct PD-1+CD8+ T cell pool with predictive potential in non-small-cell lung cancer treated with PD-1 blockade. Nat. Med 24, 994–1004 (2018). [DOI] [PMC free article] [PubMed] [Google Scholar]
- 67.Kumagai S et al. The PD-1 expression balance between effector and regulatory T cells predicts the clinical efficacy of PD-1 blockade therapies. Nat. Immunol 21, 1346–1358 (2020). [DOI] [PubMed] [Google Scholar]
- 68.Nielsen M & Andreatta M NetMHCpan-3.0; improved prediction of binding to MHC class I molecules integrating information from multiple receptor and peptide length datasets. Genome Med 8, 33 (2016). [DOI] [PMC free article] [PubMed] [Google Scholar]
Associated Data
This section collects any data citations, data availability statements, or supplementary materials included in this article.
Supplementary Materials
Data Availability Statement
The data supporting the findings of this study are available within the article, extended data and supplementary information files. RNA-seq and WES data are available at the Gene Expression Omnibus with accession reference GSE229233 and GSE230820. Source data are provided with this paper.


