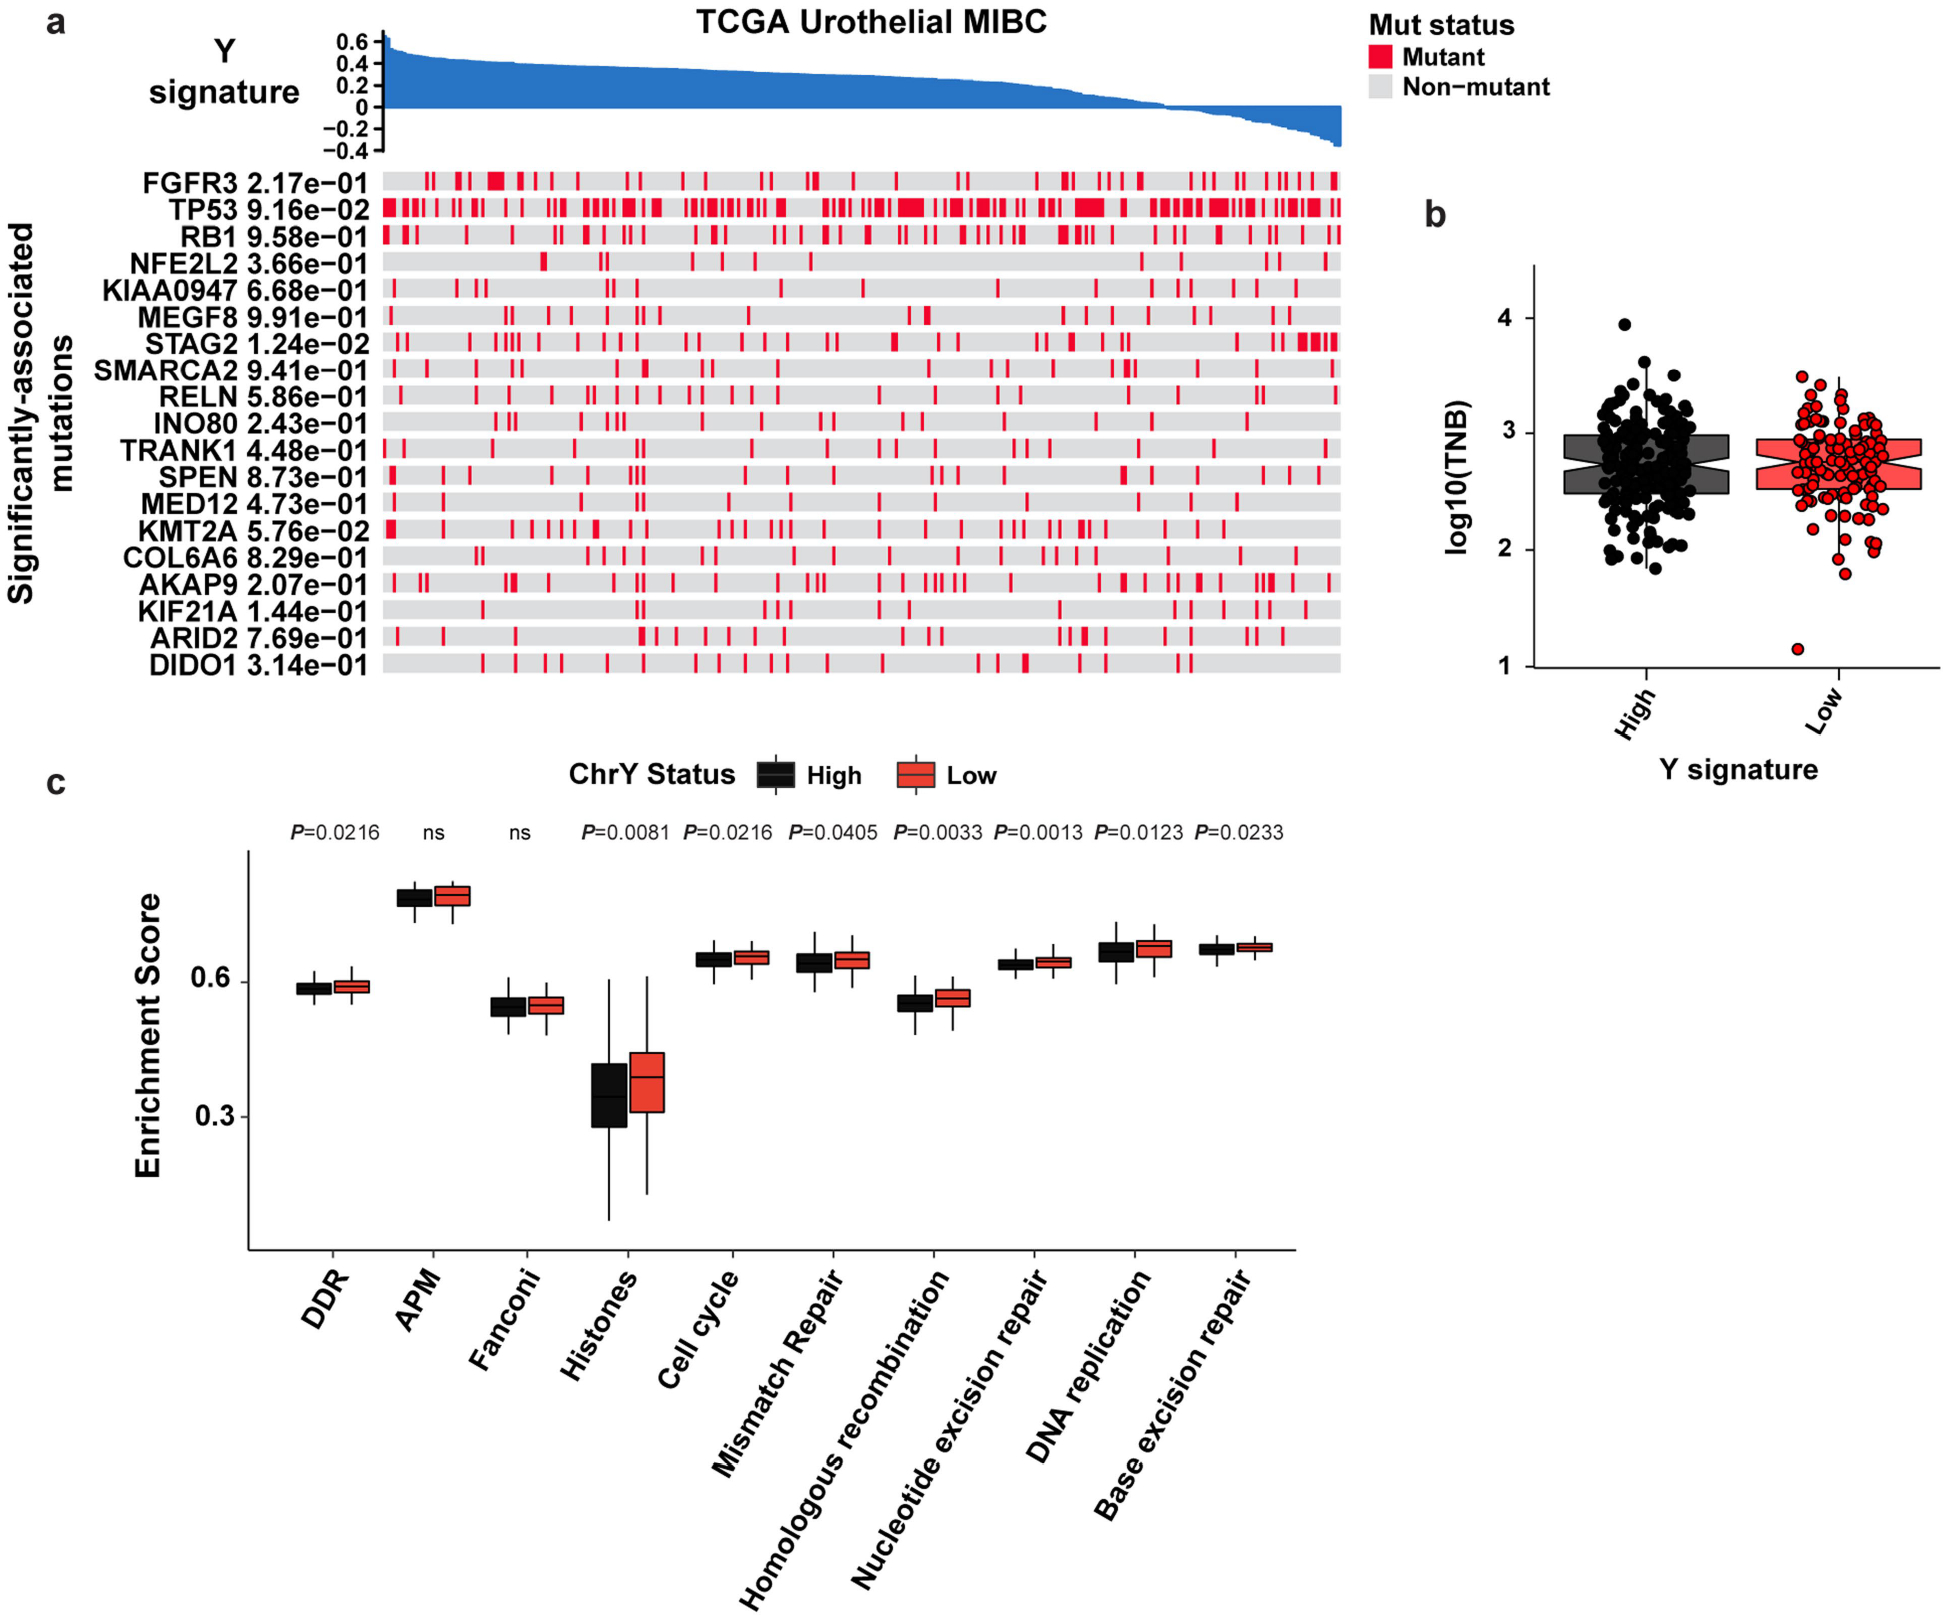
Extended Data Fig. 8 |. DDR-related pathways in TCGA Ylow vs. Yhigh BC.

a, Heatmap of the indicated pathways and metadata from BC TCGA data. b–c, box plot of tumor neoantigen burden (TNB) per megabase (P = 0.700) (b), and associated pathway enrichment levels (c) from Yhigh and Ylow tumors described in Fig. 1a. Statistical significance was determined by Wilcoxon test (Ylow n = 118 and Yhigh n = 182). Boxplots represent the mean with first and third quartile data. Minimum and maximum datapoints are included.
