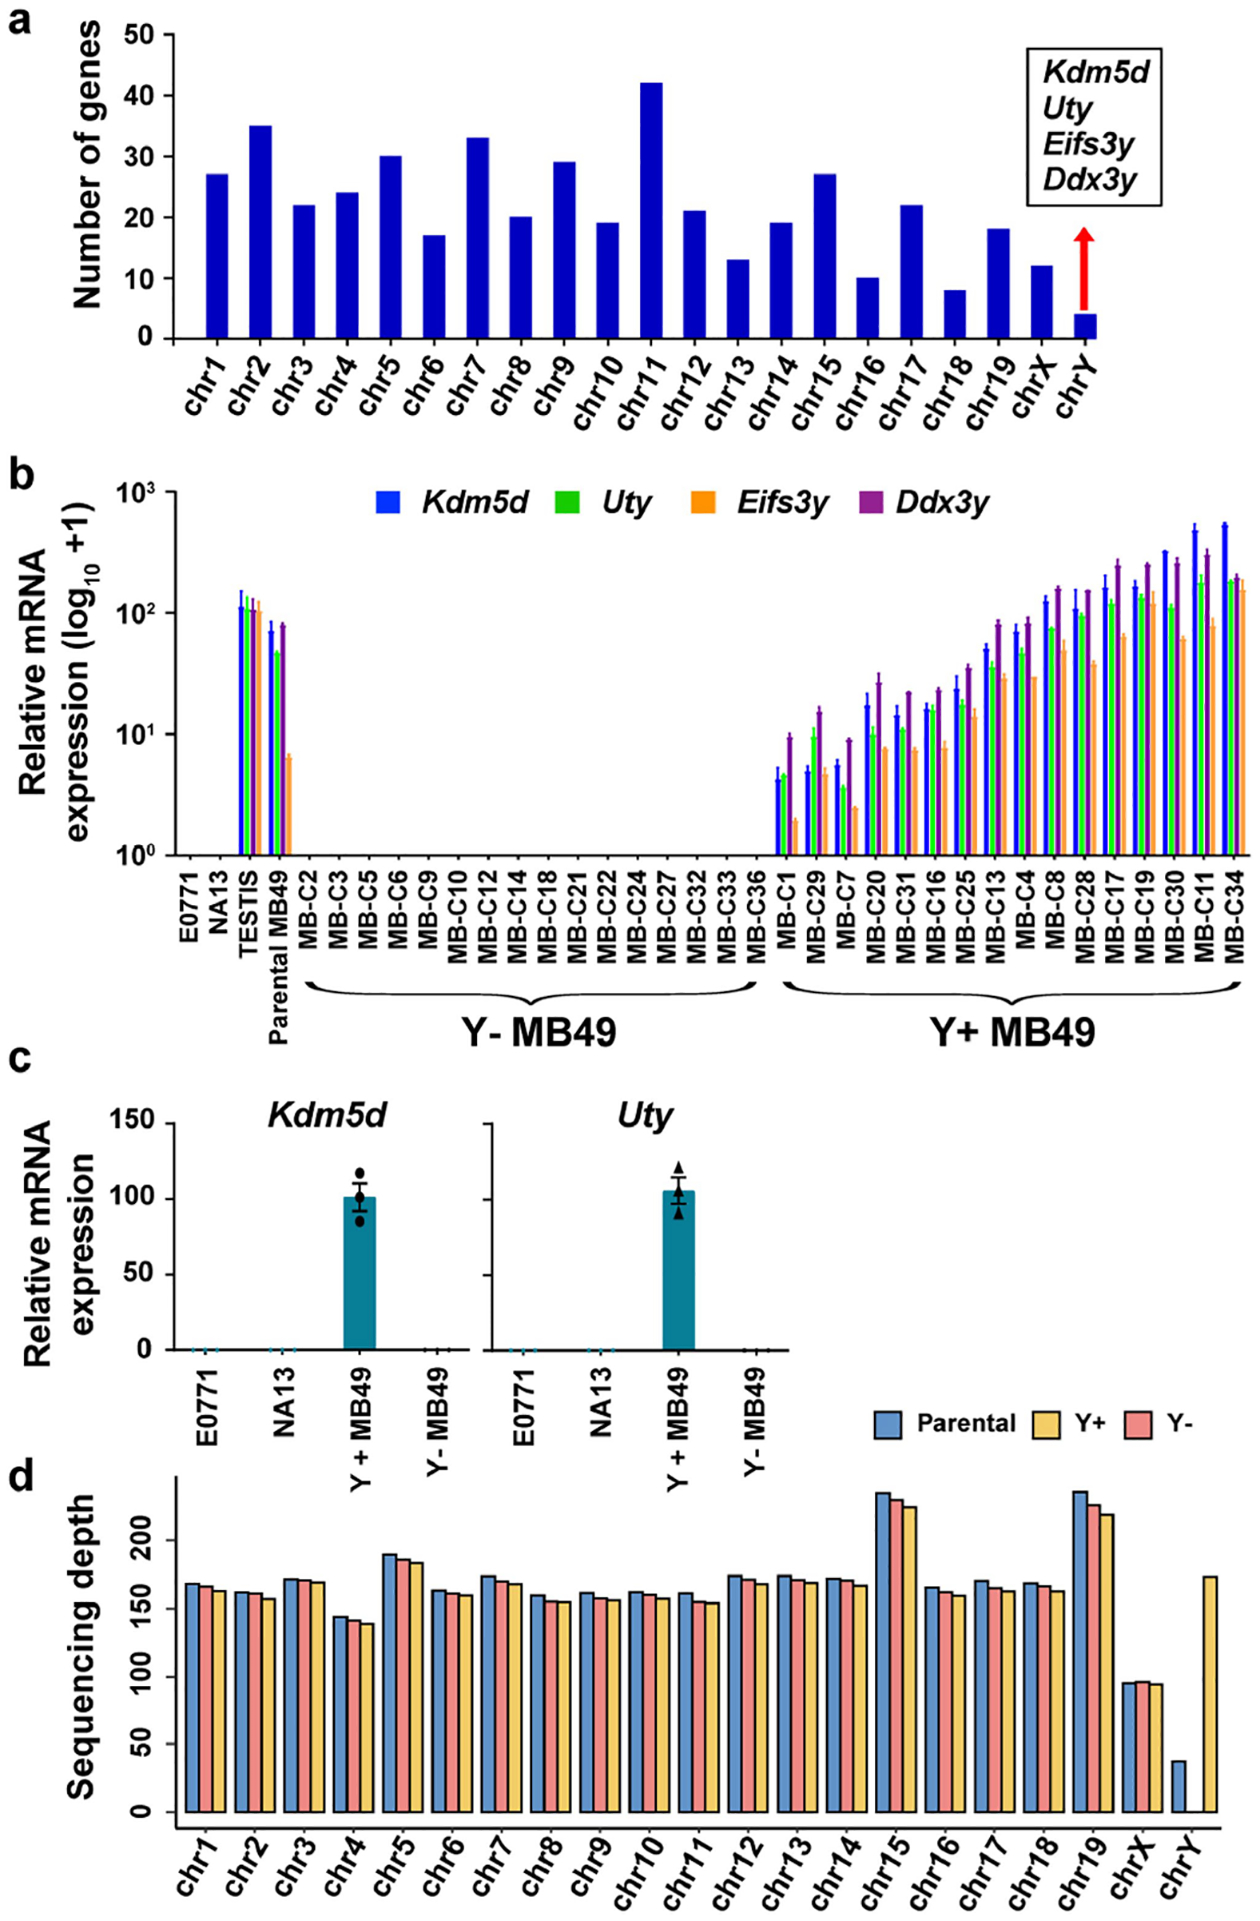
Extended Data Fig. 2 |. Generation of Y+ and Y- BC models.

a, Histogram representation of deferentially regulated genes (DEG) from Y+ vs. Y− MB49 RNAseq data per mouse chromosome. b, qRT-PCR analysis of Uty, Kdm5d, Eifs3y, and Ddx3y expression in MB49 clones isolated from the parental MB49 compared to female murine breast cancer (E0771) and bladder cancer cells (NA13), and testis tissue. Curly brackets indicate the clonal lines used to generate the pooled Y+ and Y− MB49 sublines. c, qRT-PCR analysis of Uty and Kdm5d expression in the pooled Y+ and Y− sublines described in a. n = 3 biological replicates. Data are mean ± s.e.m. d, Bar graph of sequencing depth for each chromosome after performing whole exome sequencing (WES) on DNA from the Parental, Y−, and Y+ MB49 cell lines.
