

Abstract
Texture analysis (TA) has demonstrated clinical values in extracting information, quantifying inhomogeneity, evaluating treatment outcomes, and predicting long-term prognosis for cardiac diseases. The aim of this study was to explore whether TA of SPECT myocardial perfusion could contribute to improving the prognosis of dilated cardiomyopathy (DCM) patients.
Methods.
Eighty-eight patients were recruited in our study between 2009 and 2020 who were diagnosed with DCM and underwent single-photon emission tomography myocardial perfusion imaging (SPECT MPI). Forty TA features were obtained from quantitative analysis of SPECT imaging in subjects with myocardial perfusion at rest. All patients were divided into two groups: the all-cause death group and the survival group. The prognostic value of texture parameters was assessed by Cox regression and Kaplan–Meier analysis.
Results.
Twenty-five all-cause deaths (28.4%) were observed during the follow-up (39.2±28.7 months). Compared with the survival group, NT-proBNP and total perfusion deficit (TPD) were higher and left ventricular ejection fraction (LVEF) was lower in the all-cause death group. In addition, 26 out of 40 texture parameters were significantly different between the two groups. Univariate Cox regression analysis revealed that NT-proBNP, LVEF, and 25 texture parameters were significantly associated with all-cause death. The multivariate Cox regression analysis showed that low gray-level emphasis (LGLE) (P = 0.010, HR = 4.698, 95% CI 1.457–15.145) and long-run low gray-level emphasis (LRLGE) (P =0.002, HR = 6.085, 95% CI 1.906–19.422) were independent predictors of the survival outcome. When added to clinical parameters, LVEF, TPD, and TA parameters, including LGLE and LRLGE, were incrementally associated with all-cause death (global chi-square statistic of 26.246 vs. 33.521; P = 0.028, global chi-square statistic of 26.246 vs. 34.711; P = 0.004).
Conclusion.
TA based on gated SPECT MPI could discover independent prognostic predictors of all-cause death in medically treated patients with DCM. Moreover, TA parameters, including LGLE and LRLGE, independent of the total perfusion deficit of the cardiac myocardium, appeared to provide incremental prognostic value for DCM patients. (J Nucl Cardiol 2022)
Keywords: Dilated cardiomyopathy, Single-photon emission computed tomography, Texture analysis, Total perfusion deficit
INTRODUCTION
The prevalence of dilated cardiomyopathy (DCM) has been reported to be 1:2500, and it is one of the most common causes of progressive heart failure that is significantly associated with sudden all-cause death.1 It is characterized by ventricular enlargement with reduced left ventricular ejection fraction (LVEF), functional mitral regurgitation, myocardial fibrosis, and ventricular dyssynchrony.2 A large number of previous studies have demonstrated that N-terminal pro-brain natriuretic peptide (NT-proBNP), LVEF, New York Heart Association (NYHA) class, body mass index (BMI), and QRS complex on electrocardiogram (ECG) are prognostic indicators for DCM patients. To date, LVEF has been used as a critical criterion for selecting patients with DCM for the primary prevention of sudden all-cause death.3 However, many patients do not have a markedly reduced LVEF in DCM or out-of-hospital cardiac arrest; meanwhile, many patients with reduced LVEF will die from non-sudden causes of death. Therefore, the underlying mechanisms of DCM still need to be further investigated, especially with regard to the progression of LV heterogeneity, deterioration in ventricular contractile function, and LV mechanical dyssynchrony.4–6
Texture analysis (TA) is a group of computational methods that can extract information and quantify inhomogeneity in adjacent voxels according to the underlying texture by evaluating subtle structural changes that cannot be observed with the naked eye. It has been applied to assess tumor grade and stage, monitor tumor progression, evaluate treatment effects, and predict long-term prognosis in different cancers.7,8 Meanwhile, the TA features measured from the segmented lung regions were used for statistical analysis with a high interpretability to detect COVID-19 infection.9 Over the last few years, TA has been increasingly used in heart diseases, including cardiac sarcoidosis and cardiomyopathy.10–12 However, few studies have reported the application of TA based on SPECT for predicting prognosis in patients with DCM. We hypothesized that a radiomic approach using TA on quantitative rest-SPECT MPI images could be an independent predictor of survival in patients with DCM. The purpose of this study was to evaluate the validity of TA based on SPECT MPI for predicting prognosis in patients with DCM.
MATERIALS AND METHODS
Patients
Eighty-eight patients with DCM were enrolled in our retrospective study at the First Affiliated Nanjing Medical University Hospital from September 2009 to July 2021. The inclusion criteria of DCM were based on international consensus diagnostic criteria.13 DCM was defined as dilated and hypokinetic LV or both ventricles (with or without associated right ventricular dysfunction). Other exclusion criteria for all patients were as follows: coronary artery disease, valvular heart disease, hypertensive heart disease, alcoholism, inflammatory myocardial disease, peripartum cardiomyopathy, or specific myocardial disease secondary to any known systemic disease. Patients with epicardial coronary artery stenosis ≥ 50% were excluded according to dual-source CT coronary angiography or invasive coronary angiography. Patients with atrial fibrillation were also excluded due to high heart rate variability, which might influence the acquisition of optimal and accurate SPECT images. Furthermore, patients with pacemaker treatment were also excluded. Informed consent was obtained from all participants at the First Affiliated Hospital of Nanjing Medical University.
Electrocardiography
A 12-lead surface continuous electrocardiogram (ECG) was acquired at rest during hospitalization. The QRS duration on ECG was calculated among the widest QRS complexes. The majority of patients underwent Holter ECG recording for 24 hours, and recordings were analyzed by operator-controlled analysis. Non-sustained ventricular tachycardia (NS-VT) was defined as at least 3 consecutive ventricular ectopic beats in 24-hour Holter monitoring data. LVEF was measured on echocardiography according to standard transthoracic echocardiography by two experienced ultrasound experts.
Gated myocardial perfusion SPECT
The rest Gated SPECT MPI images were obtained 60 minutes after injecting approximately 20–30 mCi technetium-99m sestamibi using a dual-headed camera (CardioMD, Philips Medical Systems) with a 20% energy window centered at approximately 140 keV. Gated SPECT acquisition involved 8 frames per cardiac cycle with a body-contour orbit of 180 and 64 planar projections (32 steps with 25 s per step). Image reconstruction and reorientation were performed using the Emory Reconstruction Toolbox (ERToolbox; Syntermed, Atlanta, GA). All images in each cardiac frame were then put into an automatic myocardial sampling algorithm for maximal count circumferential profiles as previously described.14 The resulting gated short-axis images were sent to an interactive tool for accessing LV parameters according to an automatic myocardial sampling algorithm in each cardiac frame by searching the maximal count circumferential profiles. Reduced wall thickening was defined as the percentage of area with below 50% of the maximum wall thickening throughout one cardiac cycle.15,16
The 3D TA process of this article is shown in Figure 1. First, the remaining ungated short-axis images were sampled based on the dynamic programming method to obtain a 3D myocardial perfusion surface.15 And then, the 3D surface with the perfusion data was processed with a freely available Python software package to extract 3D TA features.17
Figure 1.
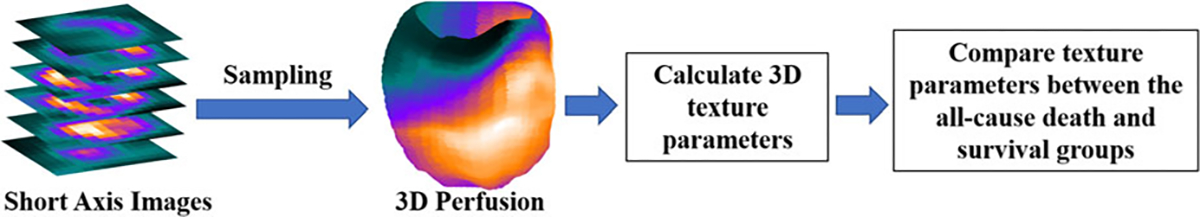
Flowchart of texture analysis to extract clinical parameters from SPECT myocardial perfusion images.
TA parameters include the first-order statistics and second-order texture features. The first-order statistical feature set consisted of histogram analysis, including SD (SD Hist), skewness, kurtosis, entropy hist, and energy hist. The second-order texture feature set consisted of other 31 statistics texture statistics based on the gray-level cooccurrence matrix (GLCM), gray-level run-length matrix (GLRLM), gray-level zone length matrix (GLZLM), and neighborhood gray-level difference matrix (NGLDM) (Table 1). Finally, the 3D TA features were compared between the all-cause death group and the survivor group.
Table 1.
Patient demographics and texture parameters
| Variables | All (n = 88) | Survivors (n = 63) | Deaths (n = 25) | P-value |
|---|---|---|---|---|
|
| ||||
| Age(year) | 54.7±15.9 | 53.8±16.3 | 57.1±15.0 | 0.313 |
| Male (n, %) | 69(78.4) | 51(81.0) | 18(72.0) | 0.357 |
| Hypertension (n, %) | 34(38.6) | 28(44.4) | 6(24.0) | 0.076 |
| Diabetes (n, %) | 17(19.3) | 14(22.2) | 3(12.0) | 0.273 |
| CLBBB (n, %) | 21(30.9) | 16(25.4) | 5(25.0) | 0.592 |
| QRS duration (ms) | 124.5±34.0 | 121.5±34.0 | 131.4±38.5 | 0.281 |
| NS-VT (n, %) | 41(50.6) | 25(44.6) | 16(64) | 0.107 |
| NS-VT (number of frequency) | 8.01±22.51 | 5.41±17.69 | 14.56±31.08 | 0.001 |
| NT-proBNP | 2731.8±3696.8 | 2196.8±2279.7 | 4393.1±6153.4 | 0.021 |
| NYHA cIass(I/II/III) | 20/25/43 | 18/20/25 | 2/5/18 | 0.005 |
| Medication | ||||
| β-blockers | 85(96.6%) | 61(96.8%) | 24(96.0%) | 1.000 |
| Diuretics | 73(83.0%) | 51(81.0%) | 22(88.0%) | 0.632 |
| Digoxin | 17(19.3%) | 9(14.3%) | 8(32.0%) | 0.110 |
| RAS bIockers | 81(92.0%) | 58(95.2%) | 21(84.0%) | 0.187 |
| LV parameters | ||||
| EDV (mm) | 264.42±108.74 | 238.48±92.64 | 329.80±120.31 | 0.0003 |
| ESV | 204.95±102.47 | 179.48±88.03 | 269.16±109.75 | 0.0001 |
| LVEF (%) | 25.19±10.50 | 27.33±10.96 | 19.80±6.86 | 0.002 |
| TPD (%) | 10.65±9.17 | 8.33±6.96 | 16.48±11.42 | 0.0006 |
| Reduced wall thickening (%) | 17.7±13.0 | 14.2±11.2 | 26.6±13.1 | 0.000 |
| Texture parameters | ||||
| SUV mean | 139.17±16.54 | 142.48±14.96 | 130.82±17.67 | 0.002 |
| Num of voxels | 760.0(600.0, 920.0) | 760.0(600.0, 920.0) | 800.0(600.0, 800.0) | 0.094 |
| SD hist | 12.175±1.085 | 11.941±1.051 | 12.764±0.953 | 0.001 |
| Skewness | −0.196±0.471 | −0.252±0.466 | −0.054±0.462 | 0.074 |
| Kurtosis | 0.047(−0.818, 3.296) | 0.131(−0.818, 3.296) | −0.238(−0.805, 1.404) | 0.026 |
| Energy Hist | 0.029(0.022, 0.044) | 0.029(0.024, 0.044) | 0.026(0.022, 0.032) | 0.005 |
| Entropy Hist | 3.766±0.102 | 3.743±0.100 | 3.823±0.0835 | 0.001 |
| Correlation GLCM | 0.842(0.684, 0.908) | 0.834(0.834, 0.908) | 0.862(0.711, 0.904) | 0.001 |
| SRE | 0.0978±0.00034 | 0.0977±0.00032 | 0.0980±0.00030 | 0.001 |
| LRE | 1.096±0.016 | 1.100±0.015 | 1.087±0.014 | 0.0004 |
| LGLE | 0.0079(0.0040, 0.0252) | 0.0076(0.0040, 0.0167) | 0.0096(0.0049, 0.0252) | 0.006 |
| HGLE | 1472.15±266.61 | 1523.51±246.61 | 1342.73±276.01 | 0.004 |
| SRLGE | 0.0077(0.0040, 0.0230) | 0.0074(0.0040, 0.0162) | 0.0091(0.0049, 0.0230) | 0.007 |
| SRHGE | 1439.04±257.14 | 1487.90±238.10 | 1315.89±266.80 | 0.004 |
| LRLGE | 0.009(0.0040, 0.0342) | 0.0083(0.0040, 0.0217) | 0.0110(0.0050, 0.0342) | 0.003 |
| LRHGE | 1615.84±308.85 | 1678.38±284.53 | 1458.23±317.02 | 0.002 |
| RLNU | 466.41(265.77, 656.69) | 443.21(265.77, 621.31) | 499.58(375.43, 656.69) | 0.001 |
| RP | 0.9705±0.0045 | 0.9695±0.0043 | 0.9731±0.0041 | 0.0005 |
| SZE | 0.0768±0.0030 | 0.0761±0.0029 | 0.0785±0.0027 | 0.001 |
| LZE | 3.26±0.59 | 3.38±0.59 | 2.95±0.46 | 0.002 |
| SZLGE | 0.000086(0.000075, 0.000111) | 0.000085(0.000075, 0.000099) | 0.000087(0.000077, 0.000111) | 0.025 |
| LZLGE | 0.0004(0.0003, 0.0006) | 0.004(0.0003, 0.0006) | 0.0003(0.0003, 0.000506) | 0.063 |
| LZHGE | 31525.15±6415.47 | 33004.91±6250.19 | 27796.15±5296.05 | 0.0004 |
| GLNUz | 7.97±1.46 | 7.68±1.3 | 8.71±1.52 | 0.002 |
| ZLNU | 187.22±45.15 | 173.19±37.64 | 222.56±43.72 | 0.00001 |
| ZP | 0.676±0.039 | 0.666±0.036 | 0.699±0.037 | 0.0002 |
| Coarseness NGLDM | 0.052±0.008 | 0.053±0.008 | 0.048±0.007 | 0.008 |
| Contrast NGLDM | 0.148±0.036 | 0.142±0.034 | 0.163±0.037 | 0.014 |
| Busyness NGLDM | 0.010(0.005, 0.026) | 0.010(0.005, 0.015) | 0.012(0.007, 0.026) | 0.001 |
Data are expressed as mean ± SD, median, or number (percentage)
NT-proBNP N-terminal pro-brain natriuretic peptide, NS-VT non-sustained ventricular tachycardia, PVC premature ventricular contraction, CLBBB complete left bundle branch block, NYHA New York Heart Association, EDV end-diastolic volume, ESV end-systolic volume, RAS blockers renin-angiotensin system blockers, SD Hist standard deviation histogram, GLCM gray-level cooccurrence matrix, NGLDM neighborhood gray-level difference matrix, SRE short-run emphasis, LRE long-run emphasis, LGLE low gray-level emphasis, HGLE high gray-level emphasis, SRLGE short-run low gray-level emphasis, SRHGE short-run high gray-level emphasis, LRLGE long-run low gray-level emphasis, LRHGE long-run high gray-level emphasis, GLNU gray-level non-uniformity for run, RLNU run-length non-uniformity, RP run percentage. SZE short-zone emphasis, LZE long-zone emphasis, SZLGE short-zone low gray-level emphasis, LZLGE long-zone low gray-level emphasis, LZHGE long-zone high gray-level emphasis, GLNUz gray-level non-uniformity for zone, ZLNU zone length non-uniformity, ZP zone percentage
Follow-up after SPECT MPI
Patient information was derived by collecting hospitalization records and checking government records, as well as making telephone contact with patients or relatives. The primary endpoint of the study was all-cause death and the secondary endpoint included heart failure, ventricular arrhythmic events, multiple organ failure and sudden cardiac death. The follow-up time was defined as the interval from the diagnosis of DCM to the end of follow-up or all-cause death.
Statistical analysis
Normality of continuous variables was judged by the Kolmogorov–Smirnov test and Q–Q plots, which were presented as the mean or median. Categorical variables were expressed as numbers and percentages. To distinguish differences between the cardiac survival group and the death group, two-sample T tests, Wilcoxon rank sum tests, and chi-squared tests were performed for clinical features, SPECT features, and TA features when appropriate. The variables with significant differences were calculated using univariate logistic regression analysis to determine correlations with clinical outcomes. Univariate and multivariate regression analyses were applied to calculate the hazard ratio (HR) and 95% confidence interval (CI). Variables with a P<0.1 in univariate logistic regression analysis created the multivariate logistic regression model to select independent predictors for survival. The optimal cut-off value for independent prognostic predictor texture parameters was determined by receiver operating characteristic curve analysis and then the Kaplan–Meier event-free survival curves were compared using the log-rank test. The incremental values of adding LGLE and LRLGE to multivariable regression models were studied by calculating the improvement of X2 values. P<0.05 was deemed to have statistical significance.
RESULTS
Patient characteristics
Table 1 summarizes the baseline demographic information of the patients. The examples of SPECT MPI images are demonstrated as 2D polar maps in Figure 2. A total of 88 patients (54.7±15.9 years, 69 male) were followed up for 39.2±28.7 months. Twenty-five (28.4%) patients died during follow-up and were categorized into the all-cause death group and the rest of the patients were categorized into the survival group. Ten patients died with heart failure, four patients with ventricular arrhythmic events, five patients with multiple organ failure, and two patients with sudden cardiac death. Cause of death was not clear in the remaining four patients but they were identified as death by checking government records. Moreover, rehospitalization was significantly different in the all-cause death group and survival group (12 vs 17, P < 0.01). There was no statistical significance in age, hypertension, diabetes, QRS duration, complete left bundle branch block (CLBBB), or NS-VT between the two groups (all P > 0.05). Meanwhile, all patients received guideline-directed medical therapy for heart failure, and no differences were observed in any type of medicine, including diuretics (83.0% of patients), RAS blockers (92.0%), beta-blockers (96.6% of patients), and digoxin (19.3% of patients).
Figure 2.

2D perfusion polar maps of patients with low and high values of LGLE and LRLGE. Patient (A) had a low value of LGLE and Patient (B) had a low value of LRLGE. By contrast, patients (C) and (D) showed high values of LGLE and LRLGE, respectively. LGLE, low gray-level emphasis; LRLGE, long-run low gray-level emphasis. Both LGLE and LRLGE are calculated from 3D perfusion maps as illustrated in Figure 1.
However, NT-proBNP, NYHA functional class, and baseline LV parameters, including EDV, ESV, and LVEF, were significantly different (all P < 0.05) between the two groups. Compared with the survival group, the total perfusion deficit (TPD) in the all-cause death group was distinctly higher than that in the death group (P = 0.006). Meanwhile, reduced wall thickening was much higher in the death group compared with the survival group (26.6+13.1 vs 14.2+11.2, P < 0.01). However, LGLE and LRLGE had no significant correlation with reduced wall thickening (r = 0.490, P = 0.075; r = 0.409, P = 0.089, respectively). Moreover, for TA parameters, 26 features (61.9%) were significantly different between the all-cause death group and the survival group (all P < 0.05) (Table 1).
Figure 3 shows the relationship between TA and left ventricular parameters. There was no relationship between LVEF and TPD (r = − 0.126, P = 0.244). Meanwhile, both low gray-level emphasis (LGLE) and long-run low gray-level emphasis (LRLGE) had no significant correlation with LVEF (r = 0.371, P = 0.005; r = 0.371, P = 0.005, respectively). However, LGLE was moderately correlated with TPD levels (r = 0.371, P = 0.005), and a positive relationship was also observed between LRLGE and TPD (r = 0.358, P = 0.006). Moreover, LGLE was strongly correlated with LRLGE (r = 0.986, P < 0.001).
Figure 3.
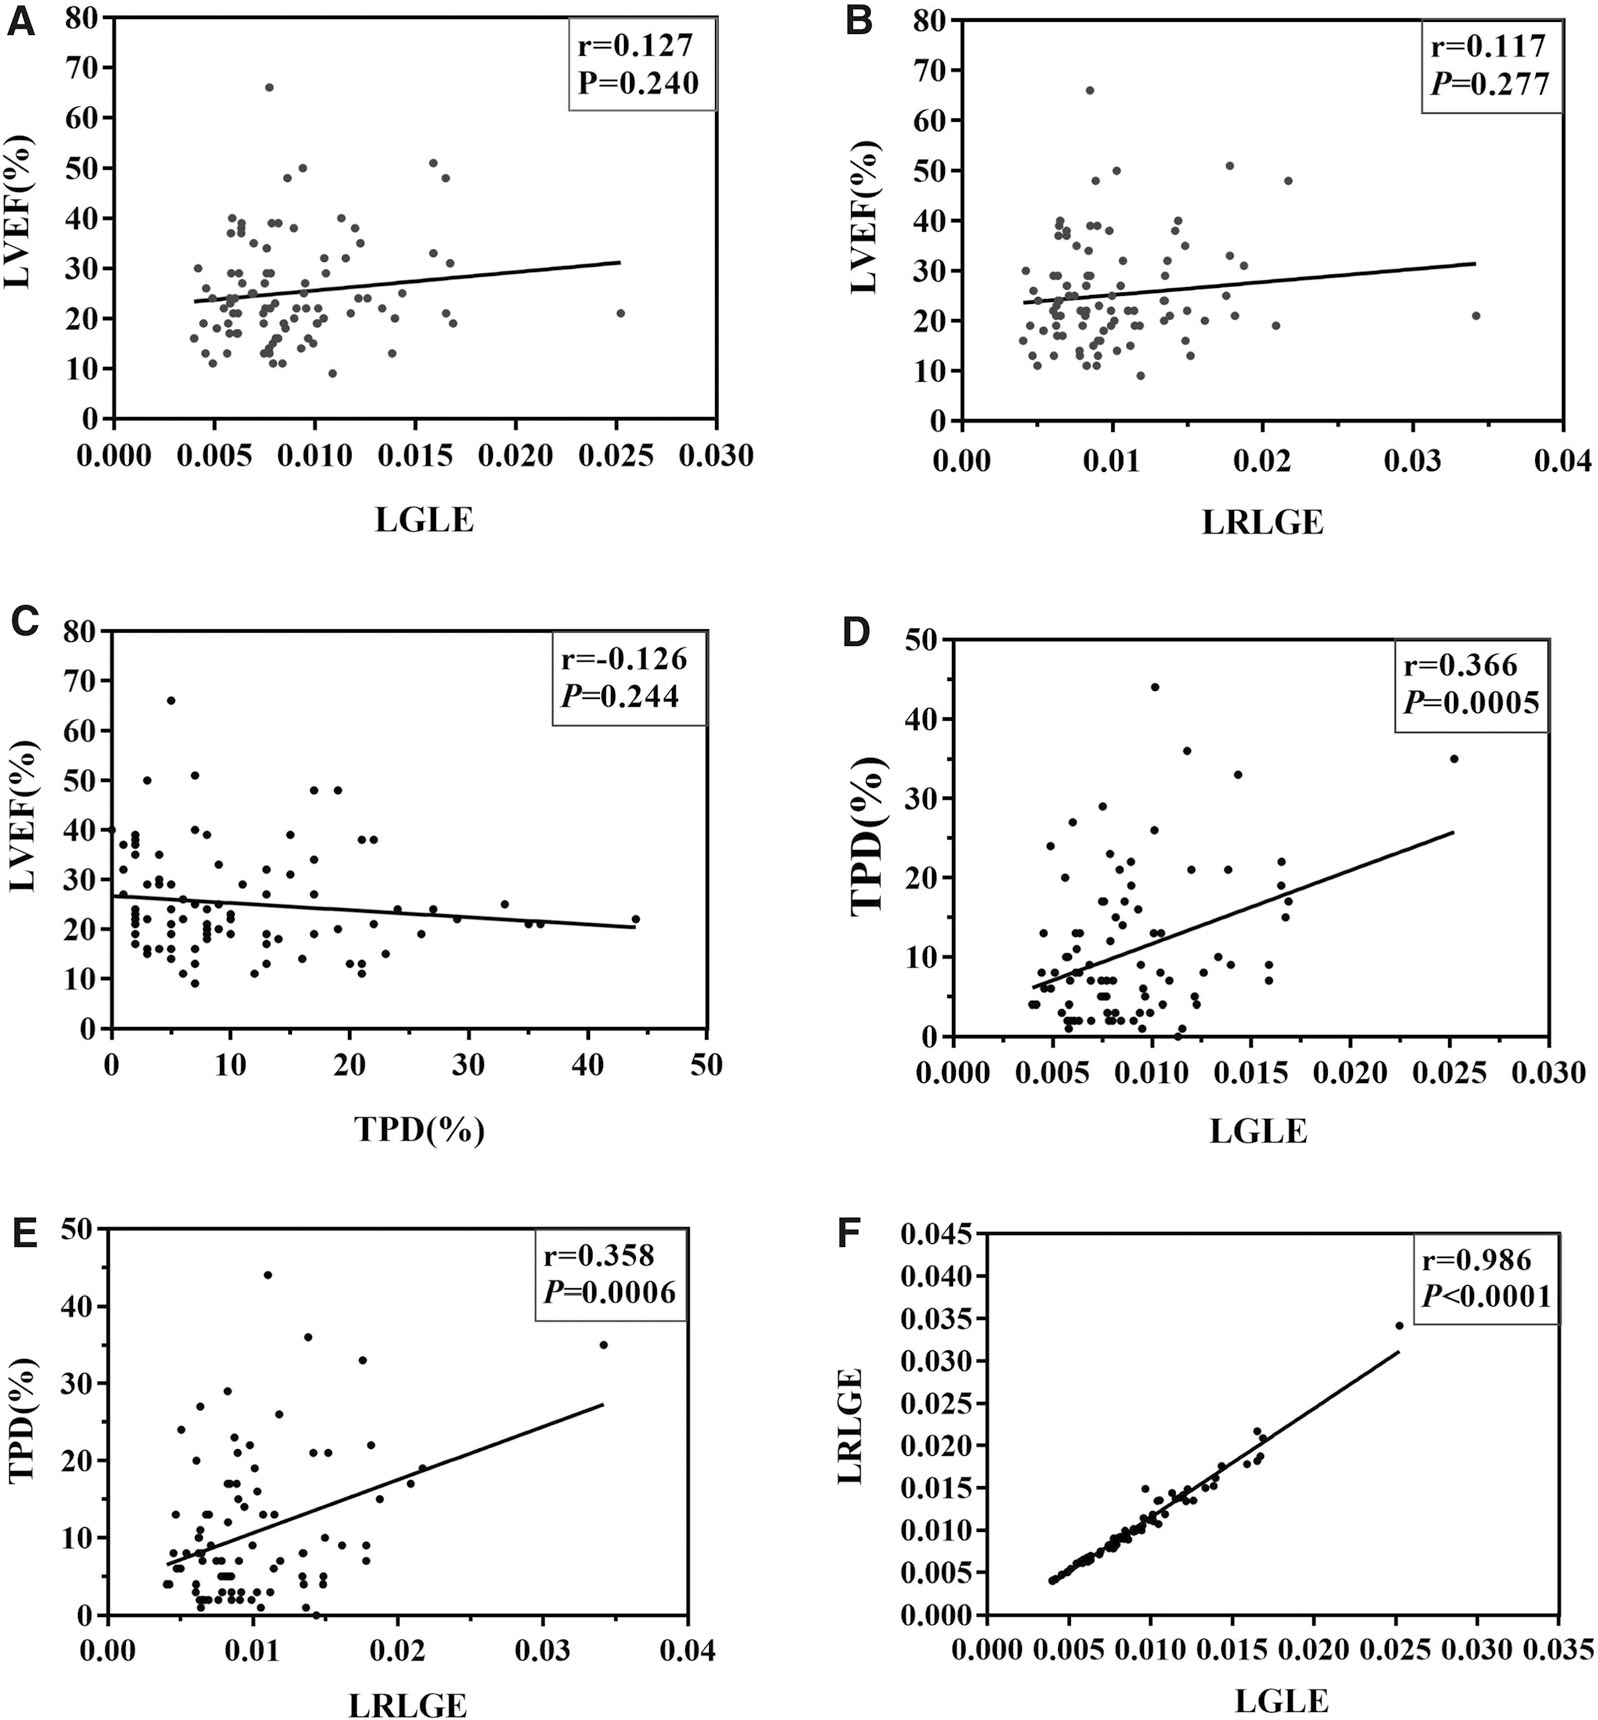
Correlations between LVEF, TPD, LGLE, and LRLGE. (A) and (B) Both LGLE and LRLGE had no significant correlation with LVEF (r = 0.371, P = 0.005; r = 0.371, P = 0.005, respectively). (C) There was no relationship between LVEF and TPD (r = − 0.126, P = 0.244). (D) LGLE was moderately correlated with the TPD (r = 0.371, P = 0.005). (E) A positive relationship was observed between LRLGE and TPD (r = 0.358, P = 0.006). (F) LGLE was strongly correlated with LRLGE (r = 0.986, P < 0.001).
Prediction for all-cause death
Table 2 shows the results of all clinical parameters, TPD, and TA features analyzed in univariate Cox regression models. In univariate Cox regression analysis, hypertension, NT-proBNP, LVEF, TPD, and 25 TA parameters were significantly associated with all-cause death (P < 0.10). When 25 TA parameters were input into multivariate Cox regression models, LGLE (HR = 4.698, 95% CI 1.457–15.145, P = 0.010) and LRLGE (HR = 6.085, 95% CI 1.906–19.422, P = 0.002) were independent predictors of all-cause death, along with NT-proBNP, LVEF, and TPD (Tables 3 and 4). In the Kaplan–Meier survival analysis for cardiac survival (Figure 4), the lower LGLE and LRLGE groups had a better prognosis than the higher group in the long-term follow-up (log-rank χ2 = 4.46, P = 0.035, log-rank χ2 = 4.46, P = 0.035, respectively).
Table 2.
Univariate Cox results of clinical and SPECT texture parameters significantly associated with all-cause death
| Variables | P-value | Hazard ratio | 95% CI |
|---|---|---|---|
|
| |||
| Age | 0.302 | 1.013 | 0.988–1.039 |
| Gender | 0.287 | 1.609 | 0.671–3.861 |
| Hypertension | 0.073 | 0.430 | 0.171–1.082 |
| Diabetes | 0.274 | 0.509 | 0.152–1.705 |
| CLBBB | 0.929 | 0.957 | 0.358–2.559 |
| QRS duration | 0.104 | 1.009 | 0.998–1.020 |
| NS-VT | 0.155 | 1.811 | 0.799–4.103 |
| NT-proBNP | 0.014 | 1.000 | 1.0000–1.0002 |
| NYHA class II/III/IV | 0.315 | 2.317 | 2.317–11.951 |
| EDV | 0.0004 | 1.006 | 1.003–1.009 |
| ESV | 0.0001 | 1.007 | 1.003–1.010 |
| LVEF | 0.003 | 0.915 | 0.863–0.970 |
| TPD | 0.0001 | 1.072 | 1.035–1.110 |
| Texture parameters | |||
| SUV mean | 0.001 | 0.961 | 0.939–0.984 |
| Num of voxels | 0.109 | 1.005 | 0.999–1.011 |
| SUV sum | 0.172 | 1.000 | 0.99996–1.00001 |
| SD hist | 0.005 | 1.799 | 1.194–2.713 |
| Skewness | 0.036 | 2.531 | 1.062–6.031 |
| Kurtosis | 0.0547 | 0.517 | 0.263–1.013 |
| Energy hist | 0.085 | 2.098 | 0.903–4.874 |
| Entropy hist | 0.014 | 0.316 | 0.126–0.794 |
| Homogeneity GLCM | 0.719 | 0.865 | 0.392–1.908 |
| Energy GLCM | 0.780 | 0.893 | 0.405–1.970 |
| Correlation GLCM | 0.008 | 0.307 | 0.128–0.737 |
| Contrast GLCM | 0.189 | 0.978 | 0.946–1.011 |
| Entropy GLCM | 0.628 | 0.789 | 0.153–4.082 |
| Dissimilarity GLCM | 0.155 | 0.695 | 0.421–1.148 |
| SRE | 0.031 | 0.381 | 0.159–0.914 |
| LRE | 0.033 | 2.582 | 1.077–6.190 |
| LGLE | 0.095 | 2.180 | 0.878–5.062 |
| HGLE | 0.003 | 0.998 | 0.996–0.999 |
| SRLGE | 0.148 | 0.536 | 0.230–1.248 |
| SRHGE | 0.003 | 0.998 | 0.996–0.999 |
| LRLGE | 0.068 | 2.261 | 0.941–5.434 |
| LRHGE | 0.002 | 0.998 | 0.997–0.999 |
| GLNUr | 0.062 | 1.175 | 0.992–1.391 |
| RLNU | 0.0006 | 1.008 | 1.003–1.013 |
| RP | 0.029 | 0.376 | 0.157–0.902 |
| SZE | 0.158 | 0.555 | 0.245–1.258 |
| LZE | 0.005 | 0.302 | 0.130–0.703 |
| LGZE | 0.703 | 0.858 | 0.390–1.885 |
| HGZE | 0.080 | 0.999 | 0.999–1.000 |
| SZLGE | 0.037 | 0.418 | 0.184–0.949 |
| SZHGE | 0.624 | 1.000 | 0.999–1.001 |
| LZLGE | 0.126 | 1.928 | 0.831–4.474 |
| LZHGE | 0.001 | 1.000 | 0.9998–0.9999 |
| GLNUz | 0.002 | 1.512 | 1.162–1.968 |
| ZLNU | 0.00001 | 1.019 | 1.011–1.028 |
| ZP | 0.010 | 0.297 | 0.119–0.745 |
| Coarseness NGLDM | 0.251 | 1.594 | 0.719–3.534 |
| Contrast NGLDM | 0.110 | 0.503 | 0.217–1.168 |
| Busyness NGLDM | 0.018 | 0.350 | 0.146–0.838 |
Table 3.
Multivariate Cox results of clinical and SPECT texture parameters significantly associated with all-cause death, including LGLE
| Variables | Wald | P value | Hazard ratio | 95% CI |
|---|---|---|---|---|
|
| ||||
| Hypertension | 1.701 | 0.1921 | 0.416 | 0.111–1.554 |
| NT-proBNP | 8.235 | 0.004 | 1.000 | 1.0000–1.0002 |
| LVEF | 8.078 | 0.004 | 0.904 | 0.843–0.969 |
| TPD | 5.496 | 0.019 | 1.061 | 1.010–1.115 |
| LGLE | 6.710 | 0.010 | 4.698 | 1.457–15.145 |
Table 4.
Multivariate Cox results of clinical and SPECT texture parameters significantly associated with all-cause death, including LRLGE
| Variables | Wald | P value | Hazard ratio | 95% CI |
|---|---|---|---|---|
|
| ||||
| Hypertension | 2.178 | 0.140 | 0.377 | 0.103–1.378 |
| NT-proBNP | 8.064 | 0.005 | 1.000 | 1.0001–1.0003 |
| LVEF | 9.347 | 0.002 | 0.891 | 0.828–0.960 |
| TPD | 5.454 | 0.020 | 1.060 | 1.009–1.113 |
| LRLGE | 9.299 | 0.002 | 6.085 | 1.906–19.422 |
Figure 4.
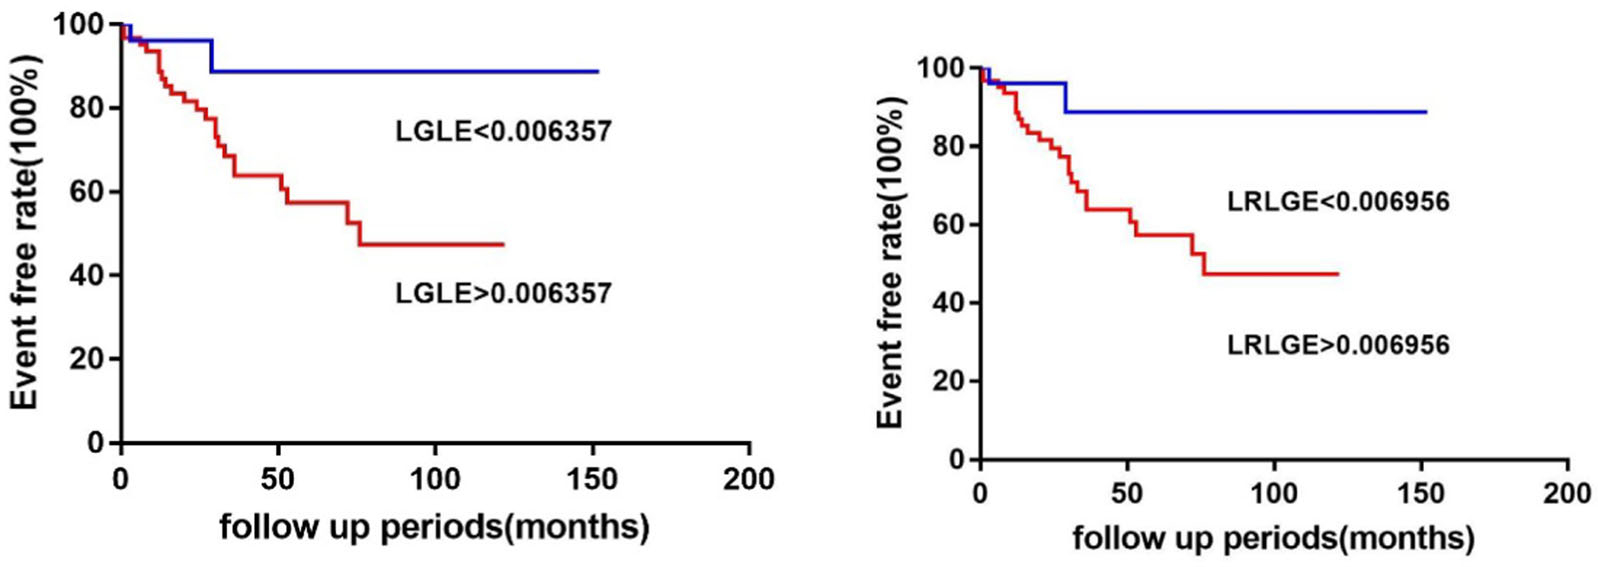
The Kaplan–Meier event-free survival curve for LGLE (log-rank χ2 = 4.46, P = 0.035) and for LRLGE (log-rank χ2 = 4.46, P = 0.035).
Figure 5 shows the application of the likelihood ratio test to compare variables in all multivariable regression models. After multivariable adjustment for clinical parameters, sequential models indicated that the addition of TPD (global chi-square statistic of 18.923 vs. 26.246; P = 0.012) was more associated with all-cause death. When LGLE and LRLGE were separately input into the sequential models, the addition of LGLE and LRLGE significantly increased the power of the models for predicting all-cause death in DCM with a higher X2 value (global chi-square statistic of 26.246 vs. 33.521; P = 0.028, global chi-square statistic of 26.246 vs. 34.711; P = 0.004).
Figure 5.

Incremental prognostic value of LGLE (A) and LRLGE (B) by the global chi-square statistics in two multivariable-adjusted models for predicting all-cause death in DCM. When LGLE and LRLGE were separately input into the sequential models, both of them significantly increased the power of the models for predicting all-cause death in DCM with a higher X2 value (global chi-square statistic of 26.246 vs. 33.521; P = 0.028, global chi-square statistic of 26.246 vs. 34.711; P = 0.004).
DISCUSSION
The main findings of our study are as follows: TA of gated SPECT MPI was an independent prognostic predictor of all-cause death in medically treated patients with DCM. The multivariate analyses demonstrated that LGLE and LRLGE, derived from texture features based on gated SPECT MPI, were significant predictors of DCM. Moreover, TA parameters, independent of the total perfusion deficit of the cardiac myocardium, provide incremental prognostic value for DCM patients.
Advantages of texture analysis
Since the 1990s, the application of TA has been expanded after using magnetic resonance imaging (MRI), Positron emission tomography (PET), CT, and 2-DE for clinical assessments of morphological characteristics.18 TA is a group of computational methods that can extract information and quantify inhomogeneity in adjacent voxels for recognizing, classifying, and segmenting parameters according to the underlying texture by evaluating subtle structural changes that cannot be observed with the naked eye.
In a previous study, TA was widely used in various tumors for predicting tumor progression, assessing responses to treatment and prognosis. In recent years, TA has shown promising diagnostic efficacy and predictive value in cardiac disease. Manabe O et al. reported that TA based on myocardial 18F-FDG could not only be applied to diagnose cardiac sarcoidosis10 but also added prognostic value to the prediction of major adverse cardiovascular events beyond the traditional 18F-FDG parameters in cardiac sarcoidosis.12 Kotu et al.19 reported that TA based on CMR (cardiac magnetic resonance) could perform risk stratification after myocardial infarction and predict arrhythmia during follow-up. Meanwhile, scar heterogeneity assessed by TA could provide independent and complementary information to scar burden compared with traditional analysis methods valued by CMR in CAD patients.20 Moreover, TA was not only applied to the study of ischemic cardiomyopathy but also to non-ischemic cardiomyopathy. D Alis et al.21 found that machine learning-based TA of late gadolinium enhancement images on CMR could assess the presence of ventricular tachyarrhythmia (VT) in hypertrophic cardiomyopathy. To date, there are few data on the clinical value of texture analysis based on gated SPECT MPI. In recent years, a number of studies12,21,22 have demonstrated promising results using SPECT texture analysis in cardiac disease management. Mohammad Edalat-Javid et al.23 proved that TA from SPECT/CT had good repeatability and reproducibility in different image acquisition and reconstruction protocols. Moreover, the prevalence of SPECT scans is significantly higher than that of PET exams worldwide, which could enable higher collections of such data-oriented SPECT research in cardiac disease. In our present study, we demonstrated that TA of gated SPECT MPI was an independent prognostic predictor of all-cause death in non-ischemic DCM. The global scar burden has already been refined as an effective prognostic predictor of major cardiac events in a previous study.24 In our study, total perfusion deficit (TPD) was calculated based on both the extent and severity of myocardium perfusion for all circular activity profiles from quantitative analysis of QGS software.25 Previous studies26,27 have already found that TPD was an effective parameter for the predictors of death in cardiac disease over a long-term follow-up (over 5 years). The presence of TPD means that the availability of recruitable cardiomyocytes is reduced to bolster myocardial pump and LV hemodynamics, which could greatly influence the survival of DCM. Our results confirmed a previous study that TPD from gated SPECT MPI was a valuable prognostic parameter in non-ischemic DCM.28 Furthermore, with excellent reproducibility and reliability, TA based on gated SPECT MPI could provide more extensive and in-depth knowledge about features of the myocardium.23 In our study, TA parameters, independent of TPD of the cardiac myocardium, provided incremental prognostic value for non-ischemic DCM patients.
The clinical significance of different texture analysis parameters in DCM
In the present study, 65.0% of TA parameters showed a significant difference between the all-cause death group and the survival group in DCM. Furthermore, LGLE and LRLGE, derived from gray-level run-length matrix (GLRLM) based on gated SPECT MPI, were significantly independent predictors of DCM. From our results, it seems that not only the total perfusion deficit of the cardiac myocardium but also the LGLE and LRLGE have predictive value. Theoretically, GLRLM assesses run length or frequencies of a consecutive sequence of voxels with the same gray length along a certain direction. Furthermore, LRLGE represents the distribution of long runs and low gray level derived from the gray-level run-length matrix; the higher long-run low gray-level non-uniformity appeared to be an independent predictor in DCM in our study. LGLE represents the distribution of low gray-level values, which is calculated by distributing weights in different patterns on the GLRLM matrix and then performing a weighted average based on these patterns to arrive at a single number. In our present work, a higher LGLE was associated with more all-cause death in DCM. Jian-Dong Yin et al.29 reported that texture features, including LRLGE extracted from MRI, were useful clues for accurately evaluating pathological T and N stages in rectal cancer. François Lucia30 found that TA features such as entropy GLCM and GLRLM from DWI-MRI and PET were independent predictors of recurrence in advanced cervical cancer patients receiving chemoradiotherapy, and higher values of entropy GLCM and GLRLM had significantly higher values than conventional clinical parameters in predicting worse outcomes. Meanwhile, Kolossvary31 reported that a large number of radiomic features were different between NRS and non-NRS plaques, and these parameters had the potential to identify a qualitative high-risk plaque feature in the coronary lumen. Furthermore, LRLGE in TA based on CT angiography quantitatively describes qualitative plaque morphologies on coronary lesions and could differentiate between plaques with or without the Napkin ring sign.
Nevertheless, the potential mechanism between TA and all-cause death in our research remains to be elucidated. A reasonable speculation is that the high LRLGE and LGLE in our study indicate the increasing heterogeneity of the myocardium, which implies the uneven density pattern in the myocardium and reflects the abnormal alignment of the myofibrils. In general, the mechanisms underlying DCM have not been precisely identified, especially those for cardiac chamber dilatation and systolic disturbances leading to deteriorated heterogeneity.6 Meanwhile, progression of LV heterogeneity creates irregular and inhomogeneous electrical and mechanical coupling, which may further produce ventricular arrhythmia and result in sudden death. Our study also observed a tendency of high NS-VT in both the high LGLE and LRLGE groups, although the difference was not significant. A possible explanation is that the population size is still small with a relatively low incidence of NS-VT. Although an increasing number of imaging technologies have been used to identify myocardial heterogeneity and fibrosis, including 2-DE, MRI, PET, and CT, accurate recognition is still a major challenge for present clinical practice. Therefore, as a novel image analysis technique, TA may also provide unique insights into cardiac disease pathophysiology at the tissue level. Although the underlying mechanisms of TA based on gated SPECT MPI remain to be further investigated, our study demonstrates that TA in DCM has incremental value in predicting adverse cardiac events combined with TPD.
LIMITATIONS
First, the population of enrolled patients was relatively small, which is a disadvantage for screening the predictive factors of adverse cardiac events. Second, although all individuals received only medical treatment without any assistant cardiac devices, the therapeutic schedule might be biased for analysis and cause variability in the clinical outcome during follow-up. In addition, although a previous study has already validated the reproducibility and reliability of TA parameters, more clinical cardiac studies are needed to explore the stability in larger patient samples with different etiologies of cardiac diseases. Moreover, quantification of TA could be influenced by partial volume. Differences in regional wall thickness were not measured for comparison/correlation with TA, which could be the aim of our future evaluations. Thus, the development of a standard protocol of TA based on SPECT images will be necessary in future.
NEW KNOWLEDGE GAINED
Texture analysis of gated SPECT MPI provides independent prognostic predictors of all-cause death in medically treated patients with DCM. Low gray-level emphasis (LGLE) and long-run low gray-level emphasis (LRLGE), derived from texture features, were significant predictors of the survival outcome.
CONCLUSION
Texture analysis of gated SPECT MPI was an independent prognostic predictor of all-cause death in medically treated patients with DCM. Moreover, TA parameters, including LGLE and LRLGE, independent of the total perfusion deficit of the cardiac myocardium, provide incremental prognostic value for DCM patients.
Supplementary Material
Funding
This research was supported by a grant from the American Heart Association (Project Number: 17AIREA33700016, PI: Weihua Zhou), a new faculty Grant from Michigan Technological University Institute of Computing and Cybersystems (PI: Weihua Zhou), and Grants from the National Nature Science Foundation of China (81900295 and 82100338) and the Natural Science Foundation of Jiangsu Province (BK 20191071).
Abbreviations
- SPECT
Single-photon emission tomography
- MPI
myocardial perfusion imaging
- LVEF
Left ventricular ejection fraction
- TPD
Total perfusion deficit
- TA
Texture analysis
- DCM
Dilated cardiomyopathy
- GLRLM
Gray-level run-length matrix
- LGLE
Low gray-level emphasis
- LRLGE
Long-run low gray-level emphasis
Footnotes
Disclosures
Cheng Wang, Ying Ma, Yanyun Liu, Longxi Li, Chang Cui, Huiyuan Qin, Zhongqiang Zhao, Chunxiang Li, Weizhu Ju, Minglong Chen, Dianfu Li, and Weihua Zhou declare that there are no conflict of interest.
The authors of this article have provided a PowerPoint file, available for download at SpringerLink, which summarizes the contents of the paper and is free for re-use at meetings and presentations. Search for the article DOI on SpringerLink.com.
The authors have also provided an audio summary of the article, which is available to download as ESM, or to listen to via the JNC/ASNC Podcast.
Supplementary Information The online version contains supplementary material available at https://doi.org/10.1007/s12350-022-03006-4.
References
- 1.Maron BJ, Towbin JA, Thiene G, Antzelevitch C, Corrado D, Arnett D. Contemporary definitions and classification of the cardiomyopathies: an American Heart Association Scientific Statement from the Council on Clinical Cardiology, Heart Failure and Transplantation Committee; Quality of Care and Outcomes Research and Functional Genomics and Translational Biology Interdisciplinary Working Groups; and Council on Epidemiology and Prevention. Circulation 2006;113:1807–16. [DOI] [PubMed] [Google Scholar]
- 2.Japp AG, Gulati A, Cook SA, Cowie MR, Prasad SK. The diagnosis and evaluation of dilated cardiomyopathy. J Am Coll Cardiol 2016;67:2996–3010. [DOI] [PubMed] [Google Scholar]
- 3.Halliday BP, Cleland JGF, Goldberger JJ, Prasad SK. Personalizing risk stratification for sudden death in dilated cardiomyopathy: the past, present, and future. Circulation 2017;136:215–31. [DOI] [PMC free article] [PubMed] [Google Scholar]
- 4.Goldberg AS, Alraies MC, Cerqueira MD, Jaber WA, Aljaroudi WA. Prognostic value of left ventricular mechanical dyssynchrony by phase analysis in patients with non-ischemic cardiomyopathy with ejection fraction 35–50% and QRS\150 ms. J Nucl Cardiol 2014;21:57–66. [DOI] [PubMed] [Google Scholar]
- 5.Wang C, Tang H, Zhu F, Jiang Z, Shi J, Zhou Y, et al. Prognostic value of left-ventricular systolic and diastolic dyssynchrony measured from gated SPECT MPI in patients with dilated cardiomyopathy. J Nucl Cardiol 2020;27:1582–91. [DOI] [PMC free article] [PubMed] [Google Scholar]
- 6.Kessler EL, Boulaksil M, van Rijen HV, Vos MA, van Veen TA. Passive ventricular remodeling in cardiac disease: focus on heterogeneity. Front Physiol 2014;5:482. [DOI] [PMC free article] [PubMed] [Google Scholar]
- 7.Chaddad A, Kucharczyk MJ, Daniel P, Sabri S, Jean-Claude BJ, Niazi T, et al. Radiomics in glioblastoma: current status and challenges facing clinical implementation. Front Oncol 2019;9:374. [DOI] [PMC free article] [PubMed] [Google Scholar]
- 8.Kim JH, Ko ES, Lim Y, Lee KS, Han BK, Ko EY, et al. Breast cancer heterogeneity: MR imaging texture analysis and survival outcomes. Radiology 2017;282:665–75. [DOI] [PubMed] [Google Scholar]
- 9.Zhao C, Xu Y, He Z, Tang J, Zhang Y, Han J, et al. Lung segmentation and automatic detection of COVID-19 using radiomic features from chest CT images. Pattern Recogn 2021;119:108071. [DOI] [PMC free article] [PubMed] [Google Scholar]
- 10.Manabe O, Ohira H, Hirata K, Hayashi S, Naya M, Tsujino I, et al. Use of (18)F-FDG PET/CT texture analysis to diagnose cardiac sarcoidosis. Eur J Nucl Med Mol Imaging 2019;46:1240–7. [DOI] [PubMed] [Google Scholar]
- 11.Tsuneta S, Oyama-Manabe N, Hirata K, Harada T, Aikawa T, Manabe O, et al. Texture analysis of delayed contrast-enhanced computed tomography to diagnose cardiac sarcoidosis. Jpn J Radiol 2021;39:442–50. [DOI] [PubMed] [Google Scholar]
- 12.Manabe O, Koyanagawa K, Hirata K, Oyama-Manabe N, Ohira H, Aikawa T, et al. Prognostic value of (18)F-FDG PET using texture analysis in cardiac sarcoidosis. JACC Cardiovasc Imaging 2020;13:1096–7. [DOI] [PubMed] [Google Scholar]
- 13.Elliott P, Andersson B, Arbustini E, Bilinska Z, Cecchi F, Charron P, et al. Classification of the cardiomyopathies: a position statement from the European Society Of Cardiology Working Group on Myocardial and Pericardial Diseases. Eur Heart J 2008;29:270–6. [DOI] [PubMed] [Google Scholar]
- 14.He Z, Li D, Cui C, Qin HY, Zhao Z, Hou X, et al. Predictive values of left ventricular mechanical dyssynchrony for CRT response in heart failure patients with different pathophysiology. J Nucl Cardiol 2021. 10.1007/s12350-021-02796-3. [DOI] [PMC free article] [PubMed] [Google Scholar]
- 15.Wang CY, Hung GU, Lo HC, Tsai SC, He Z, Zhang X, et al. Clinical impacts of scar reduction on gated myocardial perfusion SPECT after cardiac resynchronization therapy. J Nucl Cardiol 2021. 10.1007/s12350-021-02722-7. [DOI] [PMC free article] [PubMed] [Google Scholar]
- 16.Yang W, Zhang F, Tang H, Shao X, Wang J, Wang X, et al. Summed thickening score by myocardial perfusion imaging: A risk factor of left ventricular remodeling in patients with myocardial infarction. J Nucl Cardiol 2018;25:742–53. [DOI] [PMC free article] [PubMed] [Google Scholar]
- 17.Tang H, Bober RR, Zhao C, Zhang C, Zhu H, He Z, et al. 3D fusion between fluoroscopy angiograms and SPECT myocardial perfusion images to guide percutaneous coronary intervention. J Nucl Cardiol 2021. 10.1007/s12350-021-02574-1. [DOI] [PMC free article] [PubMed] [Google Scholar]
- 18.Schad L, Blüml S Zuna I. MR tissue characterization of intracranial tumors by means of texture analysis. Magn Reson Imaging 1993;11:889–96. [DOI] [PubMed] [Google Scholar]
- 19.Kotu LP, Engan K, Borhani R, Katsaggelos AK, Orn S, Woie L, et al. Cardiac magnetic resonance image-based classification of the risk of arrhythmias in post-myocardial infarction patients. Artif Intell Med 2015;64:205–15. [DOI] [PubMed] [Google Scholar]
- 20.Gibbs T, Villa ADM, Sammut E, Jeyabraba S, Carr-White G, Ismail TF, et al. Quantitative assessment of myocardial scar heterogeneity using cardiovascular magnetic resonance texture analysis to risk stratify patients post-myocardial infarction. Clin Radiol 2018;73:e17–26. [DOI] [PubMed] [Google Scholar]
- 21.Alis D, Guler A, Yergin M, Asmakutlu O. Assessment of ventricular tachyarrhythmia in patients with hypertrophic cardiomyopathy with machine learning-based texture analysis of late gadolinium enhancement cardiac MRI. Diagn Interv Imaging 2020;101:137–46. [DOI] [PubMed] [Google Scholar]
- 22.Ashrafinia S, Dalaie P, Sadaghiani MS, Schindler TH, Pomper MG, Rahmim A. Radiomics analysis of clinical myocardial perfusion stress SPECT images to identify coronary artery calcification. J Nucl Med 2021. 10.1101/2021.01.29.21250803 [DOI] [PMC free article] [PubMed] [Google Scholar]
- 23.Edalat-Javid M, Shiri I, Hajianfar G, Abdollahi H, Arabi H, Oveisi N, et al. Cardiac SPECT radiomic features repeatability and reproducibility: a multi-scanner phantom study. J Nucl Cardiol 2020;28:2730–44. [DOI] [PubMed] [Google Scholar]
- 24.Momose M, Nakajima K, Nishimura T. Prognostic significance of stress myocardial gated SPECT among Japanese patients referred for coronary angiography: a study of data from the J-ACCESS database. Eur J Nucl Med Mol Imaging 2009;36:1329–37. [DOI] [PubMed] [Google Scholar]
- 25.Slomka PJ, Nishina H, Berman DS, Akincioglu C, Abidov A, Friedman JD, et al. Automated quantification of myocardial perfusion SPECT using simplified normal limits. J Nucl Cardiol 2005;12:66–77. [DOI] [PubMed] [Google Scholar]
- 26.Uebleis C, Hellweger S, Laubender RP, Becker A, Sohn HY, Lehner S, et al. Left ventricular dyssynchrony assessed by gated SPECT phase analysis is an independent predictor of death in patients with advanced coronary artery disease and reduced left ventricular function not undergoing cardiac resynchronization therapy. Eur J Nucl Med Mol Imaging 2012;39:1561–9. [DOI] [PubMed] [Google Scholar]
- 27.Otaki Y, Betancur J, Sharir T, Hu LH, Gransar H, Liang JX, et al. 5-Year prognostic value of quantitative versus visual MPI in subtle perfusion defects: results from REFINE SPECT. JACC Cardiovasc Imaging 2020;13:774–85. [DOI] [PMC free article] [PubMed] [Google Scholar]
- 28.Berman DS, Abidov A, Kang X, Hayes SW, Friedman JD, Sciammarella MG, et al. Prognostic validation of a 17-segment score derived from a 20-segment score for myocardial perfusion SPECT interpretation. J Nucl Cardiol 2004;11:414–23. [DOI] [PubMed] [Google Scholar]
- 29.Yin JD, Song LR, Lu HC, Zheng X. Prediction of different stages of rectal cancer: texture analysis based on diffusion-weighted images and apparent diffusion coefficient maps. World J Gastroenterol 2020;26:2082–96. [DOI] [PMC free article] [PubMed] [Google Scholar]
- 30.Lucia F, Visvikis D, Desseroit MC, Miranda O, Malhaire JP, Robin P, et al. Prediction of outcome using pretreatment (18)F-FDG PET/CT and MRI radiomics in locally advanced cervical cancer treated with chemoradiotherapy. Eur J Nucl Med Mol Imaging 2018;45:768–86. [DOI] [PubMed] [Google Scholar]
- 31.Kolossvary M, Karady J, Szilveszter B, Kitslaar P, Hoffmann U, Merkely B, et al. Radiomic features are superior to conventional quantitative computed tomographic metrics to identify coronary plaques with napkin-ring sign. Circ Cardiovasc Imaging 2017. 10.1161/CIRCIMAGING.117.006843. [DOI] [PMC free article] [PubMed] [Google Scholar]
Associated Data
This section collects any data citations, data availability statements, or supplementary materials included in this article.