

Abstract
Artificial Intelligence is being employed by humans to collaboratively solve complicated tasks for search and rescue, manufacturing, etc. Efficient teamwork can be achieved by understanding user preferences and recommending different strategies for solving the particular task to humans. Prior work has focused on personalization of recommendation systems for relatively well-understood tasks in the context of e-commerce or social networks. In this paper, we seek to understand the important factors to consider while designing user-centric strategy recommendation systems for decision-making. We conducted a human-subjects experiment (n=60) for measuring the preferences of users with different personality types towards different strategy recommendation systems. We conducted our experiment across four types of strategy recommendation modalities that have been established in prior work: (1) Single strategy recommendation, (2) Multiple similar recommendations, (3) Multiple diverse recommendations, (4) All possible strategies recommendations. While these strategy recommendation schemes have been explored independently in prior work, our study is novel in that we employ all of them simultaneously and in the context of strategy recommendations, to provide us an in-depth overview of the perception of different strategy recommendation systems. We found that certain personality traits, such as conscientiousness, notably impact the preference towards a particular type of system (𝑝 < 0.01). Finally, we report an interesting relationship between usability, alignment, and perceived intelligence wherein greater perceived alignment of recommendations with one’s own preferences leads to higher perceived intelligence (𝑝 < 0.01) and higher usability (𝑝 < 0.01).
Keywords: Intelligent user interfaces, Interactive decision support systems, Design and evaluation of innovative interactive systems
1. Introduction
The increasing capabilities of AI-systems has led to their widespread use in many fields. However, for safety-critical domains, such as search and rescue (Murphy, 2004; Heintzman et al., 2021), aviation (Li et al., 2021) and healthcare (Magrabi et al., 2019), a partnership between humans and AI is preferred over complete reliance on AI-systems. To engender effective collaboration, humans need to be able to specify their intent with regards to how an AI system should perform the collaborative task, such that both human and AI-partners work towards the same goals (Gombolay et al., 2017; Tabrez et al., 2020; Nikolaidis and Shah, 2012; Johnson and Bradshaw, 2021). In military applications, strategies must be communicated and understood across a variety of team members, from politicians to commanders to soldiers (Farwell, 2020). For search and rescue applications, robot operators need to develop a shared mental model with the robot to communicate effective search strategies (Burke and Murphy, 2004). Humans may want an autonomous vehicle to exhibit or recommend different driving strategies depending on the person’s preferences or situation (Liang et al., 2023). In a human–AI collaboration, it may be helpful for the AI-system to query for a user’s intrinsic preferences and present a recommendation for an executable strategy that the human can accept, reject, or modify. We define this task of recommending appropriate strategies to a user in a mixed-initiative task as “strategy recommendation”.
However, humans may not always be able to communicate their intention as executable instructions, due to a lack of technical expertise required to structure their intent into the appropriate format. Prior work on cooperative strategy building between human and AI collaborators has provided methods to produce novel strategies, within a domain, based on prior interactions (Zhao et al., 2022; Ruan et al., 2022). Additionally, recent work has shown that when humans interact with AI/Robot systems, there is a growing expectation for personalization (Gasteiger et al., 2023; Kim et al., 2021). Strategy recommendation systems, capable of curating novel strategies, will likewise require personalization. For example, a user may perform better at a game when an AI presents a strategy that caters to the user’s play style. Additionally, strategies produced by a model need to be deemed by a user as interpretable and acceptable. Designing suitable strategy recommendation systems would enable humans who are non-experts to coordinate on the strategies for the task they are trying to collaboratively accomplish. In this work, we investigate how to design the output from strategy recommendation systems, such humans find the recommendations easy to use and that the recommendations align with the user’s goals.
To design these strategy recommendation systems, we need to consider and incorporate the functional and dispositional requirements of end-users. Prior studies on recommendation systems and human–AI collaboration elucidate the need for the user-centric design of such systems to engender effective collaboration. Users have been shown to be more resistant to utilizing generic AI systems since the AI-system would not be able to cater to the unique characteristics and demands of the users (Longoni et al., 2019). Personalizing recommendations is one such method of enabling AI systems to curate suggestions that are specific to a user (Huang et al., 2022). Personalization has already proven to be effective in increasing consumer satisfaction (Xiao et al., 2019) and business revenues (Behera et al., 2020). Previously, content personalization for Recommendation Systems based on user preferences has been done through Collaborative Filtering, Content-based Filtering, and hybrid approaches (Kumar and Thakur, 2018; He et al., 2017; Schafer et al., 2007; Lops et al., 2011).
Developing user-centric recommendation systems not only involves personalizing the content of recommendations but also how content is presented to the users. Despite these algorithmic advances in content personalization, humans have nuanced requirements that can impact their interactions with the recommendation system. Sometimes humans find it useful being recommended items relevant to their needs and preferences, such as during e-learning (Tarus et al., 2018) and for e-commerce (Linden et al., 2003). Other times, humans seemed to be more satisfied upon receiving a diverse set of options to choose from Kunaver and Požrl (2017). Personality traits also impact the inclination towards a particular structure of items within a recommendation (Nguyen et al., 2018). For instance, Nguyen et al. showed that users who are more introverted preferred diverse recommendations over similar recommendations. Also, users who were less open preferred recommendations that were more in line with their previously consumed data. However, these findings might not be consistent in the context of recommendation systems for human–AI collaboration. Therefore, it is important to study how the structure of the items in recommendation impact the perception of the strategy recommendation system.
In this paper, we propose a novel humans-subjects experiment to understand factors that would be relevant for designing effective strategy recommendation systems for human–AI partnerships in safety-critical domains. Motivated from prior work, we formulate the strategies in terms of goals and constraints required to achieve the task (Tambwekar et al., 2022). Our work seeks to study how we can best personalize the collection of strategy recommendations for humans. Unlike prior work studying personalization within recommendation systems, which studies the relevancy of content within a recommendation itself, we seek to understand how to best select the assortment of strategy recommendation(s) to suit a user’s personality and disposition. We want to determine whether the nature and structure of strategy recommendations influence a user’s perception of the system. For our study, we develop a validated metric for converting a user’s gameplay preferences into actionable strategies. We employ this metric to present recommendations to a user based on their preferences. In our experiment, we study four baselines motivated from prior work (Tan et al., 2008; Szpektor et al., 2013; Bollen et al., 2010) but through a between-subjects design and in the context of strategy recommendation systems; (1) Single strategy recommendation which most closely align with a user’s preferences, (2) Multiple recommendations which are similar to a user’s preferences, (3) Multiple recommendations which include strategies both similarly and oppositely aligned with their preferences, (4) All possible strategies. We study how personality type and predisposition towards preferring certain types of recommendations affects a user’s alignment, preference, and perceived intelligence of any given strategy recommendation type. A schematic overview of our entire approach can be visualized in Fig. 1. Our overall contributions are as follows:
Fig. 1.
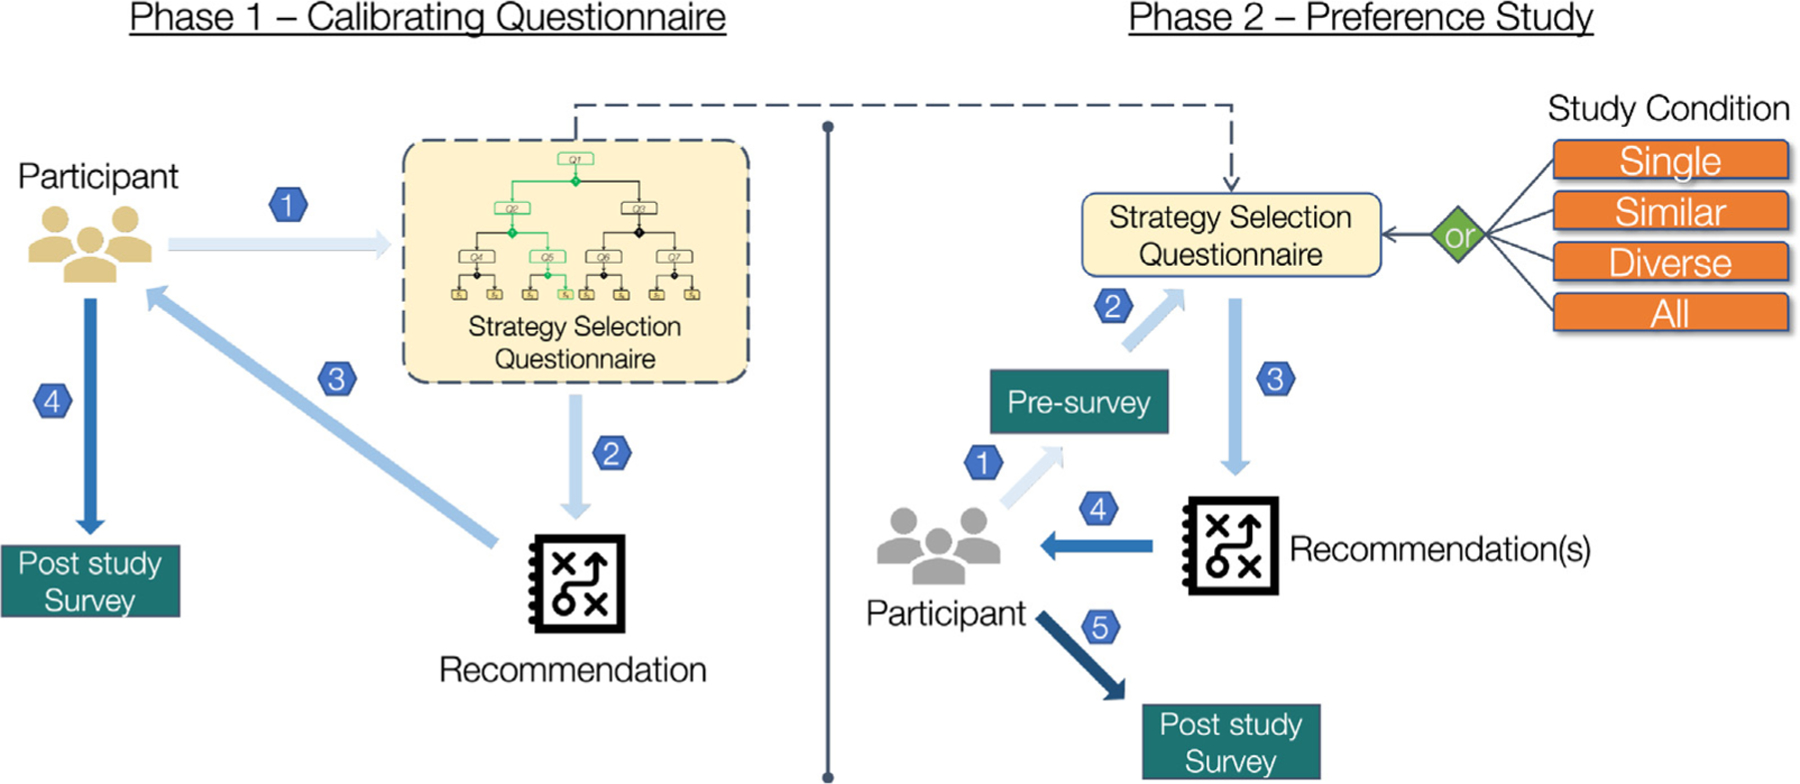
This diagram provides a schematic overview of the entire study. We employ a two-phase study design. The goal of phase one of our study is to validate our proposed strategy recommendation methodology. In Phase 1, participants complete the strategy recommendation questionnaire (1.1), receive a recommendation (1.2), and complete a post-study alignment survey to ascertain how aligned the recommendation was to their original preferences (1.3). Using the data from Phase 1, we validate that our questionnaire can adequately be used to recommend relevant strategies. We now utilize this questionnaire in Phase 2 of the study in which our goal is to study strategy recommendation systems. After completing a pre-survey (2.1), participants answer the validated questionnaire from Phase 1 (2.2), and are recommended a strategy in one of four formats based on the study condition (2.3). Participants receive and analyze the recommendation(s) and are then asked to complete a few post-study surveys to evaluate their experience.
We design a novel user study to understand user-preferences with respect to strategy recommendations for challenging tasks.
We develop and validate a metric to convert a user’s preferred gameplay style into an actionable strategy using just three questions (𝑝 < 0.05).
We evaluate the user preference in the form of usability and perceived intelligence of the system, workload for the task, and the alignment of the recommendations with user’s strategy (𝑝 < 0.01).
We study how perceived alignment of the recommendation list impacts the general perception of a recommendation type. We found that perceived alignment of the recommendation(s) with user preference significantly impacts usability (𝑝 < 0.01) and perceived intelligence (𝑝 < 0.01) of the system.
Our first-of-its-kind human-subjects experiment provides a deeper understanding of factors that impact human preferences while interacting with a strategy recommendation system for decision making. These insights provide a foundation for designing strategy recommendation systems that can adapt to user preferences.
2. Related work
In this section we will first cover the existing methods for personalization within a Recommendation System. We will then discuss different works studying the impact of the presentation of items within a recommendation systems on users and perception of recommendation systems.
2.1. Recommendation system and personalization
Recommendation Systems can be personalized or unpersonalized based on the task requirement. Personalization in recommendation has been mostly achieved through Collaborative Filtering (Sarwar et al., 2001; Kluver et al., 2018) and Content-based Filtering (Van Meteren and Van Someren, 2000; Vanetti et al., 2010). Collaborative Filtering finds another user with similar preferences and performs recommendations based on the neighboring user’s preferences while Content-based Filtering performs recommendations based on past preferences of the user (Koren et al., 2022). Collaborative Filtering can be done through the neighborhood approach or latent factor models. Neighborhood approaches work by either finding similar users or similar items whereas latent factor models try to find similar characteristics by factorizing users and items in the same embedding space. Content-based Filtering involves either discovering new data sources like linked open data, user generated content or new algorithmic approaches like meta-path based approaches, encoding metadata and deep learning (Lops et al., 2019). Explicit item rating, adaptive dialogs and forms, and comparison based techniques have been used to elicit user preferences. Interactive techniques like visualization, explanations, and user feedback can further help in shaping the recommendation interface based on user preference (Jugovac and Jannach, 2017). The personalization in Recommendation Systems can be done through User Interfaces, Content or the Interaction Process (Zanker et al., 2019). Rather than studying the algorithmic accuracy of the content presented to a user, in our study we seek to understand how the user interface can be personalized for strategy recommendation systems.
2.2. Presentation of items within recommendations
Recommendation systems generally present options which are similar to user preferences (Tan et al., 2008; Chen and Yin, 2006; Linden et al., 2003) but in some cases it can be beneficial to have options which are dissimilar to user preferences. “Freshness and Diversity” in recommendations has proven to be helpful in improving the performance of the personalized question recommendation system (Szpektor et al., 2013). A recent study on music recommendation systems also pointed towards the need for algorithms that are diversity aware, in other words, algorithms that are able to recommend relevant as well as diverse music options to users (Anderson et al., 2020).
Prior work has also found that the lack of transparency and unpredictability in algorithms can sometimes lead to users feeling helpless while working with automated systems (Jhaver et al., 2018), while expertise of the system was proven to be helpful towards a human’s appreciation of the system (Hou and Jung, 2021). Thus, showing all kinds of strategies might help users understand the recommendation system better and in turn reduce their anxiety while using the system. Conversely, it could further lead to “choice overload” (Bollen et al., 2010). Choice overload happens when the recommendation system provides a large set of good options for users to choose from. It has been shown as the number of options increases the satisfaction of the users increases marginally and then starts to decrease (Reutskaja and Hogarth, 2009).
In our study, we consider these phenomena in designing four types of recommendations to present to users, i.e. single aligned recommendation, similar aligned recommendations, three diverse recommendations comprised of both similarly and oppositely aligned strategies, and all possible recommendations. However, unlike prior work, we compared all the types of recommendation systems simultaneously and in the context of strategy recommendations. This lets us compare and contrast different strategy recommendation systems and their perception across users. We also analyzed the correlation between personality traits of the user and preference towards a particular recommendation system. We hope to study whether prior findings on diversity, anxiety, and choice overload are reflected in user-interactions with strategy recommendations.
2.3. Human recommender interaction
The Human-Recommender Interaction is made up of three pillars which dictate the usefulness of the interaction: Recommendation Dialog, Recommendation Personality, and The user’s information-seeking task (McNee et al., 2006). Each of these facets are defines as follows:
Recommendation dialog pertains to how the user interfaces with the recommendation system to receive recommendations.
Recommendation personality represents the user’s perception of the personality of the recommendation system. The system’s ability to personalize and adapt, or obtain, trust all cater to this facet.
The last category (The user’s information-seeking task) pertains to the specific task that the user is attempting to accomplish with the help of the explanation.
Evaluative work in Human-Recommender Interaction has sought to study the perception of recommendation systems with regards to various factors in each of these categories. Prior work has shown that techniques such as personalization (Tam and Ho, 2003), presentation (Shinozawa et al., 2005), and diversification (Willemsen et al., 2016; Ziegler et al., 2005) of the recommendation or interface used to provide the recommendation all significantly improve a user’s interaction via improved satisfaction or perceived usefulness or adoption. Our work aims to build on this analysis to study the impact of presenting different variations of personalized strategy recommendations on user perception of the recommender system.
Various guidelines have also been established to conduct user studies to study, the perception of and interaction with, these systems that help researchers in determining the system aspects to be studied, dependent variables to be used, etc. Knijnenburg and Willemsen (2015). Human-subjects experiments serve as an important method to evaluate the efficacy of a recommendation systems (Shani and Gunawardana, 2011). We can test new systems by recommending items generated by the systems to humans and checking if the humans perceive them better than recommending them random items or items from a different algorithm. We seek to leverage the insights from these prior experiments, to design our human-subjects experiment and analyze the perception and usability of strategy recommendation systems. In our work, we perform a first-of-its-kind human-subjects experiment to evaluate and understand a user-centric strategy recommendation system.
3. Experimental design
We designed a novel human-subjects study to understand user-preferences with respect to recommendations of game-play strategies. Through our study, we seek to understand what factors influence how humans like to be provided strategy recommendations, such as their predisposed proclivity towards a specific type of recommendation or their personality. Ours is the first experiment to study user perceptions of recommendation systems outside of well-defined tasks such as e-commerce or social media recommendations. We seek to provide design insights for recommendation systems built for human–AI collaboration, in order to enable AI-systems to suggest strategy recommendations which are more suitable to individual human-collaborators.
Our strategy recommendations are defined in terms of goals and constraints. Goals are defined as the set of desirable states that you want to achieve and constraints are the conditions imposed while obtaining those states (see Fig. 3 for an example strategy). We chose this scaffolding of goals and constraints because goals and constraints provide an effective middle ground between human-communication channels, such as language, to black-box optimization paradigms used by black box AI-systems to execute their behavior. Goals and constraints thereby provide a human-understandable abstraction (Giunchiglia and Walsh, 1992) by which a user can program an AI-agents behavior without any underlying technical knowledge as they can be easily plugged into both learning and planning-based methods to specify an agent’s task. For a strategy, each of the six goals has a value between unfavorable, neutral, and favorable which dictates the importance of the goal towards the overall strategy. Constraints are represented as individual statements, such as “I need 4 troops to effectively defend a country”, or “I must protect the borders of Asgard”.
Fig. 3.
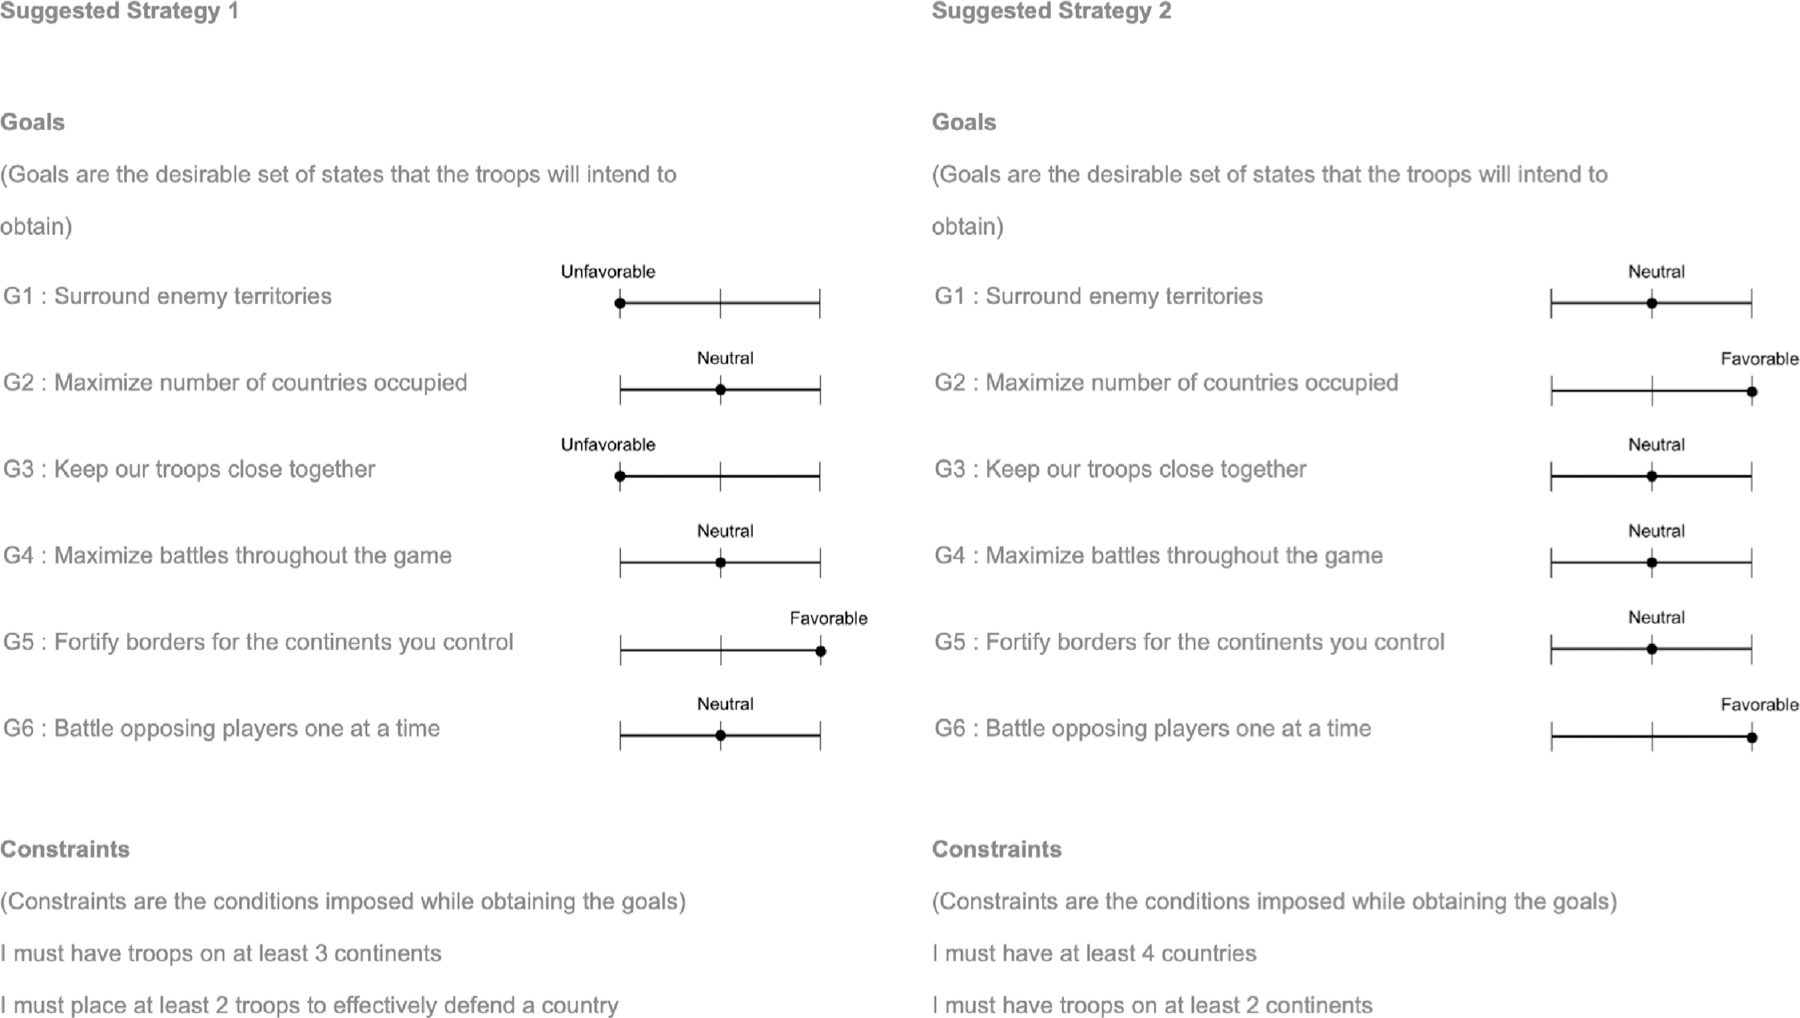
This figure depicts how the aligned and reverse strategies were presented to participants during the calibration study. The first half of participants were shown the aligned strategy as “Strategy 1” and the second half of participants were shown the reverse strategy as “Strategy 1”.
3.1. Environment
We utilized the board game Risk, for our experiment. Risk was an ideal environment for this study, due to the various contrasting strategies that can be employed towards winning a game of Risk. This environment is also complex enough to necessitate a strategy recommendation system, as without any recommendations the player would need to play several rounds of the game in order to curate their own strategy. Playing Risk involves completing various resource allocation, scheduling, and planning tasks which are key parts of many real-world tasks. Furthermore, Risk is a stochastic environment, which is congruent with real-world scenarios, like financial trading, disaster response, search and rescue, robot manipulation, etc. Unlike other scheduling or resource-allocation games, such as Starcraft or Age of Empires, humans can more intuitively develop and interpret strategies for Risk. Risk has a significantly simpler rule-set which enables humans to develop and understand strategies without large amounts of domain expertise. These properties make Risk a suitable environment to understand potential trends for recommending AI-strategies for real-world tasks.
The version of Risk we employ is a turn-based game with three players that is comprised of four primary stages:
Draft: Pick your initial set of territories on the game board and deploy your initially allocated troops.
Reinforce: Deploy additional troops to your existing territories.
Attack: Conduct battles between territories you control with opposing territories.
Maneuver: Move troops between two territories you control.
The draft stage is conducted only once per player at the start of the game. After the initial drafting stage of all players, each player’s turn is comprised of sequentially completing the Reinforce, Attack, and Maneuver stages. A player wins when they have conquered all territories on the map. For our experiment, we adapt a Risk gameplay simulator from prior work (Tambwekar et al., 2022). We created gameplay agents within this simulator that could follow the strategies we developed for this study as a means of providing participants with a practical execution of the recommended strategy in Risk. Our Risk simulator is shown in Fig. 2.
Fig. 2.

This figure shows the Risk Simulator used for our study. Simulation for the recommended strategy was executed by the orange player (Agent) which was playing against teal (Bravo) and pink (Charlie) players. We also included a legend so that participants could track the forces and territories of all players. Each action is annotated with a text-description in the text box at the bottom of the screen.
3.2. Research questions
Through our experiment, we sought to answer the following research questions:
RQ1 - How can we automatically calibrate an actionable strategy which aligns with a participant’s gameplay preferences?
Within recommendation systems, personalization is typically employed to improve the user’s experience by modulating the content of a recommendation to provide recommendations that are more aligned with a user’s preferences (Khatwani and Chandak, 2016). Through RQ1, our goal is to show that our proposed method can present a recommended strategy that aligns with the user’s gameplay preferences.
RQ2 - Does our study condition, i.e. the type of strategy being recommended to users, have an impact on the dependent variables for the recommendation system?
In prior work, it has been shown that “diversity”, i.e., the variety present in a list of recommendations, and “serendipity”, i.e., the unusualness or surprise within recommendations, are increasingly important for user-satisfaction and -experience (Zhang et al., 2012; Kaminskas and Bridge, 2016). Through RQ2, we aim to answer whether this trend is reflected for the task of automated strategy recommendations.
RQ3 - How do personality factors and demographic information influence the dependent variables in this study?
Prior work has shown that in addition to domain-specific preferences, a user’s disposition or personality also significantly impact their preferences with regards to the structure and format of the recommendation (Nguyen et al., 2018; Chen et al., 2013; Tran et al., 2021; Khwaja et al., 2019). Therefore, as we study recommendations for a novel task, i.e. strategy recommendation for autonomous systems, through RQ3 we seek to understand the impact of these intrinsic factors on our recommendation system.
RQ4 - How does a user’s perception of the alignment of the system’s recommendations with their own preferences affect the other dependent variables?
Finally, to build on the analysis in RQ2-3, with RQ4 we study the impact of a user’s perception of alignment. Recent work has highlighted that a perceived misalignment between the recommendation system with the user’s goals and preferences can lead to “algorithmic hate”, which can have significant downstream effects (Smith et al., 2022). Therefore we study the impact on alignment in this case-study to understand whether the user’s perception of alignment can impact a user’s amenability towards specific types of recommendation systems or the perception of the system.
Our experiment is divided into two separate phases. In Phase 1, we validate our mechanism to recommend a strategy aligned with a participant’s preferences (RQ1). In Phase 2, we study the perception of varying mechanisms of recommending strategies, and identify the factors that impact these perceptions with a different set of participants (RQ2-4).
4. Calibrating preference questionnaire - phase 1
The first step in our experiment is to identify a mechanism to encode a participant’s innate gameplay preferences into an aligned actionable strategy (RQ1).
We developed a questionnaire, wherein the participant answered three questions regarding what action they would take in a fictional scenario in Risk. For each of these questions, the participant is asked to select an action within informative fictional scenarios in Risk which seeks to inform us of their values and preferences as a Risk player. Our questionnaire is structured as a binary decision tree, of depth three, such that every question has two options, each of which would lead the participant to a different side of the decision tree depending on the participant’s selection (see Fig. 4). A participant is assigned a strategy based on their answers to three questions. Our questions are intentionally designed to reveal salient details of a participant’s gameplay preferences, such as “Are they an aggressive player?”, “Do they like to keep their troops close together?”, “Do they prefer to maximize battles or countries controlled?”, etc. These questions all measure non-overlapping properties regarding their choices which allow us to categorize participants into an appropriate strategy. We have included each of the seven questions in our tree, as well as the structure of the tree itself within the Appendix (Appendix B.1).
Fig. 4.

A depiction of how we recommend strategies based on the study condition assigned to the participant. In this illustration, based on the participant’s answers to each question, their ideal strategy is 𝑆4, as shown by the path highlighted in green. For the “single” condition, we will recommend only 𝑆4. For the “similar” condition, the participant is recommended 3 strategies, i.e. the sibling strategy, 𝑆3, and one of its “cousin” strategies, 𝑆2. In the “diverse” condition, the participant is also recommended 3 strategies, however instead of the sibling strategy, the participant is recommended a strategy on the other side of the tree, i.e. 𝑆8. Finally, with respect to the “all” condition, participants are shown all eight strategies. The full calibration questionnaire can be found in Appendix B.1.
Through their answers to the three questions presented, we ascertain which out of eight (i.e., 23 = 8 options) total strategies best aligns with how a participant would play Risk. These eight strategies, as well as the questions in the decision tree, were hand designed by multiple collaborators knowledgeable in Risk gameplay, to represent a diverse set of gameplay choices within Risk, from highly aggressive to highly defensive strategies. The full list of strategies has been provided in the appendix (Appendix Fig. D.11). Since this was a novel questionnaire that we designed, we first need to validate that this questionnaire recommends strategies which adequately represent the participant’s preferences. Therefore, Phase 1 of our study is a calibration phase wherein participants worked with our questionnaire to receive strategies, and we measured how aligned these recommended strategies were to the participant’s preferences. To measure the effectiveness of our strategy recommendation questionnaire, we utilize an alignment survey comprised of four questions (shown in Table 1). This survey is a 7-point, 4-item Likert scale from Strongly Disagree to Strongly Agree. The remainder of this section on Phase 1 will cover the analysis of pilot studies (Section: 4.1) which informed the final structure of the validation study as well as the final procedure (Section 4.2) employed to validate our questionnaire. We conclude with a discussion of the results from our analysis (Section 4.3) showing the validity of our proposed approach to recommending strategies.
Table 1.
This table depicts the Likert statements employed in our alignment questionnaire. Each statement has a response format with seven items, ranging from strongly disagree to strongly agree.
| Likert Scale | |
|---|---|
| 1 | The suggestions made to me were aligned with my strategy |
| 2 | The suggestions failed to capture my strategy |
| 3 | The suggestions paid attention to my strategy |
| 4 | The suggestions ignored my preferred strategy |
4.1. Pilot studies
We iterated over our study design for the calibration phase several times during the piloting phase to identify and fill the gaps in our study. In the first iteration, we only displayed the strategy produced by our decision tree (aligned strategy (AS)) to the participants and asked them to fill out the alignment questionnaire (see Table 1). Though we found positive results (n = 12, mean = 5.4375, SD = 1.28), we wanted to confirm that participants were not giving high alignment scores to the recommended strategy due to confirmation bias. Thus, in the second iteration, we incorporated the concept of “reverse strategy”. A reverse strategy was defined as a strategy having different ratings for at least 5 out of the 6 goals from the aligned strategy. The participants were first recommended either the aligned or the reverse strategy and asked to fill the alignment questionnaire for that particular strategy. The same process was then repeated for the remaining strategy. The results confirmed the confirmation bias and the participants ended up giving high alignment scores to both the strategies (n=3, AS: mean = 6.33, SD = 0.62, RS: mean = 5.42, SD = 1.19). We also suspected this might be because participants were not able to compare the two strategies. Therefore, in the next phase we displayed both the strategies side by side (Fig. 3). Participants were now able to compare and contrast the two strategies. People who preferred the reverse strategy were not able to coherently explain their choices (n = 5, AS: mean = 4.45, SD = 1.94, RS: mean = 5.5, SD = 1.20). So, in the final phase of the study we asked the participants to explain their strategy behind their choices in the preference questionnaire before displaying the recommended strategies to them. Also, we recruited participants who already had some experience with playing strategy games like RISK, CATAN, etc. so they could validate our preference question better. If the participants still preferred the reverse strategy over the aligned strategy we asked them some semi-structured interview questions (Appendix C).
4.2. Validating calibration questionnaire
The goal of Phase 1 is to ensure that our strategy recommendation questionnaire accurately captures the gameplay preferences of a participant. We used the learnings from the pilots to design the study for validating the calibration questionnaire. The study begins with a tutorial for the rules of Risk to familiarize participants with the rules of the environment, and the simplifications we made to the game. Next, participants were allowed to play a Risk simulator to familiarize them with how the gameplay works. Next, participants are walked through each stage of the game within the simulator, and then participants are allowed to play the game until they are confident in their understanding of the game. The participants were encouraged to play at least one round of the game. Upon completion of the tutorial phase, participants answer our strategy recommendation questionnaire to receive a strategy recommendation for their preferred gameplay style. We present each participant with two options based on the answers to the questionnaire; (1) The “aligned” strategy, which corresponds to the strategy that best aligns with their answers to the questionnaire, (2) The “reverse” strategy which oppositely aligns with their answers to the questionnaire, i.e. is on the opposite side of the decision tree. Both strategies are presented side-by-side to participants. Participants alternatively received the aligned strategy as Suggested Strategy 1 or Suggested Strategy 2 to remove any bias (see Fig. 3). We then showed the participant a simulation of an AI Risk player which employs the given strategy and asked them to answer the alignment questionnaire to gauge how well a recommended strategy aligned with their preferences. Finally, the participants were asked subjective questions regarding what they liked and disliked about the suggested strategy. This process was conducted sequentially for both strategies, i.e. simulation, alignment, subjective for strategy 1, then simulation, alignment subjective for strategy 2.
4.3. Results
In this section, we share the statistical results from our calibration study to validate RQ1. We conducted our Calibration Study with 16 participants and had to discard data for one participant (see Appendix D). Each participant received both strategies side-by-side as shown in Fig. 3. We randomized the ordering of these strategies such that out of the 15 total participants 8 of them saw the aligned strategy as Strategy 1 (left side in Fig. 3) while 7 participants saw the reverse strategy as Strategy 1. The purpose of this split was to account for any potential ordering effect with regards to whether the participant saw the “aligned” strategy first or second. After interviewing the participants that gave a higher rating to the reverse strategy, we observed that those participants sometimes chose options in the calibration questionnaire that were not reflective of their general strategy. For example, a participant kept choosing defensive options in the calibration questionnaire but, when asked to describe their general strategy towards the game, the participants preferred a more aggressive strategy. Consequently, to make the participants more conscious of their choices, before presenting the strategy recommendations, we asked the participants to go over each of their choices and explain the reasoning behind choosing a particular option. Thereafter, on an average the participants rated the alignment for the aligned strategy (Mean = 5.18, SD = 1.28) higher than the reverse strategy (Mean = 3.93, SD = 1.78). The data failed the Shapiro–Wilk Test for normality; thus, we used the Wilcoxon signed-rank test. A Wilcoxon signed-rank test confirmed that this difference was statistically significant with 𝑍 = −3.22 and 𝑝 < 0.05. The Cronbach’s alpha for the alignment questionnaire was 𝛼 = 0.94. The statistical significance of the Wilcoxon signed-rank test confirms that the strategies recommended by our questionnaire are accurately aligned with a participant’s preferences. This result validates our assumption that this questionnaire encodes preferences into actionable Risk strategies for Phase 2 of our experiment.
5. Strategy recommendation preference study - phase 2
In Phase 1, we validated our strategy recommendation questionnaire. Phase 2 of our study focused on answering the remaining research questions, i.e. RQ2-4. This section will cover the study conditions (Section 5.1), metrics (Section 5.2), and procedure (Section 5.3) and conclude with a description of the statistical results of our experiment (Section 5.4).
5.1. Study conditions
We conducted our second study as an in-person experiment, with a 1 × 4 between-subjects design wherein the study condition is the method of recommending a strategy to a user. We first calibrate a participant’s gameplay preferences through the preference questionnaire from Section 4. After calibrating a participant’s gameplay preferences through the questionnaire from Section 4, in each condition of the study we provide one of the following four recommendations:
Single - Participants are recommended a single strategy that best aligns with their preferences regarding how they would play Risk.
Similar - Participants are recommended three strategies that are all similar and aligned with their gameplay preferences.
Diverse - Participants are recommended three strategies which include strategies which are similar and opposing to their gameplay preferences.
All - Participants are recommended all eight possible strategies for playing Risk. In our study we have eight total strategies.
The method for deriving the set of strategy recommendations for each condition, from our preference questionnaire, is depicted in Fig. 4.
5.2. Metrics
We employed various pre- and post-survey metrics to assist with our analysis. Firstly, we measured a user’s personality type through a ‘Mini-IPIP’(International Personality Item Pool) questionnaire (Donnellan et al., 2006), which was administered as a pre-study survey. The mini-IPIP scale is comprised of 5-factors which are the big-5 personality traits, i.e. Agreeableness, Conscientiousness, Openness, Neuroticism, Extraversion. The purpose of this survey was to assist in answering RQ2, i.e. do personality factors have an impact on a user’s perception of our strategy recommendation system.
Next, we employ various post-survey metrics to analyze the various facets of a user’s perception of, and interaction with, our strategy recommendation system. There are five metrics we seek to study in our experiment, which are (1) Perceived Intelligence, (2) Workload, (3) Usability, (4) Alignment, (5) General Perception of Recommendation Style. For Alignment, we utilize the same survey that we utilized in Phase 1, i.e. ( Table 1). For Perceived Intelligence, Workload and Usability, we employ validated surveys from prior work, i.e. Godspeed questionnaire (Bartneck et al., 2009), NASA Task Load Index (TLX) (Hart and Staveland, 1988), System Usability Survey (SUS) (Brooke et al., 1996) respectively. Finally, we design a novel survey on general preference of recommendation types (see Section 4). This survey seeks to understand a participants general preferences and opinions of each type of recommendation, i.e. single, similar, diverse, all. Each category had four associated questions, with a total of 16 Likert items. This survey was evaluated on a 7-point Likert response format from Strongly Disagree to Strongly Agree. This survey is administered to gauge whether after going through the strategy recommendation process, they have a strong opinion regarding how they would like to receive recommendations. Note that this questionnaire was asked at the end of the study to eliminate any bias that may stem from knowing about the other possible types of recommendations. After the study, we also collected more demographic information from the participants including their age, gender and expertise in playing strategy games.
5.3. Procedure
We started the study in a similar manner as the calibration study where we provided the participants with a tutorial of RISK and the RISK simulator to explore and play the game.
After completing the tutorial and pre-survey segments (mini-IPIP), participants were allowed to begin the study. The study started with participants filling out the calibrated preference questionnaire, described in Section 4, to curate their ideal strategy. Before providing our strategy recommendations, participants are asked to explain verbally their reasoning for their choice in each scenario. This serves as a mechanism for participants to re-calibrate their holistic strategy based on their choices, and serves as a mechanism to filter out participants who made a mistake or no longer agree with their original choices. Next, we present the one, three, or eight strategy recommendations to the participant based the study condition they have been assigned. Fig. 4 provides an illustration of how strategies are recommended based on the participant’s answers to each question in the strategy questionnaire. The strategies are presented in order of relevance, i.e. most related to their gameplay preferences to least related to their preferences, but participants were not informed of the ordering. In addition to the goals and constraints within each strategy, we also provided an image how a player following the given strategy would have drafted troops in the drafting stage (Appendix Fig. D.11).
Finally, for each recommended strategy, the participant had the option of viewing a simulation of the first two turns of gameplay with an agent that utilizes the strategy. The simulation helped the participants visualize the particular strategy if they had difficulty in parsing goals and constraints of the strategy. Each turn includes actions in all three stages, which provides multiple indicators of the agents strategy. For example, based on the agent’s “attack” choices, the participant could discern how aggressive the agent’s strategy is, or depending on where the agent chooses to “recruit” troops, the participant can learn what parts of the map the player is prioritizing. We restricted our simulation to two turns as we did not want the participant to be biased by whether the gameplay agent wins. Our aim was to encourage participants to evaluate their recommendations based on their alignment towards how the participant would play the game rather than how successful a strategy is. If participants see a strategy fail, which is possible due to the stochastic nature of Risk, they may be less likely to admit that the strategy aligned with how they would play the game. Furthermore, upon seeing the agent go through all three stages twice, the participant should get an adequate idea regarding how the agent intends to play the game. We found two turns to be an adequate compromise to mitigate the cognitive load taken on by the participants in viewing the gameplay for each recommendation. Allowing participants to view the whole game would have been too intensive for participants, especially in the conditions wherein they have to compare multiple or all strategies.
After participants confirm that they have understood each of the recommended strategies, the participant is asked to answer the post-experiment questionnaires relating to Alignment, Usability, Workload, Perceived Intelligence and General Preference as per Section 5.2. In addition to the questionnaires, participants were also asked two subjective questions to obtain qualitative insights regarding participants’ opinions and experience with respect to each type of recommendation: (1) What did you like about the Recommendation Interface? and (2) What did you dislike about the Recommendation Interface? These questions were asked before our novel preference questionnaire to eliminate any bias which may stem from knowing about the other possible conditions.
5.4. Results
In this section, we report the statistical tests conducted in both the calibration study and the main study to answer the research questions setup in this paper. We ran our experiment with a total of 60 participants. Note that the pool of participants was different from that of Phase 1, i.e. we recruited new participants to work with our calibrated strategy recommendation system from Phase 1. The participants for the study were recruited through posters, college mailing lists, and social media platforms. As a post-hoc survey, we collected additional demographic information from the participants. Out of the 58 participants that reported, 21 were female, 36 were male and 1 was Non-Binary. The average age of participants was 23.5 (min - 18, max - 31, s.d. - 2.95) and the average expertise in playing strategy games on a scale of 1–5 was 3.08 (s.d. - 0.98). Detailed information about demographic personality traits is included in Appendix A. The estimated time for our study was 45 min and participants were paid $15 to participate in our study. We discuss the statistical tests conducted to study each research question and analyze our findings with respect to user-preferences for strategy recommendations.
To answer our research questions regarding user preferences of strategy recommendations (RQ2 – 4), we performed a multivariate regression analysis for each dependent variable. For all linear regression models, we tested for the assumptions of normality of residuals and homoscedasticity. We performed Levene’s test to measure homoscedasticity, and all models were found to be homoscedastic. The summary of all the models and assumption tests can be found in Appendix A. We performed Shapiro–Wilk’s test to test for normality of the residuals of each model, however we found that some models had residuals that were not normally distributed. In prior work, it has been shown that an F-test is robust to non-normality (Cochran, 1947; Blanca Mena et al., 2017; Hack, 1958; Glass et al., 1972). Therefore, we choose to proceed with a linear regression analysis.
Our analysis started with separate multivariate linear regression model for each dependent variable containing all the independent variables and covariates defined in Table 2. To find the appropriate model for each measure, we applied AICc (small-sample corrected Akaike Information Criteria) (Akpa and Unuabonah, 2011) as our Occam’s razor. Owing to our comparatively small sample size (n=60), we used AICc which adds a correction term to the standard AIC (Hu, 2007) to avoid overfitting. Our final models include only the independent variables and covariates that yield the lowest AICc score. We employed the AICc score because it helps to mitigate over- and under-fitting the model. Details of the final models for all the dependent variables are mentioned in Tables 3 and D.4. We performed a one-way ANOVA (Analysis of Variance) to measure significance of each measure on the dependent variables. We further conducted a TukeyHSD post-hoc test to identify pairwise significance between values for independent variables which were structured as factors.
Table 2.
This table details the dependent and independent variables in our study. We have modeled some variables and both dependent and independent variables.
| IV | Covariate | Covariate/DV | DV |
|---|---|---|---|
| Strategy | Expertise | Pref. Single | Perceived Intelligence |
| condition | Age | Pref. Similar | Usability |
| Gender | Pref. Diverse | Workload | |
| Conscientiousness | Pref. All | ||
| Agreeableness | Alignment | ||
| Extraversion | |||
| Openness | |||
| Neuroticism |
Table 3.
This table details the final dependent variable and independent variables/covariates for each model. Initially every model contained all the covariates (see Table 2) and was simplified to minimize AICc scores.
| DV | IV/Covariates | Significant covariates |
|---|---|---|
| Usability | Study Condition, Conscientiousness, Openness, Alignment, Pref. Single | Study Condition (RQ2), Conscientiousness (RQ3), Alignment (RQ4) |
| Alignment | Pref. Diverse | Pref. Diverse |
| Pref. Single | Conscientiousness, Age | Age (RQ3) |
| Pref. Similar | Pref. Diverse | Pref. Diverse |
| Pref. Diverse | Pref. Similar, Alignment | Pref. Similar, Alignment (RQ4) |
| Pref. All | Agreeableness, Conscientiousness | N/A |
| Workload | Agreeableness, Conscientiousness, Pref. Single, Age | Agreeableness (RQ3) |
| Perceived Intelligence | Alignment | Alignment (RQ4) |
Table 3 summarizes the results and details all of the significant variables in each model. Since some models are relevant across multiple research questions, Table 3 also highlights which significant variables pertain to each research question. In the following sections, we discuss the results and significant variables relevant to RQ2–RQ4 (see Fig. 6).
Fig. 6.

Summary of all the significant results in our study. The asterisks denote the level of significance, i.e. ***: 𝑝 < 0.001, **: 𝑝 < 0.01, *: 𝑝 < 0.05.
5.4.1. RQ2
We first sought to measure the effect of the study condition, i.e. the method of recommending strategies to participants, on the usability, perceived intelligence, and workload. An ANOVA on our linear regression model for usability yielded a significant difference in usability across the recommendation types (F(3, 56) = 4.161, 𝑝 < 0.05). A Tukey post-hoc test showed that the single strategy recommendation was perceived to be significantly more usable than similar strategy recommendations (𝑝 < 0.01) (see Fig. 5). The single strategy was rated higher than the other two conditions as well (diverse, all), however the pairwise difference was not found to be significant. The method of recommending strategies was not found to be significant with respect to perceived intelligence or workload.
Fig. 5.

Two bar graphs which show the performance of each study condition based on (a) usability and (b) alignment.
5.4.2. RQ3
Next, we sought to understand how intrinsic personality types affected preference towards any given strategy. Firstly, conscientiousness significantly impacted the usability of strategy recommendation systems in general. Participants who had higher degrees conscientiousness (F(1,58) = 9.654, 𝑝 < 0.01) tended to significantly perceive the recommendation system as more usable. A participant who likes to be more prepared and are attentive to smaller details may find it more usable to be recommended strategies for solving a complicated task because they are willing to spend the time to comprehensively assess their options. Workload was significantly higher for participants who had higher traits of agreeableness (F(1, 58) = 4.390, 𝑝 < 0.05). This is a logical finding, as agreeable participants would be more likely to simulate every single strategy to best understand each recommendation, thereby incurring a higher workload. Additionally, we found that age is positively correlated to preference towards single strategy recommendation systems (F(1, 58) = 14.645, 𝑝 < 0.01). This could imply that older people are confident in their strategies and do not want to waste their time analyzing other options. A graphic providing a breakdown for the personality types of participants in our study is provided in the appendix (see Fig. A.9).
5.4.3. RQ4
Next, we report some findings pertaining to the perceived alignment of recommendations with respect to their innate preferences(see Fig. 7). Alignment was found to significantly increase usability (F(1, 58) = 8.677, 𝑝 < 0.01). From Section 5.4.1, we know that the single strategy condition was perceived as the most usable. This finding is in line with prior work in personalization (Tan et al., 2008; Chen and Yin, 2006; Linden et al., 2003) which suggests that the people generally like their preferences being reflected in the recommended options. Alignment also significantly impacted perceived intelligence (F(1,58) = 9.331, 𝑝 < 0.01). We found that participants who felt that the recommendations provided were more aligned with their inherent preferences, perceived the system are more intelligent. It is logical that participants who felt that the system was able to accurately understand and encode their gameplay preferences into the recommendation ascribed more intelligence to the system.
Fig. 7.
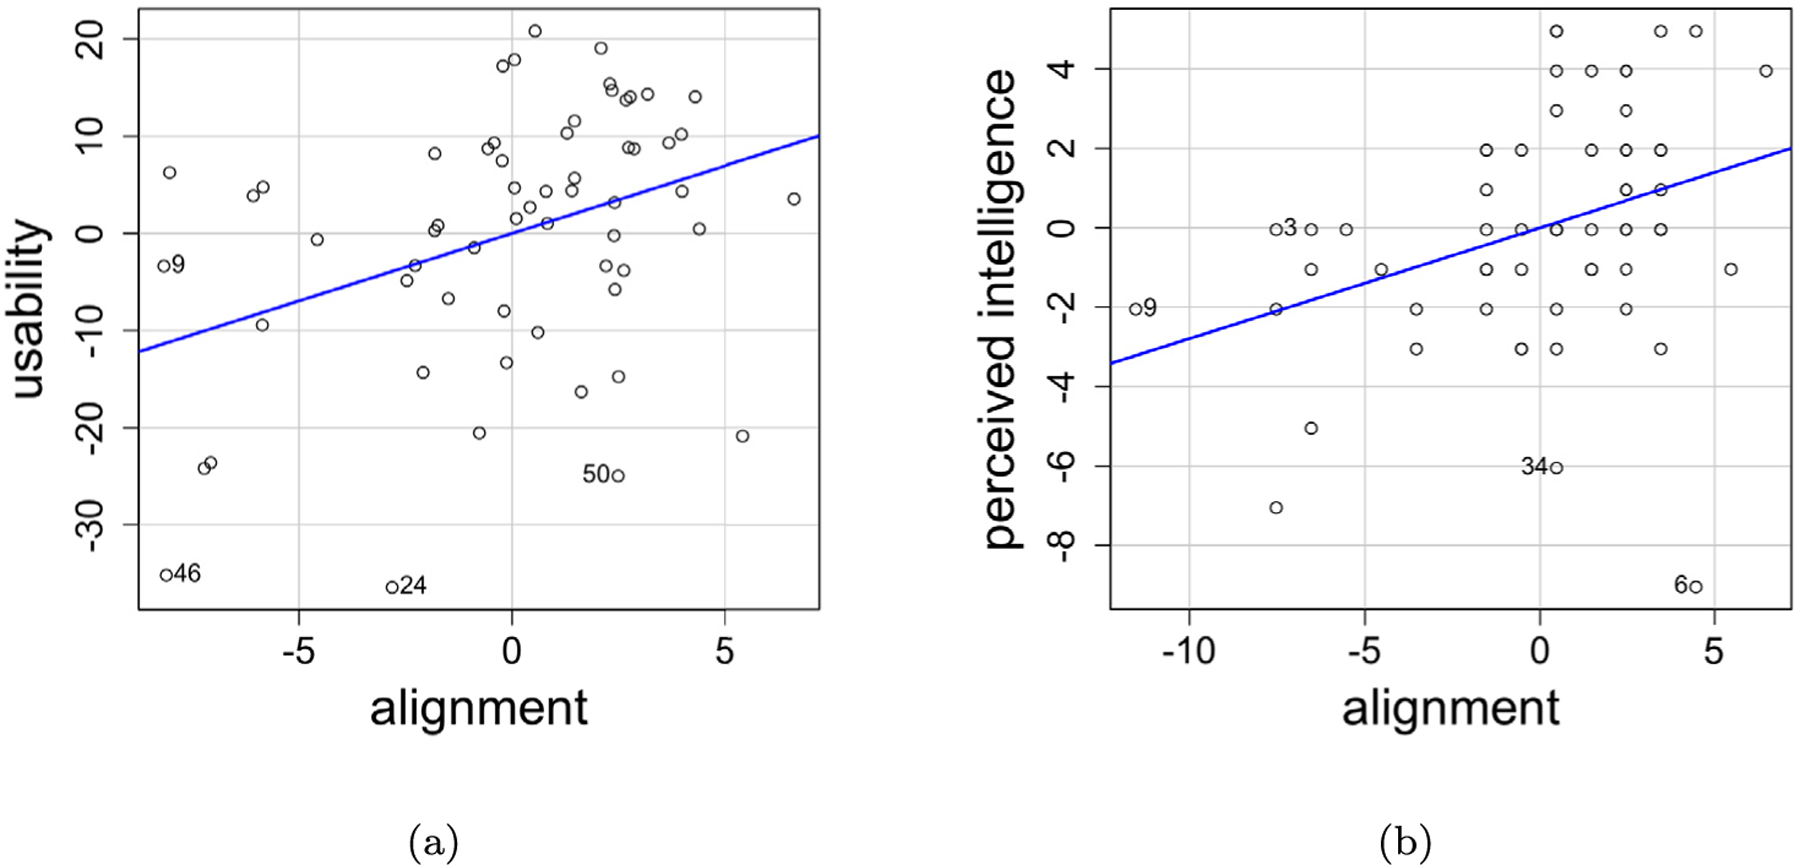
These plots denote the impact of perceived alignment on usability and perceived intelligence.
Our study condition, i.e. the format of recommendation shown to the user, was not found to significantly affect alignment. However, while modeling general preference of diverse strategies, through our preference questionnaire, alignment was a significant covariate (F(1, 58) = 5.007, 𝑝 < 0.05). Higher perceived alignment improved a participants general preference towards diverse strategies, which indicates that when a participant received a recommendation which was perceived to more accurately reflect their preferences, they were more open to being provided other contrasting strategies. In-line with recent work regarding the improved perception of importance of personalized recommendations (Kim and Lee, 2019), our finding indicates that perceiving recommendations to be more aligned to their preferences increased a participant’s openness or trust towards receiving other contrasting strategies they would not generally prefer.
5.5. Discussion
Our experiment highlights key trends with regards to the design of strategy recommendation systems. Supporting prior work on general recommendation systems (Nguyen et al., 2018; Bakir et al., 2023), our results highlight the importance of accounting for personality factors during the design of AI strategy recommendations. We found that conscientiousness significantly reduced a participants preference towards the single strategy mode of presentation and agreeableness can increase the workload experienced. This finding hints at the possibility that the intrinsic traits of the end-user can be used to preemptively design more suitable strategy recommendation systems. For example, prior work has shown that high conscientiousness is very important for high-stress, skill based positions like surgeons or helicopter pilots (Dickens, 2013; Grice and Katz, 2006; Mullola et al., 2018). Our results may indicate that humans in such occupations may not prefer the single strategy condition of recommendations. Also, physicians working in the private sector with general practice or occupation health as their specialization, can have high levels of agreeableness (Mullola et al., 2018). Professionals in these fields might experience higher workload while using a strategy recommendation systems. Additionally, there seemed to be a general preference towards single strategy recommendation systems over similar strategies recommendation system. Thus, if a recommendation system is capable of inferring user preferences, users may find it more usable to be presented with just the most relevant strategy instead of choosing from a list of strategies similar to the most relevant strategy, which may be attributed to choice overload (Bollen et al., 2010).
Prior work has shown that humans hold AI-assistants to a higher standard than human-assistants (Chen et al., 2021). To design recommendation systems for human–AI collaborative tasks, that humans will be willing to adopt, we need to better understand the perception of these systems, as perception directly impacts user-experience (Zhang and Li, 2004). Recent work on news-recommendations has shown that a user’s satisfaction plays a significant role in determining continued intention to use a news-recommendation system (Shin et al., 2020). Our experiment furthers research on usability of recommendation systems, directly studying the impact of perceived alignment on a user’s perception of usability or intelligence.
Recent work on personalization has shown that users perceive personalized generations to be more important and informative (Kim and Lee, 2019), and our findings builds on this research in the context of strategy recommendations. Our findings show that, when a user perceives the recommended strategies to be aligned with their preferences, they are more open to receiving a diverse or varied set of recommendations. This result encourages future work to strive towards building mechanisms to infer a user’s preferences at scale and more accurately convey the alignment of a recommendation to the user. However, this finding regarding the alignment of recommendations also offers a cautionary tale. Within the UX design community there is a term called “dark patterns”, which are malicious design specifications to trick or convince the user to perform an action which does not benefit them (Gray et al., 2018). Therefore, in future work, it is important to ensure that there is a minimal degree of confidence in the correctness of strategy recommendations generated by the system.
Finally, some initial insights from our qualitative questionnaire hint at the benefits of incorporating explainable AI mechanisms (Zhu and Williams, 2020; Ehsan et al., 2019; Silva et al., 2022; Tambwekar and Gombolay, 2023) in strategy recommendation systems could further benefit confidence in the system. For instance, one participant commented that, “I wish that the interface would explain a bit more on how my choices were converted into the strategy so I would feel more confident in it”, which supports a claim from recent work (Yang et al., 2021). Yang et al. (2021) state that recommendations and explanations should be integrated and modeled in conjunction so that the explanation can adequately defend the recommendation. Facilitating this process should be an important consideration for future work on strategy recommendations. An important next step would be to study directly study strategy recommendation systems from the perspective of user-adoption in a more immersive setting wherein users have to use the strategy they were recommended, in order to ascertain how each of these three properties (i.e., alignment, usability, and perceived intelligence) affect willingness to adopt a given mode of recommending strategies.
6. Limitations
Firstly, although we provide participants with a tutorial as well as a simulation of Risk gameplay, we cannot be certain that participants have adequately understood Risk. We obtain verbal confirmation from participants that they are comfortable with the game, however, we do not specifically test for this. Without adequately understanding how to play Risk, participants may not be able to create a mental model of the strategy they would employ, and thus may have difficulty evaluating the strategy recommendations. While important to acknowledge, this does not diminish our findings and analysis due to the number of participants who took part in our experiments and the comprehensive nature of the tutorial and simulation.
Secondly, in this study we have not conducted factor analysis of the preference questionnaire we designed. Our analysis showed significant trends relating to the participant preference, that provided support for the validity of our questionnaire. However, in future work, we hope to perform factor analysis to ensure reliability of the questions in relation to each factor (Single, Similar, Diverse, All). An interesting result we found in our analysis was that age significantly influenced the general preference towards single strategy recommendations. This could indicate a broader impact of age as a dependent variable in this analysis. As our population was primarily comprised of people between the ages of 18–30, future work could perform a similar study with a wider population to confirm the trends we discovered. Lastly, while our study provides novel insights regarding broad strategy recommendation preferences, our experiment is not setup in an immersive real-world task. In future work, we hope to develop a real-world collaborative experiment with a robot wherein the robot recommends strategies to a participant, and the human employs the recommendations to specify how the robot should complete the collaborative task. We would also conduct this human-subjects experiment on a more diverse population in the future.
7. Conclusion
As humans collaborate with AI-agents to solve more challenging tasks, humans may not have the capability to translate their preferences into actionable strategies that an AI agent can execute. To solve this issue, we need to develop strategy recommendation systems that can take in a user’s preferences and recommend well defined strategies. Prior work on user-centric recommendation systems has studied the impact of personality type of a user on the perception of a recommendation system as well as the general structure of a recommendation list. However, if the task at hand is more intricate and complex these preferences might change. In this paper, we conducted a novel human subjects experiment to understand how differing types of recommendations impact the usability, perceived intelligence, workload and preference towards any given mode of recommendation. We created and validated a novel method of encoding a participant’s preferences into an actionable strategy for Risk through three simple gameplay questions. We also developed a new questionnaire to gauge user preference towards receiving single, similar, diverse, or all types of recommendations. Our analysis showed that certain personality traits (e.g.: conscientiousness) have a significant impact on the preference of a particular type of recommendation system. Finally, we report a correlation between preference, alignment and usability, highlighting the need for further mechanisms to automatically infer user preferences and align strategy recommendations with it. Our work provides insights into user preferences for a strategy recommendation system which can be used to design personalized systems for human–AI teaming in the future. Personalization can in turn lead to higher user satisfaction and adoption of the strategy recommendation system.
Acknowledgments
This work was supported by the Office of Naval Research, USA under grant N00014-19-2076, the National Institutes of Health (NIH), USA under grant 1R01HL157457 and a gift by Konica Minolta to the Georgia Tech Research Foundation.
Appendix A. Additional results
We utilized AICc as our Occam’s razor to finalize the model for analyzing each dependent variable. For each dependent variable, we began with a model that modeled each individual covariate and independent variable along with all pairwise interaction effects between these variables. We removed variables until we arrived at the linear regression model with the lowest AIC score. In this section, we report an additional significant finding that was not relevant to our research questions.
We found that the preference for diverse strategies was inversely related to the preference for similar strategies. This was found to be a significant correlation while modeling both preference for similar strategies (F(1, 58) = 7.932, 𝑝 < 0.01) and preference was diverse strategies (F(1, 58) = 7.639, 𝑝 < 0.01) (Fig. A.8). This result is intuitive as people who like to recommended strategies aligned to their preference would not like to be recommended diverse strategies and vice-versa.
Appendix B. Questionnaires
B.1. Calibration questionnaire
In this section, we provide the seven questions utilized to encode the preferred gameplay style of a participant. The calibrated gameplay style was further used to recommend strategies (Fig. 4). The questionnaire comprises of seven questions each containing two options to choose from (Fig. D.10).
B.2. Preference questionnaire
This section contains the details regarding the questions and scoring of our novel preference questionnaire. We have four questions directed at measuring the preference towards each type of condition. We randomized the questions for a particular condition.
Questionnaire.
Imagine you are completing a challenging task and you have to come up with a well-defined strategy that you can use. You are then provided with an AI agent which can understand your preferences and accurately provide strategy recommendations (similar to the process you went through in this study). In such instances, please answer the following questions regarding how you would like to receive plan recommendations on a scale of 1–7, 1 being strongly disagree and 7 being strongly agree.
I would like to be presented with a single plan which best reflects my preferences.
Even if I am presented with a plan that best represents my preferences, I would prefer receiving additional options that I could consider.
I don’t need more than one plan if I am presented with a plan which best reflects my preferences.
Evaluating more than one plan is not worth the extra work.
I would like to be presented with multiple plans: one that best reflects my strategy preferences and a couple of alternative plans that are slightly different.
I would not like to be presented with more than one strategy related to my preferences. The other options should be dissimilar.
I would not want to be presented with a diverse set of plans. Instead, I would want a few plans that are closely aligned with my strategy preferences.
Picking from a set of similar plans is better than picking from a set of dissimilar plans.
I would like to be presented with multiple, diverse plans: one that best reflects my strategy preferences, one that is very different from my preferences, and one that is neither similar nor dissimilar from my preference.
I would prefer for all the plans presented to me to be similar rather than dissimilar.
I want to be able to consider a diverse set of options if the list is not too long.
I would not like to consider plans that are different from my preferences.
I would like to be presented with a list of every possible plan – one for each possible strategy.
Evaluating all possible plans is not worth the effort.
Seeing the breadth of planning possibilities is helpful for identifying the best plan.
Being presented with all possible plans will not help me in accomplishing my goals.
Scoring.
This section covers how we computed scores for each factor in the questionnaire. Some items in the questionnaire need to be reversed prior to scoring. Each factor in our questionnaire had at least one reverse item to ensure that participants were paying attention to the questions. Items 2, 6, 10, 12, 14, and 16 need to be reversed before scoring:
1 = 7
2 = 6
3 = 5
4 = 4
5 = 3
6 = 2
7 = 1
Preference for Single Strategy Recommendation : Sum of items 1, 2r, 3, 4
Preference for Similar Strategies Recommendations : Sum of items 5, 6r, 7, 8
Preference for Diverse Strategies Recommendations : Sum of items 9, 10r, 11, 12r
Preference for All Strategies Recommendation : Sum of items 13, 14r, 15, 16r r refers to a reverse scaled item here.
Appendix C. Interview questions for calibration study
During the calibration phase if the participant preferred the reverse strategy (opposite of the strategy generated by our decision tree), we asked them these semi-structured interview questions to understand the missing gap.
What strategy do you generally follow in the game?
Which strategy is most aligned with your strategy?
How do you think Strategy A is different from Strategy B?
Can you rank the following strategies from least aligned to most aligned with your strategy?
Why did you select option X?
What do you think this question is trying to convey?
What changes in the setup would make you change your answer?
Appendix D. Data filtering rubric
In the Phase 1 of our study (i.e. calibration phase) we discarded one data point where the participant acknowledged that the aligned strategy was a better representation of his choices in the scenarios but rated the reverse strategy higher. This section contains the rubric that was used to filter out the data for Phase 2 of our study. We discarded four data points using the following rubric -
The participant did not read through the goals and constraints of the recommended strategy.
The participant evaluated the Qualtrics UI rather than the recommendation system.
Instead of evaluating the strategy the participant only evaluated how well the simulated strategy was performing.
The participants made some mistakes while going through the user study.
For e.g. - The participant selected a wrong options in the initial calibration questionnaire
For e.g. - The participant forgot to answer one of the Likert items of the preference questionnaire (see Fig. D.11).
Fig. A.8.

These plots denote the correlation between preference for diverse strategies and preference for similar strategies.
Fig. A.9.

Boxplots for different personality traits of the recruited participants.
Fig. D.10.
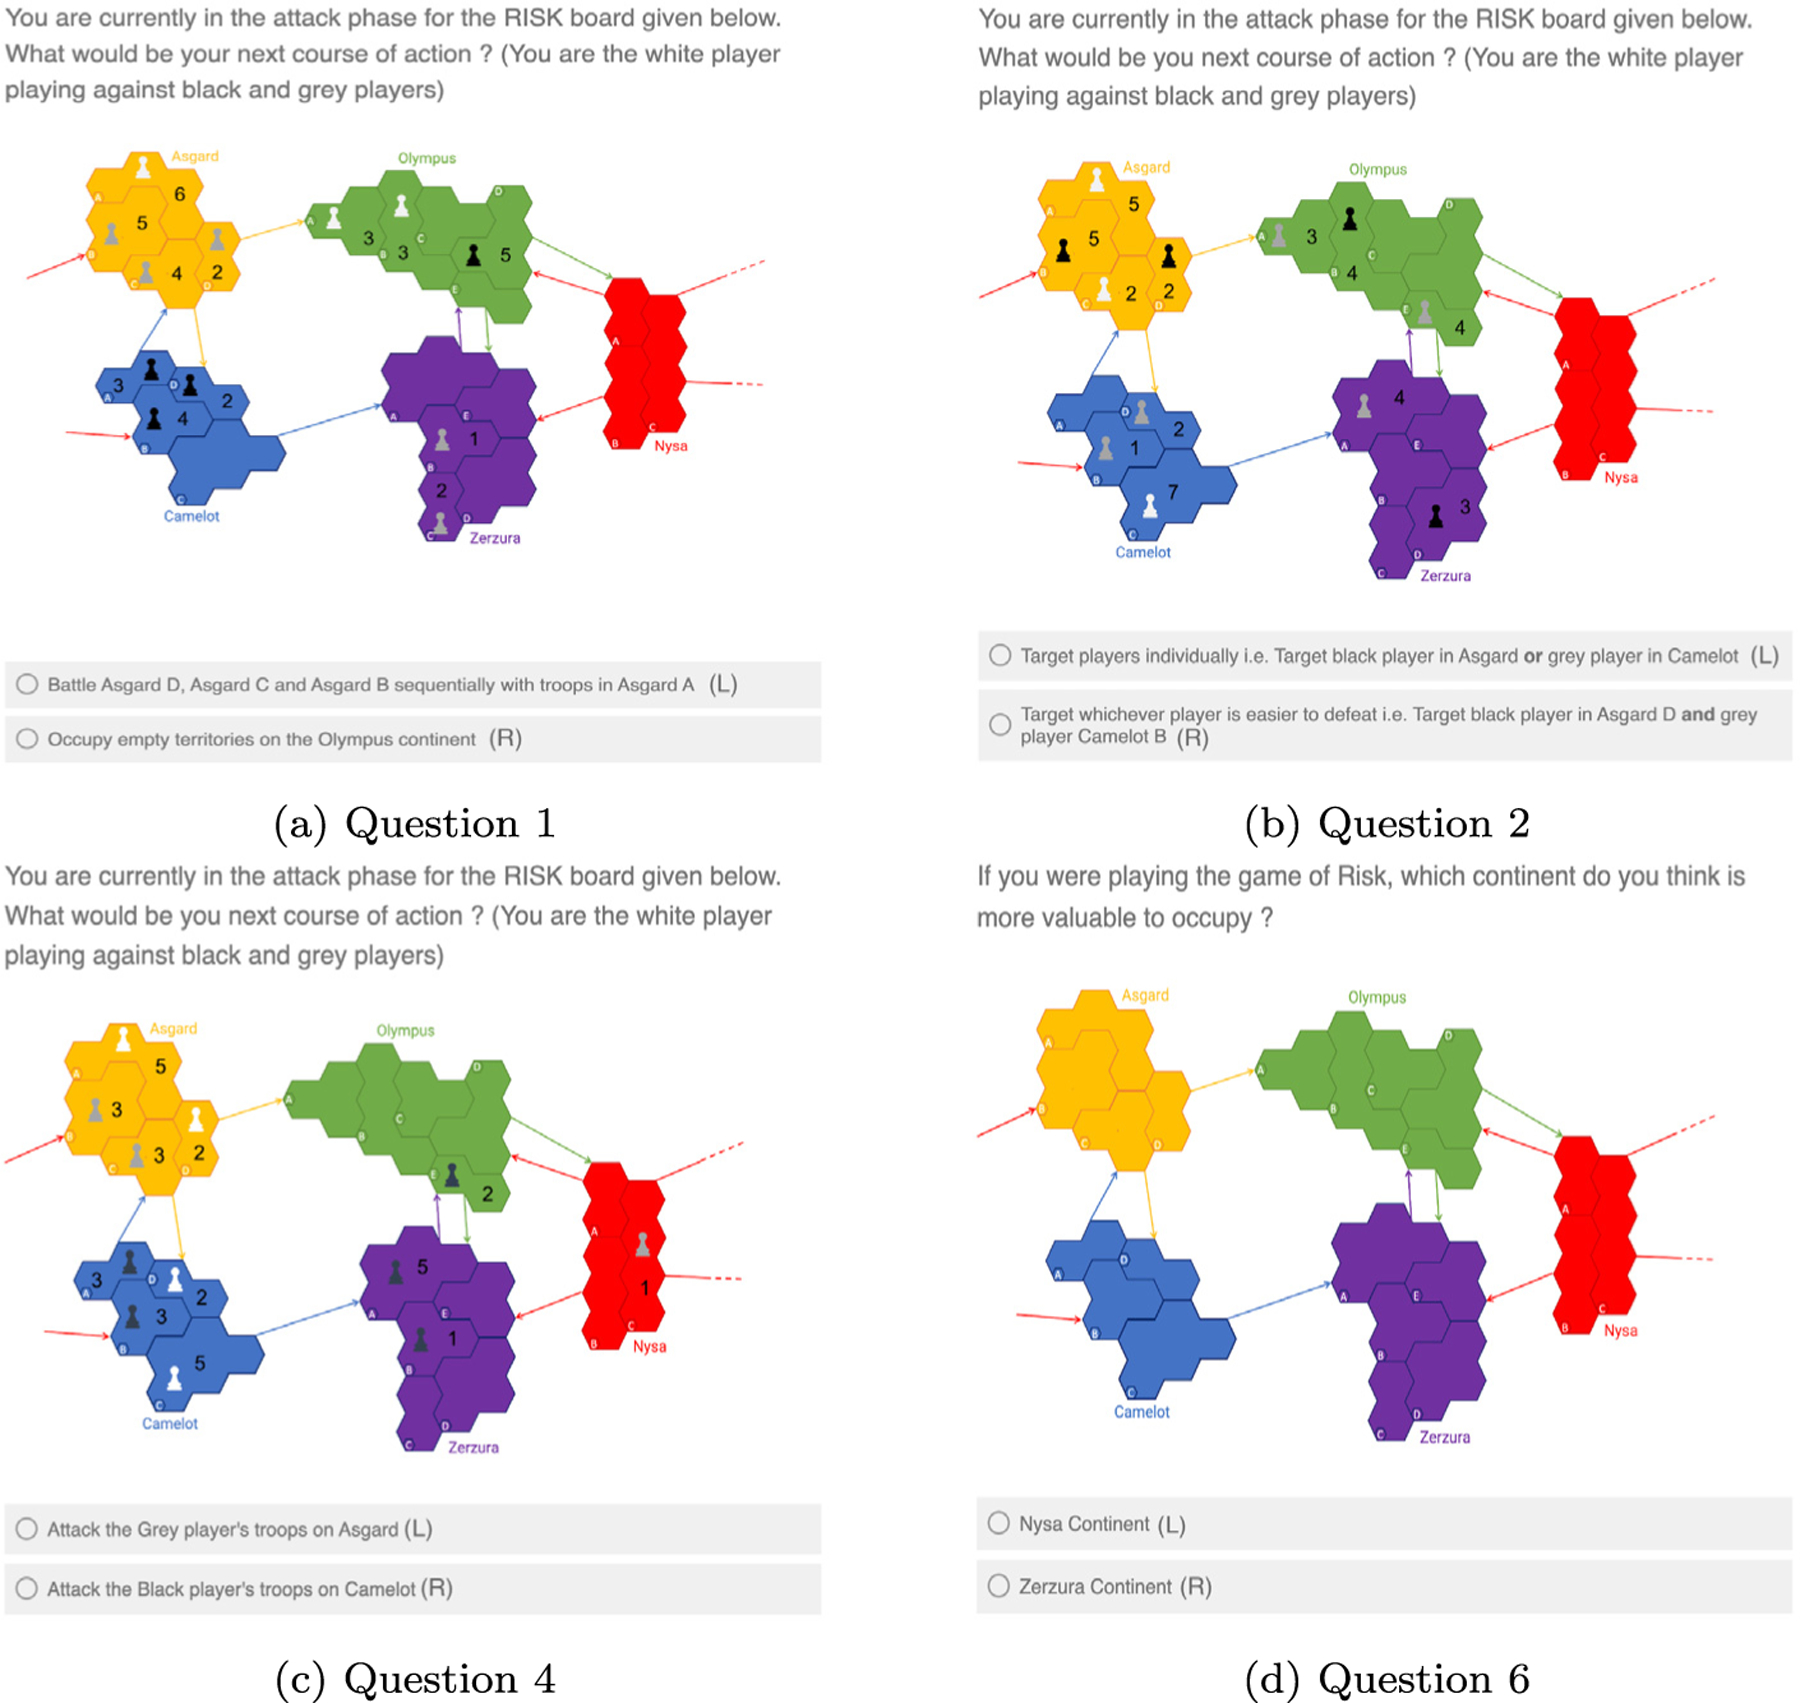


This figures contains all questions comprising the Calibration Questionnaire. Each question forms a different node of the decision tree defined in Fig. 4. (L) implies that selecting this answer moves you to the left branch and (R) implies that selecting this answer moves you to the right branch of the tree.
Fig. D.11.


Detailed description of all 8 strategies that were used in the study. Each strategy contains goals, constraints and a RISK map with the drafting stage for the strategy.
Table D.4.
This table contains the assumptions of the ANOVA test and transforms applied for all the linear models.
| DV | Transform | Shapiro–Wilk | Levene’s |
|---|---|---|---|
| Usability | boxcox | 𝑝 = 0.072 | 𝑝 = 0.325 |
| Alignment | boxcox | 𝑝 = 0.101 | 𝑝 = 0.368 |
| Preference for Single Strategy | N/A | 𝑝 = 0.684 | 𝑝 = 0.893 |
| Preference for Similar Strategies | N/A | 𝑝 = 0.321 | 𝑝 = 0.379 |
| Preference for Diverse Strategies | boxcox | 𝑝 = 0.424 | 𝑝 = 0.424 |
| Workload | N/A | 𝑝 = 0.552 | 𝑝 = 0.591 |
| Perceived Intelligence | boxcox | 𝑝 = 0.438 | 𝑝 = 0.841 |
Footnotes
CRediT authorship contribution statement
Lakshita Dodeja: Conceptualization, Investigation, Methodology, Software, Visualization, Writing – original draft. Pradyumna Tambwekar: Conceptualization, Methodology, Supervision, Writing – review & editing. Erin Hedlund-Botti: Formal analysis, Validation, Writing – review & editing. Matthew Gombolay: Conceptualization, Funding acquisition, Methodology, Project administration, Resources, Supervision, Writing – review & editing.
Declaration of competing interest
The authors declare the following financial interests/personal relationships which may be considered as potential competing interests: Matthew Gombolay reports financial support was provided by Office of Naval Research. Lakshita Dodeja reports financial support was provided by Office of Naval Research. Pradyumna Tambwekar reports financial support was provided by Office of Naval Research. Matthew Gombolay reports a relationship with Johns Hopkins University Applied Physics Laboratory that includes: consulting or advisory.
Data availability
The data that has been used is confidential.
References
- Akpa OM, Unuabonah EI, 2011. Small-sample corrected Akaike information criterion: an appropriate statistical tool for ranking of adsorption isotherm models. Desalination 272 (1–3), 20–26. [Google Scholar]
- Anderson A, Maystre L, Anderson I, Mehrotra R, Lalmas M, 2020. Algorithmic effects on the diversity of consumption on spotify In: Proceedings of the Web Conference 2020. pp. 2155–2165. [Google Scholar]
- Bakir V, Laffer A, McStay A, 2023. Human-first, please: Assessing citizen views and industrial ambition for emotional AI in recommender systems. Surveill. Soc 21 (2), 205–222. [Google Scholar]
- Bartneck C, Kulić D, Croft E, Zoghbi S, 2009. Measurement instruments for the anthropomorphism, animacy, likeability, perceived intelligence, and perceived safety of robots. Int. J. Soc. Robotics 1 (1), 71–81. [Google Scholar]
- Behera RK, Gunasekaran A, Gupta S, Kamboj S, Bala PK, 2020. Personalized digital marketing recommender engine. J. Retail. Consum. Serv 53, 101799. [Google Scholar]
- Blanca Mena MJ, Alarcón Postigo R, Arnau Gras J, Bono Cabré R, Bendayan R, et al. , 2017. Non-normal data: Is ANOVA still a valid option? Psicothema [DOI] [PubMed]
- Bollen D, Knijnenburg BP, Willemsen MC, Graus M, 2010. Understanding choice overload in recommender systems In: Proceedings of the Fourth ACM Conference on Recommender Systems. pp. 63–70. [Google Scholar]
- Brooke J, et al. , 1996. SUS-A quick and dirty usability scale. Usability Eval. Ind 189 (194), 4–7. [Google Scholar]
- Burke J, Murphy R, 2004. Human-robot interaction in USAR technical search: two heads are better than one. In: RO-MAN 2004. 13th IEEE International Workshop on Robot and Human Interactive Communication (IEEE Catalog No.04TH8759) pp. 307–312. 10.1109/ROMAN.2004.1374778. [DOI]
- Chen N, Mohanty S, Jiao J, Fan X, 2021. To err is human: Tolerate humans instead of machines in service failure. J. Retail. Consum. Serv 59, 102363. [Google Scholar]
- Chen L, Wu W, He L, 2013. How personality influences users’ needs for recommendation diversity? In: CHI’13 Extended Abstracts on Human Factors in Computing Systems pp. 829–834.
- Chen J, Yin J, 2006. Recommendation based on influence sets. In: Proceedings of the Workshop on Web Mining and Web Usage Analysis Citeseer. [Google Scholar]
- Cochran WG, 1947. Some consequences when the assumptions for the analysis of variance are not satisfied. Biometrics 3 (1), 22–38. [PubMed] [Google Scholar]
- Dickens P, 2013. Looking for chuck and PT: An evidence-based approach to assessing helicopter pilots. In: 17th International Symposium on Aviation Psychology p. 651.
- Donnellan MB, Oswald FL, Baird BM, Lucas RE, 2006. The mini-IPIP scales: tiny-yet-effective measures of the Big Five factors of personality. Psychol. Assess 18 (2), 192. [DOI] [PubMed] [Google Scholar]
- Ehsan U, Tambwekar P, Chan L, Harrison B, Riedl MO, 2019. Automated rationale generation: a technique for explainable AI and its effects on human perceptions In: Proceedings of the 24th International Conference on Intelligent User Interfaces. pp. 263–274. [Google Scholar]
- Farwell JP, 2020. Information Warfare: Forging Communication Strategies for Twenty-First Century Operational Environments Marine Corps University Press. [Google Scholar]
- Gasteiger N, Hellou M, Ahn HS, 2023. Factors for personalization and localization to optimize human–robot interaction: A literature review. Int. J. Soc. Robotics 15 (4), 689–701. [Google Scholar]
- Giunchiglia F, Walsh T, 1992. A theory of abstraction. Artif. Intell 57 (2–3), 323–389. [Google Scholar]
- Glass GV, Peckham PD, Sanders JR, 1972. Consequences of failure to meet assumptions underlying the fixed effects analyses of variance and covariance. Rev. Educ. Res 42 (3), 237–288. [Google Scholar]
- Gombolay M, Bair A, Huang C, Shah J, 2017. Computational design of mixed-initiative human–robot teaming that considers human factors: situational awareness, workload, and workflow preferences. Int. J. Robot. Res 36 (5–7), 597–617. [Google Scholar]
- Gray CM, Kou Y, Battles B, Hoggatt J, Toombs AL, 2018. The dark (patterns) side of UX design. In: Proceedings of the 2018 CHI Conference on Human Factors in Computing Systems. CHI ‘18, Association for Computing Machinery, New York, NY, USA, pp. 1–14. 10.1145/3173574.3174108. [DOI] [Google Scholar]
- Grice R, Katz LC, 2006. Personality Profiles of Experienced US Army Aviators Across Mission Platforms. Tech. rep., ARMY RESEARCH INST FOR THE BEHAVIORAL AND SOCIAL SCIENCES FORT RUCKER AL . . .
- Hack H, 1958. An empirical investigation into the distribution of the F-ratio in samples from two non-normal populations. Biometrika 45 (1/2), 260–265. [Google Scholar]
- Hart SG, Staveland LE, 1988. Development of NASA-TLX (task load index): Results of empirical and theoretical research. In: Advances in Psychology, Vol. 52. Elsevier, pp. 139–183. [Google Scholar]
- He X, Liao L, Zhang H, Nie L, Hu X, Chua T-S, 2017. Neural collaborative filtering In: Proceedings of the 26th International Conference on World Wide Web. pp. 173–182. [Google Scholar]
- Heintzman L, Hashimoto A, Abaid N, Williams RK, 2021. Anticipatory planning and dynamic lost person models for human-robot search and rescue In: 2021 IEEE International Conference on Robotics and Automation. ICRA, IEEE, pp. 8252–8258. [Google Scholar]
- Hou YT-Y, Jung MF, 2021. Who is the expert? Reconciling algorithm aversion and algorithm appreciation in AI-supported decision making. Proc. ACM Hum.-Comput. Interact 5 (CSCW2), 1–25.36644216 [Google Scholar]
- Hu S, 2007. Akaike information criterion. Cent. Res. Sci. Comput 93, 42. [Google Scholar]
- Huang AY, Lu OH, Yang SJ, 2022. Effects of artificial intelligence–Enabled personalized recommendations on learners’ learning engagement, motivation, and outcomes in a flipped classroom. Comput. Educ 104684.
- Jhaver S, Karpfen Y, Antin J, 2018. Algorithmic anxiety and coping strategies of airbnb hosts In: Proceedings of the 2018 CHI Conference on Human Factors in Computing Systems. pp. 1–12. [Google Scholar]
- Johnson M, Bradshaw JM, 2021. How interdependence explains the world of teamwork. In: Engineering Artificially Intelligent Systems Springer, pp. 122–146. [Google Scholar]
- Jugovac M, Jannach D, 2017. Interacting with recommenders—overview and research directions. ACM Trans. Interact. Intell. Syst. (TiiS) 7 (3), 1–46. [Google Scholar]
- Kaminskas M, Bridge D, 2016. Diversity, serendipity, novelty, and coverage: a survey and empirical analysis of beyond-accuracy objectives in recommender systems. ACM Trans. Interact. Intell. Syst. (TiiS) 7 (1), 1–42. [Google Scholar]
- Khatwani S, Chandak M, 2016. Building personalized and non personalized recommendation systems In: 2016 International Conference on Automatic Control and Dynamic Optimization Techniques. ICACDOT, IEEE, pp. 623–628. [Google Scholar]
- Khwaja M, Ferrer M, Iglesias JO, Faisal AA, Matic A, 2019. Aligning daily activities with personality: towards a recommender system for improving wellbeing In: Proceedings of the 13th Acm Conference on Recommender Systems. pp. 368–372. [Google Scholar]
- Kim D, Lee J, 2019. Designing an algorithm-driven text generation system for personalized and interactive news reading. Int. J. Hum.-Comput. Interact 35 (2), 109–122. [Google Scholar]
- Kim M-G, Park M, Kim J, Kwon Y-S, Sohn D-S, Yoon H, Seo K-H, 2021. On the common and different expectations on robot service in restaurant between customers and employees In: Companion of the 2021 ACM/IEEE International Conference on Human-Robot Interaction. pp. 262–265. [Google Scholar]
- Kluver D, Ekstrand MD, Konstan JA, 2018. Rating-based collaborative filtering: algorithms and evaluation. Soc. Inf. Access 344–390.
- Knijnenburg BP, Willemsen MC, 2015. Evaluating recommender systems with user experiments. In: Recommender Systems Handbook Springer, pp. 309–352. [Google Scholar]
- Koren Y, Rendle S, Bell R, 2022. Advances in collaborative filtering. In: Recommender Systems Handbook Springer, pp. 91–142. [Google Scholar]
- Kumar P, Thakur RS, 2018. Recommendation system techniques and related issues: a survey. Int. J. Inf. Technol 10 (4), 495–501. [Google Scholar]
- Kunaver M, Požrl T, 2017. Diversity in recommender systems–A survey. Knowl.-Based Syst 123, 154–162. [Google Scholar]
- Li Q, Ng KK, Fan Z, Yuan X, Liu H, Bu L, 2021. A human-centred approach based on functional near-infrared spectroscopy for adaptive decision-making in the air traffic control environment: A case study. Adv. Eng. Inform 49, 101325. [Google Scholar]
- Liang Y, Zheng P, Xia L, 2023. A visual reasoning-based approach for driving experience improvement in the AR-assisted head-up displays. Adv. Eng. Inform 55, 101888. 10.1016/j.aei.2023.101888, URL https://www.sciencedirect.com/science/article/pii/S1474034623000162. [DOI] [Google Scholar]
- Linden G, Smith B, York J, 2003. Amazon. com recommendations: Item-to-item collaborative filtering. IEEE Internet Comput 7 (1), 76–80. [Google Scholar]
- Longoni C, Bonezzi A, Morewedge CK, 2019. Resistance to medical artificial intelligence. J. Consum. Res 46 (4), 629–650. [Google Scholar]
- Lops P, Gemmis M.d., Semeraro G, 2011. Content-based recommender systems: State of the art and trends. In: Recommender Systems Handbook Springer, pp. 73–105. [Google Scholar]
- Lops P, Jannach D, Musto C, Bogers T, Koolen M, 2019. Trends in content-based recommendation. User Model. User-Adapt. Interact 29 (2), 239–249. [Google Scholar]
- Magrabi F, Ammenwerth E, McNair JB, De Keizer NF, Hyppönen H, Nykänen P, Rigby M, Scott PJ, Vehko T, Wong ZS-Y, et al. , 2019. Artificial intelligence in clinical decision support: challenges for evaluating AI and practical implications. Yearb. Med. Inf 28 (01), 128–134. [DOI] [PMC free article] [PubMed] [Google Scholar]
- McNee SM, Riedl J, Konstan JA, 2006. Making recommendations better: an analytic model for human-recommender interaction. In: CHI’06 Extended Abstracts on Human Factors in Computing Systems pp. 1103–1108.
- Mullola S, Hakulinen C, Presseau J, Gimeno Ruiz de Porras D, Jokela M, Hintsa T, Elovainio M, 2018. Personality traits and career choices among physicians in Finland: employment sector, clinical patient contact, specialty and change of specialty. BMC Med. Educ 18 (1), 1–12. [DOI] [PMC free article] [PubMed] [Google Scholar]
- Murphy RR, 2004. Human-robot interaction in rescue robotics. IEEE Trans. Syst. Man Cybern. C 34 (2), 138–153. [Google Scholar]
- Nguyen TT, Maxwell Harper F, Terveen L, Konstan JA, 2018. User personality and user satisfaction with recommender systems. Inf. Syst. Front 20 (6), 1173–1189. [Google Scholar]
- Nikolaidis S, Shah J, 2012. Human-robot teaming using shared mental models. In: ACM/IEEE HRI
- Reutskaja E, Hogarth RM, 2009. Satisfaction in choice as a function of the number of alternatives: When “goods satiate”. Psychol. Mark 26 (3), 197–203. [Google Scholar]
- Ruan J, Du Y, Xiong X, Xing D, Li X, Meng L, Zhang H, Wang J, Xu B, 2022. GCS: graph-based coordination strategy for multi-agent reinforcement learning arXiv preprint arXiv:2201.06257.
- Sarwar B, Karypis G, Konstan J, Riedl J, 2001. Item-based collaborative filtering recommendation algorithms In: Proceedings of the 10th International Conference on World Wide Web. pp. 285–295. [Google Scholar]
- Schafer JB, Frankowski D, Herlocker J, Sen S, 2007. Collaborative filtering recommender systems. In: The Adaptive Web Springer, pp. 291–324. [Google Scholar]
- Shani G, Gunawardana A, 2011. Evaluating recommendation systems. In: Recommender Systems Handbook Springer, pp. 257–297. [Google Scholar]
- Shin D, Zhong B, Biocca FA, 2020. Beyond user experience: What constitutes algorithmic experiences? Int. J. Inf. Manage 52, 102061. [Google Scholar]
- Shinozawa K, Naya F, Yamato J, Kogure K, 2005. Differences in effect of robot and screen agent recommendations on human decision-making. Int. J. Hum.-Comput. Stud 62 (2), 267–279. [Google Scholar]
- Silva A, Schrum M, Hedlund-Botti E, Gopalan N, Gombolay M, 2022. Explainable artificial intelligence: Evaluating the objective and subjective impacts of xAI on human-agent interaction. Int. J. Hum.-Comput. Interact 1–15.
- Smith JJ, Jayne L, Burke R, 2022. Recommender systems and algorithmic hate. In: Proceedings of the 16th ACM Conference on Recommender Systems pp. 592–597.
- Szpektor I, Maarek Y, Pelleg D, 2013. When relevance is not enough: Promoting diversity and freshness in personalized question recommendation In: Proceedings of the 22nd International Conference on World Wide Web. pp. 1249–1260. [Google Scholar]
- Tabrez A, Luebbers MB, Hayes B, 2020. A survey of mental modeling techniques in human–robot teaming. Curr. Robotics Rep 1 (4), 259–267. [Google Scholar]
- Tam KY, Ho SY, 2003. Web personalization: Is it effective? IT Prof 5 (5), 53–57. [Google Scholar]
- Tambwekar P, Gombolay M, 2023. Towards reconciling usability and usefulness of explainable AI methodologies arXiv preprint arXiv:2301.05347. [DOI] [PMC free article] [PubMed]
- Tambwekar P, Vaska N, Dodeja L, Gombolay M, 2022. Commander’s intent: A dataset and modeling approach for human-AI task specification in strategic play 10.48550/ARXIV.2208.08374, URL https://arxiv.org/abs/2208.08374. [DOI]
- Tan H, Guo J, Li Y, 2008. E-learning recommendation system. In: 2008 International Conference on Computer Science and Software Engineering, Vol. 5. IEEE, pp. 430–433. [Google Scholar]
- Tarus JK, Niu Z, Mustafa G, 2018. Knowledge-based recommendation: a review of ontology-based recommender systems for e-learning. Artif. Intell. Rev 50 (1), 21–48. [Google Scholar]
- Tran TNT, Felfernig A, Tintarev N, 2021. Humanized recommender systems: State-of-the-art and research issues. ACM Trans. Interact. Intell. Syst. (TiiS) 11 (2), 1–41. [Google Scholar]
- Van Meteren R, Van Someren M, 2000. Using content-based filtering for recommendation. In: Proceedings of the Machine Learning in the New Information Age: MLnet/ECML2000 Workshop, Vol. 30. pp. 47–56. [Google Scholar]
- Vanetti M, Binaghi E, Carminati B, Carullo M, Ferrari E, 2010. Content-based filtering in on-line social networks. In: International Workshop on Privacy and Security Issues in Data Mining and Machine Learning Springer, pp. 127–140. [Google Scholar]
- Willemsen MC, Graus MP, Knijnenburg BP, 2016. Understanding the role of latent feature diversification on choice difficulty and satisfaction. User Model. User-Adapt. Interact 26 (4), 347–389. [Google Scholar]
- Xiao W, Zhao H, Pan H, Song Y, Zheng VW, Yang Q, 2019. Beyond personalization: Social content recommendation for creator equality and consumer satisfaction In: Proceedings of the 25th ACM SIGKDD International Conference on Knowledge Discovery & Data Mining. pp. 235–245. [Google Scholar]
- Yang A, Wang N, Deng H, Wang H, 2021. Explanation as a defense of recommendation In: Proceedings of the 14th ACM International Conference on Web Search and Data Mining. pp. 1029–1037. [Google Scholar]
- Zanker M, Rook L, Jannach D, 2019. Measuring the impact of online personalisation: Past, present and future. Int. J. Hum.-Comput. Stud 131, 160–168. [Google Scholar]
- Zhang P, Li N, 2004. Love at first sight or sustained effect? The role of perceived affective quality on users’ cognitive reactions to information technology
- Zhang YC, Séaghdha DÓ, Quercia D, Jambor T, 2012. Auralist: introducing serendipity into music recommendation In: Proceedings of the Fifth ACM International Conference on Web Search and Data Mining. pp. 13–22. [Google Scholar]
- Zhao M, Simmons R, Admoni H, 2022. Coordination with humans via strategy matching In: 2022 IEEE/RSJ International Conference on Intelligent Robots and Systems. IROS, IEEE, pp. 9116–9123. [Google Scholar]
- Zhu L, Williams T, 2020. Effects of proactive explanations by robots on human-robot trust. In: International Conference on Social Robotics Springer, pp. 85–95. [Google Scholar]
- Ziegler C-N, McNee SM, Konstan JA, Lausen G, 2005. Improving recommendation lists through topic diversification In: Proceedings of the 14th International Conference on World Wide Web. pp. 22–32. [Google Scholar]
Associated Data
This section collects any data citations, data availability statements, or supplementary materials included in this article.
Data Availability Statement
The data that has been used is confidential.