

Abstract
DGet! is an open-source analysis package written in Python for calculating the degree of deuterium enrichment in isotopically labelled molecules using mass spectrometric data. The nuclear properties of deuterium make it a valuable tracer in metabolic studies and an excellent contrast agent in nuclear spectroscopies. Determination of molecular deuteration levels is typically performed using mass spectrometry, however software options to perform these calculations are scarce. The in-house scripts and spreadsheets currently used rarely account for isotopic interferences from 13C or multi-isotopic elements that impact deuteration calculations. DGet! removes isotopic interferences using de-convolution and both the isotopological makeup and overall deuteration level can be accurately recovered. The software is available as command line and web applications that take a molecular formula and mass spectrometry data and output a graphical representation of the degree of deuteration as well as the distribution of partially deuterated analogues. These applications are designed to be easy to use and enable superior characterisation of deuterated molecules for users of all levels of expertise, without the limitations of techniques currently used by the majority of deuteration laboratories and researchers.
Graphical Abstract

Supplementary Information
The online version contains supplementary material available at 10.1186/s13321-024-00828-x.
Keywords: Deuterium, Calculator, Deuteration, Mass spectrometry
Introduction
Hydrogen accounts for approximately 90% of the observable universe, consisting of three naturally abundant isotopes; protium (H, 1H), deuterium (D, 2H), and tritium (T, 3H) [1]. Deuterium represents 0.015% of all hydrogen and has found many applications in numerous scientific areas, especially when incorporated into organic molecules [2, 3]. In these molecules, the carbon-deuterium bonds are similar to those of carbon-hydrogen but possess drastic differences in their vibrational modes and thus stability [2]. In addition to changes in vibrational modes, deuterium possesses dramatically different nuclear properties when compared to protium, such as a reduced Larmor frequency (76.773 vs 500.130 MHz at 11.747 T), a 40 × decrease in the incoherent neutron scattering cross section [4], and a positive coherent neutron scattering length [5]. These nuclear properties, its low natural abundance and the similarity of C-H and C-D bonds make deuterated molecules invaluable as a tracers in metabolic studies and as contrast agents in neutron and nuclear magnetic resonance spectroscopic techniques [6–15]. Deuterated molecules can be synthesized using commercially available deuterated precursors (e.g., CD3I, CD3OD, DCO2D, CD3NH2, LiAlD4, NaBD4) in standard chemistry techniques to produce site specific deuterated molecules [2, 16, 17]. Alternatively, deuterium can be incorporated using direct H/D exchange of protonated derivatives in D2O using metal catalysts [14, 18–23], or by biosynthesis using biological organisms grown in D2O (Fig. 1) [13, 24–26].
Fig. 1.

Mass spectra for undeuterated and deuterated cholesterol. Biosynthetic cholesterol obtained from Saccharomyces sp. grown in protium oxide [C27H46O] a and deuterium oxide [C27HD45O] b medium and their associated high-resolution mass spectra
When performing H/D exchange reactions, the exchange of protons is typically non-specific; i.e. exchange of H to D is random and occurs universally across the molecule at each site to differing extents [27]. The variation in deuteration levels can be attributed to the steric availability of the exchangeable C-H positions, or to differing levels of stability at certain positions [27, 28]. Given the applications of these deuterated molecules, it is necessary to quantify both the overall and site-specific deuterium content to assess the degree of deuterium enrichment and to understand the distribution of isotopologues. This is especially important in cases where the deuterated analogues are used in quantitative analytical techniques or in neutron experiments as even slight hydrogen contamination will present non-negligible negative complications.
Typically, the quantification of overall deuteration is assessed using mass spectrometry (MS) by analysing the isotopic mass distribution (e.g. Figure 1b), whilst more robust techniques such as evaluation of residual 1H nuclear magnetic resonance signals or interpreting isotopic effects on 13C chemical shifts are required to determine site-specific deuteration [27, 29, 30]. While there is an abundance of software for calculating hydrogen–deuterium exchange (HDX) data [31, 32] for protein and peptide related studies, open-source tools for small molecule deuterium incorporation applications do not exist. The majority of deuteration laboratories still use inhouse scripts and spreadsheets to determine overall molecular deuteration; these existing techniques have several shortcomings such as not being able to remove the effects of interfering isotopes, produce a representation of the distribution of isotopologues, account for all possible adducts, or output a graphical representation of the deuteration fit. These shortcomings introduce difficulties in interpreting mass spectrometry data for complicated deuterated molecules containing a high number of carbon atoms, atoms with high numbers of naturally abundant isotopes, or a large distribution of partially exchanged protons.
Here we provide a simple software tool for routinely analysing and determining the total deuterium enrichment and distribution of isotopologues using mass spectrometry: DGet!. The DGet! software package provides users with both command line and web applications capable of analysing MS data to evaluate deuterium content.
Implementation
The software for deuteration calculation was written in Python 3.11 using the publicly available “molmass” and “NumPy” libraries and is hosted on GitHub (https://github.com/djdt/dget) and the Python Package Index. Documentation including an API reference is also available (https://dget.readthedocs.io/en/latest). A web application has been created for users not experienced with the terminal and can be accessed through the GitHub repository or hosted locally.
The general processing workflow for DGet! is shown in Fig. 2 and requires two inputs; the molecular formula of the fully deuterated molecule and a file containing MS m/z and signal intensity values. MS data is supplied to the software as a delimited text file with at least two columns, one each for m/z and signal intensities. Passing these two options supports high-resolution MS (HRMS) spectra exports for the majority of vendors and options can usually be inferred from the file itself. A small module for importing Shimadzu HRMS data is included due to the different structure of the output of MS spectra.
Fig. 2.
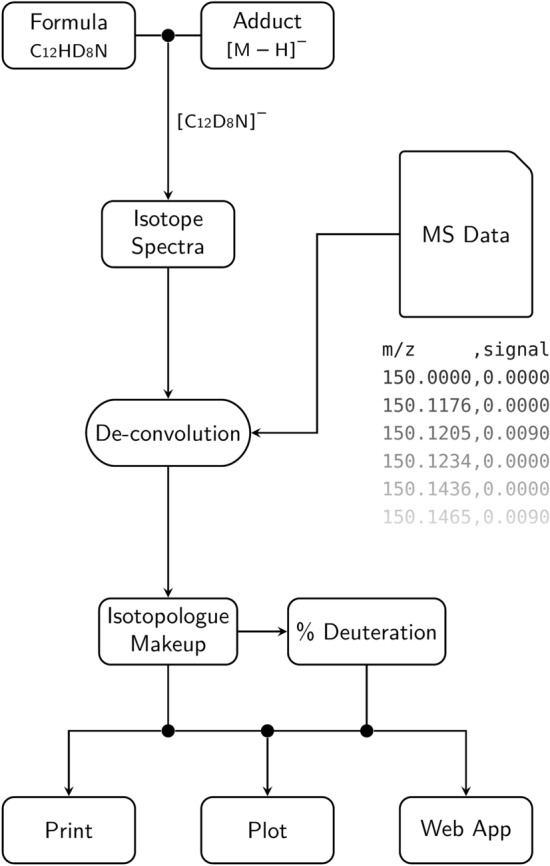
DGet! processing flow. Inputs of a formula and adduct are used to generate the isotopic spectra of the compound and target masses for all isotopologues. Peak heights or areas are extracted from the MS data at these target masses and the isotopologue makeup extracted by de-convolving, using the isotope spectra as a response function. Deuteration percentage and the makeup are then displayed to the user
If the adduct formed during ionisation is known then it can also be passed to the program in the form ‘[M + X]y’, otherwise the adduct is selected from a list of those commonly observed in electrospray ionisation [33]. In this case, the adduct with monoisotopic mass closest to that of the most intense MS peak within the expected deuteration spectrum is automatically chosen. This automatic selection can provide a good starting point for calculations but the chosen adduct should be verified by the user.
Calculation of the deuteration level is performed by first determining the isotopic spectra of the target MS species from the input formula and adduct. This spectrum is used as a response function h to de-convolve the individual contribution of each isotopologue from the mass spectrum. Target m/z values are created by combining the spectra of every possible isotopologue and then used to extract signals from the mass spectrum. Extraction of peak heights (or peak areas depending on the user’s preference) is performed by either selecting the maximum data point within the target region or by integration. By default, the target regions are at each target m/z value ± 0.5 Da. Probabilities for each isotopologue are then calculated by de-convolving the extracted signals x with the isotopic spectra in the frequency domain (Eq. 1). This is shown in Fig. 3, where the individual contributions of deuterium isotopolouges are extracted and displayed.
| 1 |
Fig. 3.

Mass and isotopologue spectra for C20D28O8Zr. The experimental mass spectra A and calculated isotopic spectra of deuterated C20D28O8Zr B, observed as the adduct [C15D21O6Zr + CH3CN]+. The isotopic spectrum is used as a point-spread-function to de-convolve the individual contribution of each isotopologue from the overlay mass spectra C. These contributions (D15-19) are then used to calculate the percentage deuteration
The percent deuteration is then calculated using Eq. 2, where N is the deuterium count and is the normalised value of for each deuteration state, . The degree of deuteration is determined as the percent of the expected deuterium content taken from the number of deuterium atoms in the inputted molecular formular, not the overall H/D ratio.
| 2 |
In molecules with many deuterium atoms the full spectra (from zero to N deuterium) will cover a large mass range. This exposes the calculation to interferences from contaminants or other, lower mass, adducts. To prevent these interferences, the calculation is cutoff at the lowest deuterium isotopologue where: there are two consecutive isotopologues below 1% probability and the total probability of all valid isotopologues is greater than 10%. The cutoff can also be manually assigned a deuterium count or m/z.
Issues with incorrect mass calibration of the mass spectrometer can be corrected with ease; in this case DGet! will apply a m/z offset (up to a maximum of ± 0.5 Da) to the input data to align it with the predicted spectra.
A web application for DGet! is provided in the form of a Flask module; when using the web application, a report is automatically generated which contains useful information such as overall deuteration level, distribution of partially deuterated isotopologues, and a graphical plot showing the experimental mass spectra overlayed with the predicted isotopic spectra of the target molecule (Additional file 1: Figure S9). An Illustrative guide to the usage of the web application for DGet! has been included in Additional file 1.
Results and discussion
Compound test data was acquired from the Australian National Deuteration Facility (NDF). Each compound was provided with a molecular formula, mass spectral data and previously determined deuteration. Only compounds with clear mass spectra and an existing publication stating the percent deuteration were included. The 20 compounds are listed in Table S1 (Additional file 1) and their spectra are available in Additional file 2.
Compounds from the NDF were analysed using DGet! to compare the calculated percentage deuteration for a representation of commonly available commercial deuterated small molecules in the literature (See additional file 1) from a wide range of classes, molecular weights and deuterium content. The average absolute difference in the reported and calculated deuteration levels for the 20 compared compounds was 0.4 ± 0.3%. These errors demonstrate the ability of DGet! to produce deuterium levels that are in excellent agreement with those previously generated using manual methods. The isotopic distribution was available for 14 compounds and compared to those retrieved using the software (Fig. 4). The average absolute error for the recovery of individual isotopologues was 2 ± 3% when using DGet! It is not clear if this represents an error or improvement over traditional methods as the methods for calculation of these states, including if isotopic interferences from 13C and other isotopes were accounted for, was not always available.
Fig. 4.

Comparison of deuterium isotopologue makeup. Mass spectra for NDF compounds with published isotopologue makeups were processed using DGet! and compared. In general, there was good agreement between the software and publications
For molecules with complicated isotopic spectra, de-convolution improves the accuracy of both individual deuterium isotopologue and overall deuteration percentage. To demonstrate this hydrogen isotope exchange simulations (using Additional File 3) were performed on C6D14 and C6D13Br, with a rate ratio of 2.18 and to a final overall deuteration of 60% [34]. In Fig. 5, the isotopic distribution due to 13C isotopes has a small impact on the calculation of overall deuteration and both raw peak heights and de-convolution gave accurate results (60%) for C6D14 and recovery of the individual isotopologues was within 0.1%. However, once a more complicated spectra is introduced in C6D13Br, only the de-convolution is accurate. The 79Br and 81Br isotopes overlap with the deuterium spectra, shifting the apparent contributions of isotopologues and giving an apparent deuteration of 65% without de-convolution. This inaccuracy is apparent in the recovery of individual isotopologues, with a 4% error in the recovery of D13 when de-convolution is not used, more than double the true value.
Fig. 5.

Recovery of isotopologues with and without de-convolution. The recovery of isotopologues for C6D14 is successful even without de-convolution. However, there is a large overestimation of highly deuterated isotopologues for C6D13Br when the additional Br isotopes are not compensated for
Conclusion
An open-source Python package was developed to address the limitations of existing deuteration calculation techniques. DGet! provides users with a simple interface in the form of command line and graphical web applications to quantify the degree of deuterium incorporation in deuterium enriched molecules using mass spectrometry data. Re-analysis of data using the new technique produced an equivalent deuterium content and distribution of isotopologues for previously reported compounds. The improved characterisation of molecules with multi-isotopic elements was demonstrated using simulations of C6D13Br and the analysis of C20D28O8Zr. The ease-of-use, configurability, and ability to be deployed anywhere will facilitate the adoption of the software into established deuterium enrichment calculation workflows, improving the interpretation of MS data, and advancing the field of deuteration chemistry.
Supplementary Information
Additional file 1: NDF compounds list and webapp tutorial. Table of NDF compounds, molecular formulas and adducts used to validate DGet! An illustrative example of data processing using the DGet! web application.
Additional file 2: NDF mass spectra. Mass spectra of the NDF compounds used to validate DGet and the program parameters (formula, adduct, cutoff) used. Mass spectra of the cholesterol compounds used in Figure 1 and the webapp tutorial (Additional file 1).
Additional file 3: Python script used to determine theoretical makeup.
Acknowledgements
The authors gratefully acknowledge the ANSTO National Deuteration Facility (partly supported by the National Collaborative Research Infrastructure Strategy) for access to mass spectroscopic data and deuterated molecules available as Additional file 2, 3. We gratefully acknowledge Dr Marina Cagnes for providing high purity cholesterol-d45 for analysis and comparisons to cholesterol-H.
Author contributions
Data collection was performed by AA and software design by TEL. All authors contributed to conceptualisation, creation and editing of the manuscript.
Funding
The National Deuteration Facility is partly supported by the National Collaborative Research Infrastructure Strategy—an initiative of the Australian Government.
Availability of data and materials
The dataset supporting the conclusions of the article are included within the article and its additional files.
Declarations
Competing interests
There are no competing interests to declare.
Footnotes
Publisher's Note
Springer Nature remains neutral with regard to jurisdictional claims in published maps and institutional affiliations.
References
- 1.Grochala W. First there was hydrogen. Nat Chem. 2015;7:264–264. doi: 10.1038/nchem.2186. [DOI] [PubMed] [Google Scholar]
- 2.Lecomte M, Lahboubi M, Thilmany P, et al. A general, versatile and divergent synthesis of selectively deuterated amines. Chem Sci. 2021;12:11157–11165. doi: 10.1039/D1SC02622D. [DOI] [PMC free article] [PubMed] [Google Scholar]
- 3.Yang J. Chapter 4—applications in organic chemistry. In: Yang J, editor. Deuterium. Amsterdam: Elsevier; 2016. pp. 31–97. [Google Scholar]
- 4.Sears VF. Neutron scattering lengths and cross sections. Neutron News. 1992;3:26–37. doi: 10.1080/10448639208218770. [DOI] [Google Scholar]
- 5.Duff AP, Cagnes M, Darwish TA, et al. Chapter three—deuteration for biological SANS: case studies, success and challenges in chemistry and biology. In: Tainer JA, et al., editors. Methods in Enzymology. Berlin: Academic Press; 2022. pp. 85–126. [DOI] [PubMed] [Google Scholar]
- 6.Milogrodzka I, Nguyen Pham DT, Sama GR, et al. Effect of cholesterol on biomimetic membrane curvature and coronavirus fusion peptide encapsulation. ACS Nano. 2023;17:8598–8612. doi: 10.1021/acsnano.3c01095. [DOI] [PubMed] [Google Scholar]
- 7.Rousset E, Piccardo M, Gable RW, et al. Elucidation of LMCT excited states for lanthanoid complexes: a theoretical and solid-state experimental framework. Inorg Chem. 2022;61:14004–14018. doi: 10.1021/acs.inorgchem.2c01985. [DOI] [PubMed] [Google Scholar]
- 8.Paracini N, Gutfreund P, Welbourn R, et al. Structural characterization of nanoparticle-supported lipid bilayer arrays by grazing incidence X-ray and neutron scattering. ACS Appl Mater Interf. 2023;15:3772–3780. doi: 10.1021/acsami.2c18956. [DOI] [PMC free article] [PubMed] [Google Scholar]
- 9.Reddy AB, Pilkington GA, Rutland MW, Glavatskih S. Tribotronic control of an ionic boundary layer in operando extends the limits of lubrication. Sci Rep. 2022;12:20479. doi: 10.1038/s41598-022-22504-6. [DOI] [PMC free article] [PubMed] [Google Scholar]
- 10.Separovic F, Hofferek V, Duff AP, et al. In-cell DNP NMR reveals multiple targeting effect of antimicrobial peptide. J Struct Biol X. 2022;6:100074. doi: 10.1016/j.yjsbx.2022.100074. [DOI] [PMC free article] [PubMed] [Google Scholar]
- 11.Dunstan MA, Cagnes M, Phonsri W, et al. Magnetic properties and neutron spectroscopy of lanthanoid-{tetrabromocatecholate/18-crown-6} single-molecule magnets. Aust J Chem. 2022;75:595–609. doi: 10.1071/CH21306. [DOI] [Google Scholar]
- 12.Conn CE, Campo L, de Whitten AE, et al. Membrane protein structures in lipid bilayers frontiers in chemistry small-angle neutron scattering with contrast-matched bicontinuous cubic phase. Front Chem. 2021 doi: 10.3389/fchem.2020.619470. [DOI] [PMC free article] [PubMed] [Google Scholar]
- 13.Hossain KR, Turkewitz DR, Holt SA, et al. Sterol structural features’ impact on the spontaneous membrane insertion of CLIC1 into artificial lipid membranes. Langmuir. 2023;39:3286–3300. doi: 10.1021/acs.langmuir.2c03129. [DOI] [PubMed] [Google Scholar]
- 14.Santamaria A, Batchu KC, Fragneto G, et al. Investigation on the relationship between lipid composition and structure in model membranes composed of extracted natural phospholipids. J Colloid Interf Sci. 2023;637:55–66. doi: 10.1016/j.jcis.2023.01.043. [DOI] [PubMed] [Google Scholar]
- 15.Luchini A, Micciulla S, Corucci G, et al. Lipid bilayer degradation induced by SARS-CoV-2 spike protein as revealed by neutron reflectometry. Sci Rep. 2021;11:14867. doi: 10.1038/s41598-021-93996-x. [DOI] [PMC free article] [PubMed] [Google Scholar]
- 16.Klenner MA, Pascali G, Fraser BH, Darwish TA. Kinetic isotope effects and synthetic strategies for deuterated carbon-11 and fluorine-18 labelled PET radiopharmaceuticals. Nucl Med Biol. 2021;96–97:112–147. doi: 10.1016/j.nucmedbio.2021.03.011. [DOI] [PubMed] [Google Scholar]
- 17.Moir M, Yepuri NR, Marshall DL, et al. Synthesis of perdeuterated linoleic acid-d31 and chain deuterated 1-palmitoyl-2-linoleoyl-sn-glycero-3-phosphocholine-d62. Adv Synth Catal. 2022;364:3670–3681. doi: 10.1002/adsc.202200616. [DOI] [Google Scholar]
- 18.Wang DH, Vidovic D, McKay AI, et al. Quantitative high-field NMR—and mass spectrometry-based fatty acid sequencing reveals internal structure in ru-catalyzed deuteration of docosahexaenoic acid. Anal Chem. 2022;94:12971–12980. doi: 10.1021/acs.analchem.2c00923. [DOI] [PubMed] [Google Scholar]
- 19.van Heyningen WE, Rittenberg D, Schoenheimer R. The preparation of fatty acids containing deuterium. J Biol Chem. 1938;125:495–500. doi: 10.1016/S0021-9258(18)73943-4. [DOI] [Google Scholar]
- 20.Akutsu-Suyama K, Park K, Takakura R, et al (2021) Metal Catalyzed H?D exchange methods using D2O as a deuterium source: a comparative study in different sealed devices. In: Proceedings of the 3rd J-PARC Symposium (J-PARC2019). Journal of the Physical Society of Japan.
- 21.Klenner MA, Cagnes M, Wood K, et al. Decagram scale production of deuterated mineral oil and polydecene as solvents for polymer studies in neutron scattering. Polym Chem. 2020;11:4986–4994. doi: 10.1039/D0PY00690D. [DOI] [Google Scholar]
- 22.Sawama Y, Monguchi Y, Sajiki H. Efficient H-D exchange reactions using heterogeneous platinum-group metal on carbon–H2–D2O system. Synlett. 2012;23:959–972. doi: 10.1055/s-0031-1289696. [DOI] [Google Scholar]
- 23.Atzrodt J, Derdau V, Fey T, Zimmermann J. The renaissance of H/D exchange. Angew Chem Int Ed. 2007;46:7744–7765. doi: 10.1002/anie.200700039. [DOI] [PubMed] [Google Scholar]
- 24.Recsei C, Russell RA, Cagnes M, Darwish T. Deuterated squalene and sterols from modified Saccharomyces cerevisiae. Org Biomol Chem. 2023;21:6537–6548. doi: 10.1039/D3OB00754E. [DOI] [PubMed] [Google Scholar]
- 25.Waldie S, Moulin M, Porcar L, et al. The production of matchout-deuterated cholesterol and the study of bilayer-cholesterol interactions. Sci Rep. 2019;9:5118. doi: 10.1038/s41598-019-41439-z. [DOI] [PMC free article] [PubMed] [Google Scholar]
- 26.Lau S, Middleton DA. Analysis of the orientation of cholesterol in high-density lipoprotein nanodiscs using solid-state NMR. Phys Chem Chem Phys. 2022;24:23651–23660. doi: 10.1039/d2cp02393h. [DOI] [PMC free article] [PubMed] [Google Scholar]
- 27.Darwish TA, Yepuri NR, Holden PJ, James M. Quantitative analysis of deuterium using the isotopic effect on quaternary 13C NMR chemical shifts. Anal Chim Acta. 2016;927:89–98. doi: 10.1016/j.aca.2016.05.003. [DOI] [PubMed] [Google Scholar]
- 28.Darwish TA, Smith ARG, Gentle IR, et al. Deuteration of molecules for neutron reflectometry on organic light-emitting diode thin films. Tetrahedron Lett. 2012;53:931–935. doi: 10.1016/j.tetlet.2011.12.032. [DOI] [Google Scholar]
- 29.Baldwin JE, Kiemle DJ, Kostikov AP. Quantitative analyses of Stereoisomeric 3,4–d2-cyclohexenes in the presence of 3,6–d2-cyclohexenes. J Org Chem. 2009;74:3866–3874. doi: 10.1021/jo900430w. [DOI] [PubMed] [Google Scholar]
- 30.Baldwin JE, Kiemle DJ, Kostikov AP. Quantitative analyses of mixtures of 2-deuterio-1-vinylcyclobutanes. J Org Chem. 2009;74:7866–7872. doi: 10.1021/jo901663v. [DOI] [PubMed] [Google Scholar]
- 31.Hotchko M, Anand GS, Komives EA, Ten Eyck LF. Automated extraction of backbone deuteration levels from amide H/ 2 H mass spectrometry experiments. Protein Sci. 2006;15:583–601. doi: 10.1110/ps.051774906. [DOI] [PMC free article] [PubMed] [Google Scholar]
- 32.Cupp-Sutton KA, Welborn T, Fang M, et al. The deuterium calculator: an open-source tool for hydrogen-deuterium exchange mass spectrometry analysis. J Proteome Res. 2023;22:532–538. doi: 10.1021/acs.jproteome.2c00558. [DOI] [PMC free article] [PubMed] [Google Scholar]
- 33.Blumer MR, Chang CH, Brayfindley E, et al. Mass spectrometry adduct calculator. J Chem Inf Model. 2021;61:5721–5725. doi: 10.1021/acs.jcim.1c00579. [DOI] [PMC free article] [PubMed] [Google Scholar]
- 34.Bolder H. Kinetics and distribution in hydrogen isotope exchange and redistribution. J Catal. 1964;3:312–340. doi: 10.1016/0021-9517(64)90037-5. [DOI] [Google Scholar]
Associated Data
This section collects any data citations, data availability statements, or supplementary materials included in this article.
Supplementary Materials
Additional file 1: NDF compounds list and webapp tutorial. Table of NDF compounds, molecular formulas and adducts used to validate DGet! An illustrative example of data processing using the DGet! web application.
Additional file 2: NDF mass spectra. Mass spectra of the NDF compounds used to validate DGet and the program parameters (formula, adduct, cutoff) used. Mass spectra of the cholesterol compounds used in Figure 1 and the webapp tutorial (Additional file 1).
Additional file 3: Python script used to determine theoretical makeup.
Data Availability Statement
The dataset supporting the conclusions of the article are included within the article and its additional files.