Abstract
We herein introduce voyAGEr, an online graphical interface to explore age-related gene expression alterations in 49 human tissues. voyAGEr offers a visualisation and statistical toolkit for the finding and functional exploration of sex- and tissue-specific transcriptomic changes with age. In its conception, we developed a novel bioinformatics pipeline leveraging RNA sequencing data, from the GTEx project, encompassing more than 900 individuals. voyAGEr reveals transcriptomic signatures of the known asynchronous ageing between tissues, allowing the observation of tissue-specific age periods of major transcriptional changes, associated with alterations in different biological pathways, cellular composition, and disease conditions. Notably, voyAGEr was created to assist researchers with no expertise in bioinformatics, providing a supportive framework for elaborating, testing and refining their hypotheses on the molecular nature of human ageing and its association with pathologies, thereby also aiding in the discovery of novel therapeutic targets. voyAGEr is freely available at https://compbio.imm.medicina.ulisboa.pt/app/voyAGEr.
Research organism: Human
Introduction
The ageing-associated progressive loss of proper tissue homeostasis maintenance makes age a prevalent risk factor for many human pathologies, including cancer, neurodegenerative, and cardiovascular diseases (Campisi, 2013; Niccoli and Partridge, 2012; Wyss-Coray, 2016). A better comprehension of the molecular mechanisms of human ageing is thus required for the development and effective application of therapies targeting its associated morbidities.
Dynamic transcriptional alterations accompany most physiological processes occurring in human tissues (López-Otín et al., 2013). Transcriptomic analyses of tissue samples can thus provide snapshots of cellular states therein and insights into how their modifications over time impact tissue physiology. A small proportion of transcripts has indeed been shown to vary with age in tissue (Stegeman and Weake, 2017) and sex-specific (Tower, 2017; Austad and Fischer, 2016; Melé et al., 2015; Gershoni and Pietrokovski, 2017; Kassam et al., 2019; Mayne et al., 2016) manners. Such variations reflect dysregulations of gene expression that underlie cellular dysfunctions (Stegeman and Weake, 2017).
Many studies analysed the age-related changes in gene expression in rodent tissues (Zahn et al., 2007; Kimmel et al., 2019; Benayoun et al., 2019; Lui et al., 2010; Shavlakadze et al., 2019; Almanzar et al., 2020; Schaum et al., 2020), emphasising the role in ageing of genes related to inflammatory responses, cell cycle, or the electron transport chain. However, while it is possible to monitor the modifications in gene expression over time in those species by sequencing transcriptomes of organs of littermates at different ages, as a close surrogate of longitudinality, such studies cannot be conducted in humans for ethical reasons. Indeed, most studies aimed at profiling ageing-related gene expression changes in human tissues focused on a single tissue (e.g. muscle Zahn et al., 2005; Welle et al., 2003; Jozsi et al., 2000, kidney Rodwell et al., 2004, brain Galatro et al., 2017; Olah et al., 2018; Berchtold et al., 2008; Lu et al., 2004; Işıldak et al., 2020, skin Haustead et al., 2016; Holzscheck et al., 2020, blood Nakamura et al., 2012; Harries et al., 2011, liver Thomas et al., 2002, retina Yoshida et al., 2002) and/or are limited to a comparison between young and old individuals (Welle et al., 2003; Jozsi et al., 2000; Haustead et al., 2016; Thomas et al., 2002; Yoshida et al., 2002), failing to fully capture the changes of the tissue-specific gene expression landscape throughout ageing (Stegeman and Weake, 2017). A few studies were nonetheless led on more than one tissue in humans, from post-mortem samples (Gheorghe et al., 2014; Yang et al., 2015) and biopsies (Aramillo Irizar et al., 2018; Glass et al., 2013), and in mice (Schaum et al., 2020; Aramillo Irizar et al., 2018) and rats (Yu et al., 2014). The age-related transcriptional profiles derived therein, either from regression (Schaum et al., 2020; Gheorghe et al., 2014; Yang et al., 2015; Glass et al., 2013) or comparison between age groups (Aramillo Irizar et al., 2018; Yu et al., 2014), highlight an asynchronous ageing of tissues (discussed in Rando and Wyss-Coray, 2021), with some of them more affected by age-related gene expression changes associated with biological mechanisms known to be impacted by ageing such as mitochondrial activity or metabolic homeostasis. In particular, tissue-specific periods of major transcriptional changes in the fifth and eighth decades of the human lifespan have been revealed (Gheorghe et al., 2014), reflecting the so-called digital ageing (Rando and Wyss-Coray, 2021), consistent with what is observed in mice (Almanzar et al., 2020; Schaum et al., 2020). Furthermore, despite outlining the tissue specificity of the transcriptomic signatures of human ageing, some synchronisation was found between tissues like the lung, heart, and whole blood, which exhibit a co-ageing pattern (Yang et al., 2015). Nevertheless, as each study followed its own specific procedures, from sample collection to data processing, results from these analyses are hard to compare with one another.
Processed data from those studies have not been made easily accessible and interpretable to researchers lacking computational proficiency but aiming to use them to test their novel hypotheses. To fill this void, we have developed voyAGEr, a web application providing flexible visualisation of comprehensive functional analyses of gene expression alterations occurring in 49 human tissues with age in each biological sex. We leverage the large RNA-seq dataset from the Genotype-Tissue Expression (GTEx) project (Lonsdale et al., 2013), encompassing tissue samples from hundreds of donors aged from 20 to 70 years, with a pipeline for gene expression profiling with an optimised temporal resolution. voyAGEr allows us to investigate ageing from two perspectives: (i) gene-centric – how each gene’s tissue-specific expression progresses with age; and (ii) tissue-centric – how tissue-specific transcriptomes change with age. Additionally, voyAGEr enables the examination of modules of co-expressed genes altered with age in four tissues (brain cortex, skeletal muscle, left ventricle of the heart, whole blood), namely their enrichment in specific cell types, biological pathways, and association with diseases. We, therefore, expect voyAGEr to become a valuable support tool for researchers aiming to uncover the molecular mechanisms underlying human ageing. Moreover, being open-source, voyAGEr can be adapted by fellow developers to be used with alternative datasets (e.g. from other species) or to incorporate other specific functionalities.
voyAGEr is freely available at https://compbio.imm.medicina.ulisboa.pt/app/voyAGEr.
Results
voyAGEr’s interactive exploration of tissue-specific gene expression landscapes in ageing is based on sequential fitting of linear models (v. Methods) to estimate, for each gene in each tissue:
the Age effect, i.e., how the age-associated changes in gene expression evolve with age itself;
the Sex effect, i.e., how the differences in gene expression between sexes evolve with age;
the Age&Sex interaction effect, i.e., how the differences between sexes of age-associated changes in gene expression evolve with age.
We named our approach Shifting Age Range Pipeline for Linear Modelling (ShARP-LM). Briefly, this method consists of performing differential gene expression (with gene expression as a function of the donors’ Age, Sex, and Age&Sex interaction) in moving age windows spanning 16 years. By considering the percentage of genes altered in each age range, we can highlight age periods of major tissue-specific transcriptomic alterations (Figure 1).
Figure 1. voyAGEr profiles tissue-specific age-associated changes in gene expression and their differences between sexes.
For each of the 49 human tissues in genotype-tissue expression (GTEx), gene expression was linearly modelled in windows spanning 16 years centered in consecutive years of age, to estimate the effects thereon of Age, Sex, and the interaction between them, i.e., how the Sex effect changes with age, equivalent to how the Age effect differs between sexes (v. Methods). In each age window, the percentage of genes with expression significantly altered by each of those effects gives their respective transcriptomic impact (upper panels). voyAGEr thereby identifies the age periods at which major gene expression changes occur in each tissue. For example, in coronary artery: major age-related transcriptional alterations are found at around 60 years of age (upper left panel), illustrated by the behaviour of COX11 (bottom left panel); major gene expression differences between males and females happen across the considered age range (upper centre panel), as illustrated by CD99 (bottom centre panel); major differences between sexes in age-related gene expression alterations happen across the considered age range (upper right panel), as illustrated by AKT2 (bottom right panel). Solid loess lines in the bottom panels (green for all donors, pink for females, blue for males). Gene expression (GE) in log2 of counts per million (logCPM).

Figure 1—figure supplement 1. Impact of donor overlap between tissues in age-associated trends.

Figure 1—figure supplement 2. Batch effect correction applied to lung samples.

Figure 1—figure supplement 3. Principle of the Shifting Age Range Pipeline for Linear Modelling (ShARP-LM) method.

Gene-centric analyses of human tissue-specific expression changes across age
The progression of tissue-specific expression of a particular gene across age can be examined in voyAGEr’s Gene tab. By entering its HGNC symbol in the Gene selector, the user has access to graphical summaries of the gene’s tissue-specific expression (sub-tab Profile) (Figure 2A) and the significance of age-related changes in its expression due to the Age, Sex, and Age&Sex effects (sub-tab Alteration) (Figure 2B) across age. Results can be displayed in a heatmap for all tissues or in a scatter plot for a chosen individual tissue (Figure 2C). When the gene is studied in a single tissue, the user can graphically and statistically profile the association of the donors’ sex and reported conditions (e.g. history of heart attack or pneumonia) with the gene’s expression profile. A table summarizing the donors’ metadata is also shown (Figure 2C). The user can interactively select donors of interest on the scatter plot and further examine their information in the automatically subsetted table.
Figure 2. Gene-centric analyses of expression alterations across age.
(A) Heatmap of MKI67 expression across tissues over age. (B) Heatmap of the significance of Age-associated MKI67 expression alterations over age. p-values are for the moderated t-statistics of differential gene expression associated with the Age effect (v. the ShARP-LM approach in Methods). Notably, transcriptional changes are observed in the lung (mid 20’s, early 30’s, and after 55). (C) - voyAGEr’s Gene tab interface. MKI67 expression in the lung is inspected. Donors’ information is shown in a table and the scatter plot can be interactively adjusted according to the donors’ condition of interest (Figure 2—figure supplement 1B ).

Figure 2—figure supplement 1. voyAGEr’s Gene tab interface.

Figure 2—figure supplement 2. Sex-specific SALL1 and DDX43 expression alterations over age.

Figure 2—figure supplement 3. Impact of sex-specific genes in the interpretation of voyAGEr results.

Figure 2—figure supplement 4. Effects of batch effect correction on gene-centric (SFTPA2) analysis.

An example of a process whose molecular mechanisms are of particular interest to researchers in the ageing field is cellular senescence. Senescence is a stress-induced cell cycle arrest limiting the proliferation of potentially oncogenic cells but progressively creating an inflammatory environment in tissues as they age (van Deursen, 2014; Gorgoulis et al., 2019. CDKN2A, that encodes cell cycle regulatory protein p16INK4A known to accumulate in senescent cells Gil and Peters, 2006; Erickson et al., 1998), has its expression increased with age in the vast majority of tissues profiled (Figure 2—figure supplement 1A ). Similarly, reduced levels of proliferation markers, such as PCNA (Narita et al., 2003) and MKI67 (Sun and Kaufman, 2018), can be studied as putative markers of ageing of certain tissues. These genes have their expression altered with age in the lung and display a similar expression profile (decreasing from 25 to 30 years old, constant between 35 and 50 years old and decreasing in older ages) (Figure 2C). However, these trends appear to vary according to the donor’s history of non-metastatic cancer (Figure 2—figure supplement 1B), illustrating voyAGEr’s use in helping to find associations between gene expression and age-related diseases.
On a different note, sex biases have been reported in the expression of SALL1 and DDX43 in adipose tissue and lung, respectively (Kassam et al., 2019). voyAGEr allows us to not only recapitulate those observations but also assess the temporal window where these changes occur (Figure 2—figure supplement 2).
Tissue-specific assessment of gene expression changes across age
Peaks of gene expression alterations
The landscape of global tissue-specific gene expression alteration across age can be examined in voyAGEr’s Tissue main tab. A heatmap displaying, for all tissues, the statistical significance over age (v. Methods) of the proportion of genes altered with Age, Sex, or Age&Sex (depending on the user’s interest) is initially shown (Figure 3A), illustrating the aforementioned asynchronous ageing of tissues observed for humans and rodents (Schaum et al., 2020; Thomas et al., 2002; Yoshida et al., 2002; Gheorghe et al., 2014; Yang et al., 2015; Aramillo Irizar et al., 2018; Rando and Wyss-Coray, 2021).
Figure 3. Tissue-specific assessment of gene expression changes across age.
(A) Heatmap of significance (false discovery rate, FDR, based on random permutations of age, v. Methods) over the age of the proportion of genes with expression significantly altered with Age in the 49 analysed tissues. (B) Exploration of gene expression changes across age in Subcutaneous Adipose tissue: (a) Percentage of genes with significantly altered expression with Age over age. Two main peaks of transcriptional changes are noteworthy, a major one in the late 20s and a minor one after 45; (b) Clicking on the dot of a specific age (29.57 years old in plot a) gives access to the list of the most altered genes at that age, ordered by statistical significance of expression changes (p-value of moderated t-statistic). (c) Plot of expression of the chosen top gene in the table in b across age (bottom) in parallel with the significance of its expression alterations with Age. The expression of LMO3 significantly increases at around 30 years old, concomitantly with the first peak of transcriptomic changes with Age.

Figure 3—figure supplement 1. Transcriptomic alterations in the uterus coincident with the onset of menopause.

Figure 3—figure supplement 2. Tissue-specific sex-differentiated expression.

Figure 3—figure supplement 3. Distributions of genotype-tissue expression (GTEx) donors’ ages and its impact on the statistical power of detection of differential gene expression.

Figure 3—figure supplement 4. Effect of downsampling in Shifting Age Range Pipeline for Linear Modelling (ShARP-LM) results.

The user can then spot the age periods with the most significant gene expression alterations in a selected tissue (Figure 3B, a), and identify the associated altered genes (Figure 3b). The user can also plot the expression of a given gene of interest across ages together with the significance of its expression modification with Age, Sex, or Age&Sex (Figure 3B, c).
An example of voyAGEr’s capabilities is illustrated in Figure 1—figure supplement 1, showing substantial transcriptomic alterations in the uterus from the late forties to the early fifties, overlapping with the age distribution of menopausal onset (Kaczmarek, 2014), which could explain the observed molecular modifications.
It is also possible to visualise tissues with more than one period of transcriptomic changes, and to individually inspect these periods. As an example, the subcutaneous adipose tissue appears to go through two main periods of transcriptional changes with age: a major one at the late 20s (~13% of altered genes), and a minor one after 45 years (~5% of altered genes) (Figure 3B, A). The most altered genes in this first peak appear to have their expression modified only at this precise age period (e.g. PRELID1, RUNX1T1, TUBB4B, FGFRL1, and MALSU1). Similarly, mitochondrial genes (e.g. MT-CYB, MT-ND4, MT-ATP6, MT-ND2) (Figure 3B) appear to be the most altered genes in the second peak (Figure 3B, C). This particularity suggests that different sets of genes drive the periods of major transcriptional changes, which begs to assess if they reflect the activation of distinct biological processes.
Gene set enrichment
The user can explore the biological functions of the set of genes underlying each peak of transcriptomic changes by assessing their enrichment in curated pathways from the Reactome database (Croft et al., 2014). voyAGEr performs Gene Set Enrichment Analysis (GSEA) (Subramanian et al., 2005) and the user can visualise heatmaps displaying the evolution over the age of the resulting normalised enrichment score (NES Subramanian et al., 2005, reflecting the degree to which a pathway is over- or under-represented in a subset of genes) for a given tissue, effect (Age, Sex, or Age&Sex) and Reactome pathway (all, or user-selected) (Figure 4A). To reduce redundancy and facilitate the understanding of their biological relevance, we clustered those pathways into families that also include Kyoto Encyclopedia of Genes and Genomes (KEGG) pathways (Kanehisa and Goto, 2000) and Gene Ontology (GO) Biological Processes of level 3 (Gene Ontology Consortium, 2004). Briefly, we clustered gene sets from the three sources based on the overlap of their genes (v. Methods), thereby creating families of highly functionally related pathways. Taking advantage of the complementary and distinct terminology in Reactome, KEGG, and GO, the user can interpret each family’s broad biological function by looking at the word cloud of its most prevalent terms, and browsing the list of its associated pathways (Figure 4A). For example, although most pathways enriched in the two aforementioned peaks of altered genes in subcutaneous adipose tissue were different, there is an overlap of pathways related to metabolism, including various mitochondrial processes (Figure 4A). This highlights the importance of integrating individual gene data with pathway enrichment analysis to garner more comprehensive insights into the biological relevance of those changes.
Figure 4. Tissue-specific assessment of pathway expression changes across age in the human Subcutaneous Adipose tissue.
(A) Heatmap depicting the normalised enrichment scores (NES) of Reactome pathways associated with specific tissues and effects. Pathways are classified into 10 families (a), which can be characterised by their frequently occurring terms (b), providing insights into their biological functions. Only pathways significantly linked to gene expression changes in at least one age window (FDR ≤ 0.01) are displayed. Black squares indicate the two age periods with prominent transcriptional changes, while yellow squares denote pathways common to both peaks, primarily belonging to family 2. Word cloud analysis (b) reveals that family 2 pathways are mainly related to metabolism. (B) Enrichment of a user-provided gene set, given by the significance of Fisher’s tests, in genes altered with Age throughout ageing (based on a user-defined p-value threshold). Here, the given gene set is composed of genes from Senequest Gorgoulis et al., 2019 whose link with senescence is supported by at least four sources. In this case, there are no significant peaks.

Figure 4—figure supplement 1. Clustering of pathways from Reactome and Kyoto Encyclopedia of Genes and Genomes (KEGG), and level 3 Gene Ontology Biological Processes.

The peaks of transcriptomic changes can also be examined for enrichment in a user-provided gene set (Figure 4B). As expression of senescence-related CDKN2A is increased in the subcutaneous adipose tissue with age (Figure 2—figure supplement 1A), we hypothesised that other senescence-associated genes may be augmented too. Thus we used that voyAGEr functionality, using the Senequest (Gorgoulis et al., 2019) geneset (supported by at least four sources) to test it, observing no significant alterations (Figure 4B).
Modules of co-expressed genes
voyAGEr also allows functional analyses of modules of co-expressed genes i.e. genes with highly correlated expression across samples, defined by weighted correlation network analysis (Langfelder and Horvath, 2008). Genes in the same module are likely to be co-regulated and share biological functions or associations with phenotypical or pathological traits (van Dam et al., 2017). Those modules may also act as markers of core transcriptional features of cellular activity and identity (Kelley et al., 2018).
Concretely, voyAGEr enables the user to visualise how the expression of modules of genes that are associated with a specific cell type, biological pathway, or disease progresses over age in a specific tissue. After selecting one tissue of interest, the user has, for each module, access to four levels of information:
Expression: its eigengene expression progression over age (Figure 5C);
Cell types: its enrichment in specific cell types, based on cell type signatures found in the literature (Figure 5C);
Pathways: its enrichment in Reactome pathways;
Diseases: its enrichment in disease markers, based on gene-disease associations from DisGeNET (Piñero et al., 2019; Piñero et al., 2017), calculated with both the disgenet2r package (Piñero et al., 2019) and with Fisher’s tests (Figure 5B).
Figure 5. Tissue-specific assessment of age-associated progression of modules of co-expressed genes.

(A) Heatmap of eigengene expression for all the modules of co-expressed genes in the brain cortex over age. (B) Heatmap of association of the modules with four selected diseases, computed with the disgenet2r package (Piñero et al., 2019). (C) Scatter plot (above) of eigengene expression over age, in all brain cortex samples, for a selected module of 241 genes (MEblue). The eigengene expression is derived from the first component of the single value decomposition of its genes’ expression. This module was analysed, with Fisher’s tests, for enrichment in cell types, based on markers from the literature (Fan et al., 2018 and Descartes Cao et al., 2020) and found to be associated with astrocytes, as can be observed by the TreeMap below (where each rectangle’s area and darkness are proportional to the significance of its association with a cell type and its colour linked to the markers’ source study).
By default, for each tissue, results are displayed in the form of heatmaps of expression (centered and scaled) illustrating how all modules evolve with age (Figure 5A). The user also has the possibility to select a module of interest and see its eigengene progression over age in a scatter plot (Figure 5C), lists of its association with diseases and pathways ordered by significance, and a TreeMap for its cell type enrichments (Figure 5C). In the example of Figure 5C, the ‘MEblue’ module, comprising 241 genes co-expressed in the brain cortex, shows significant enrichment in astrocyte markers. The apparent increase of this module’s expression with age may reflect the known age-related changes in astrocyte activation (Palmer and Ousman, 2018) and the relative weakening of neuronal activity (‘MEyellow’ and ‘MEpink’ modules).
As in the Gene tab, the user can separate donors based on their sex and associated medical conditions in the scatter plot of the eigengene expression progression. On the Pathways and Diseases-Manual tabs below the main plot, the user can also visualise the contingency table from that specific disease/pathway, on the corresponding column.
Discussion
voyAGEr provides a framework to examine the progression of gene expression over age in several human tissues, serving as a valuable resource for the ageing research community. In particular, it helps to identify tissue-specific age periods of major transcriptomic alterations. The results of our analyses show the complexity of human biological ageing by stressing its tissue specificity (Gheorghe et al., 2014) and non-linear transcriptional progression throughout the lifetime, consistent with previous results from both proteomic (Lehallier et al., 2019) and transcriptomic (Haustead et al., 2016; Gheorghe et al., 2014) analyses. By revealing and annotating the age-specific transcriptional trends in each tissue, voyAGEr aims to assist researchers in deciphering the cellular and molecular mechanisms associated with the age-related physiological decline across the human body.
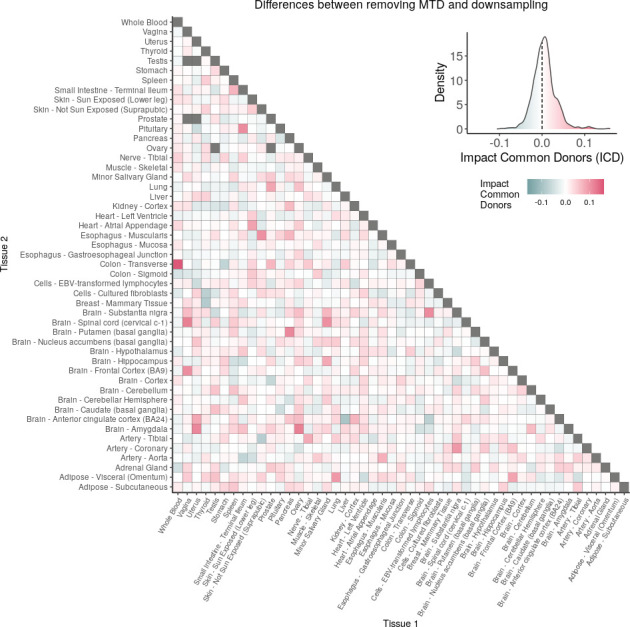
Due to the tissue-specific nature of the pre-processing steps (v. Read count data pre-processing in the Methods section), and given that most of the plotted gene expression distributions are centered and scaled by tissue, it is important to note that voyAGEr may not be always suited for direct comparisons between different tissues. For instance, it does not allow us to directly ascertain if a gene exhibits different expression levels in different tissues or if the expression of a particular gene in one tissue changes more drastically with age than in another tissue. Furthermore, we must emphasise that the majority of GTEx donors contributed samples to multiple tissues (Figure 1—figure supplement 1 ), potentially introducing biases and confounders when comparing gene expression patterns between tissues. Our analyses of variance (Figure 1—figure supplement 1B ) and downsampling to control for common donors (Figure 1—figure supplement 1C-E) suggest very limited global confounding between the impacts of donor and age on gene expression and that any potential cross-tissue bias not to depend much on the proportion of common donors (Figure 1—figure supplement 1E). However, this effect must be taken into account when comparing specific pairs of tissues (e.g. Colon – Transverse and Whole Blood, Figure 1—figure supplement 1D).
Additionally, voyAGEr allows us to scrutinise and visually display the tissue-specific differences in gene expression between biological sexes across ages. Biological sex is an important factor in the prevalence of ageing-associated diseases, as well as their age of onset, progression (Tower, 2017; Austad and Fischer, 2016; Khramtsova et al., 2019), and sex-related differences in gene expression (Melé et al., 2015; Gershoni and Pietrokovski, 2017; Kassam et al., 2019; Mayne et al., 2016). By profiling the age distribution of such differences, voyAGEr can lead to a better understanding of their influence in the aetiology of the sex specificities of human ageing. For instance, we were able to corroborate findings on the sex-differential transcriptome of adult humans by Gershoni and Pietrokovski, 2017, with voyAGEr emphasising its tissue-specificity and allowing to discriminate the ages at which sex-related biases appear to be more prevalent (Figure 3—figure supplement 2).
Nonetheless, it is essential to interpret sex chromosome-specific gene results in voyAGEr with caution. For instance, we observed elevated expression of Y-chromosome-specific DDX3Y in males, whilst its female expression (expected to be zero) is very low, in the range of what can be considered background noise (Figure 2—figure supplement 3). Its age-related alterations exhibit a distinctive peak around the age of 40 apparently driven by subtle changes in gene expression in female samples, illustrating the need for the abovementioned caution.
One of the limitations of voyAGEr is that most GTEx tissue donors had health conditions and their frequency increased with age, preventing us from defining a class of healthy individuals and identifying age-associated transcriptomic changes that could be more confidently proposed to happen independently of any disease progression. Whilst the large sample sizes and inherent biological variability among individuals, reflected in the diversity of condition combinations, are expected to mitigate significant confounding effects, voyAGEr also allows users to evaluate how tissue-specific gene expression trends vary according to the donors’ diverse conditions (see Figure 2—figure supplement 1B).
The development of voyAGEr was accompanied by that of a pipeline, ShARP-LM, that facilitates the holistic depiction of the transcriptional landscapes of adult human tissues throughout ageing with a yearly age resolution. We take advantage of the comprehensiveness of the transcriptome collection from human tissues from the GTEx project to make our analyses a valid surrogate of a currently undoable longitudinal study. It confers our method enough statistical robustness to mitigate the inter-individual differences and deal with the non-uniform distribution of the donors’ ages. Nevertheless, it is worth highlighting that the age distribution of donors does impact the statistical power for detecting transcriptional changes. Consequently, we are more likely to identify significant alterations (with p-value <0.05 in our gene-centric analyses) within age ranges that are more prevalent in our sample population, often characterised by older individuals (Figure 3—figure supplement 3). When downsampling to ensure a balanced age distribution, a loss of statistical power is apparent but a considerable positive correlation with the original results is maintained and a substantial number of significant alterations remain so (Figure 3—figure supplement 4). This limitation is likely to be overcome by the accumulation of transcriptomes of human tissues in public databases, promising a gradual increase in accuracy and age resolution with which human transcriptomic ageing can be profiled. Similarly, the expanding collection of single-cell transcriptomes in public databases is yielding improved gene markers for an increasing diversity of human cell types, enhancing the usefulness of leveraging bulk transcriptomes to study the impact of ageing on the cellular composition of human tissues, for which the co-expression module approach in voyAGEr provides a proof-of-concept.
Nonetheless, it is imperative to approach the module-based analysis with caution, as direct and literal interpretations may be misleading. For instance, it is not uncommon to observe an enrichment of ‘Rheumatoid Arthritis’ in modules associated with various immune cell types in anatomical locations, such as the brain cortex, where the disease does not directly manifest. If a specific module associated with a condition like ‘Liver Cirrhosis’ exhibits an age-related increase in the brain cortex, of course, this does not mean such disease ever occurs within older brains. Nevertheless, we consider that the module-based approach can serve as a valuable resource for generating hypotheses.
Given its open-source nature, voyAGEr is envisaged to be a continually evolving resource, able to accommodate new data and expand its functionalities, namely by incorporating additional tissues into the modules section and integrating perturbagen data for inference of molecular causes underlying observed gene expression alterations and small molecules to target them for therapeutic purposes (Subramanian et al., 2017; Saraiva-Agostinho and de Almeida, 2020).
As an in silico approach with no experimental validation for its results, voyAGEr is meant to be a discovery tool, supporting biologists in the exploration of a large transcriptomic dataset, thereby generating, refining, or preliminary testing hypotheses, laying the groundwork for subsequent experimental research. It can be an entry point for projects aiming at better understanding the tissue- and sex-specific transcriptional alterations underlying human ageing, to be followed by targeted studies focusing on the functional roles of the most promising markers identified therein in the physiology of ageing. Those marker genes can contribute to the development of more robust and cross-tissue gene signatures of ageing (de Magalhães et al., 2009) and the expansion of age-related gene databases (Tacutu et al., 2018; Craig et al., 2015).
Moreover, the observed diverse and asynchronous changes in gene expression between tissues over the human adult life provide potentially relevant information for the design of accurate diagnostic tools and personalised therapies. On one hand, identifying those changes’ association with specific disorders could have a prognostic value by enabling the identification of their onset before clinical symptoms manifest (Aramillo Irizar et al., 2018). On the other hand, computational screening of databases of genetic and pharmacologically induced human transcriptomic changes could help to infer their molecular causes and uncover candidate drugs to delay these effects (Subramanian et al., 2017; Saraiva-Agostinho and de Almeida, 2020; Dönertaş et al., 2018; Janssens et al., 2019).
Methods
Development platforms
Data analysis was performed in R (version 4.1.2) and the application developed with R package Shiny (Chang et al., 2024). voyAGEr’s outputs are plots and tables, generated with R packages highcharter (Kunst, 2022) and DT (Yihui et al., 2024), respectively, that can easily be downloaded in standard formats (png, jpeg, and pdf for the plots; xls and csv for the tables).
voyAGEr was deployed using Docker Compose and ShinyProxy 2.6.1 in a Linux virtual machine (64 GB RAM, 16 CPU threads, and 200 GB SSD) running in our institutional computing cluster.
Read count data pre-processing
The matrix with the RNA-seq read counts for each gene in each GTEx v8 sample was downloaded from the project’s data portal (https://www.gtexportal.org/) (Lonsdale et al., 2013). From the 54 tissues available from GTEx v8, five were discarded (kidney medulla, fallopian tube, bladder, ectocervix, endocervix) due to low (<50) numbers of samples.
Read count data for each tissue were then pre-processed separately. We started by filtering out genes deemed uninformative due to their very low expression across samples: only genes with at least one CPM in at least 40% of the samples were kept for analysis (the number of genes analysed for each tissue can be found in Supplementary file 1; Robinson et al., 2010). Read counts for those kept genes were used to calculate normalisation factors to scale the raw library sizes, using function calcNormFactors from edgeR (Robinson et al., 2010) that implements the trimmed mean of M-values (Robinson and Oshlack, 2010). Read counts were subsequently normalised and log-transformed with the voom function (Law et al., 2014) from package limma (Ritchie et al., 2015).
However, it is well-established that batch effects, which may stem from variations in sample treatment prior to RNA-seq library preparation, can introduce spurious gene expression differences between samples and result in confounding factors (García-Pérez et al., 2023). We, therefore, conducted an impartial and systematic search for potential batch effects. Firstly, we performed a principal component analysis of gene expression for each tissue, using the prcomp package. We quantified the relation between each condition associated with every sample [According to the annotated variables for the dbGaP Study Accession phs000424.v8.p2] and the first two principal components, by computing Spearman correlations (for numerical conditions), t-tests (for binary categorical conditions), or analysis of variance (ANOVA) tests (for variables with more than two possible values, and, in the case of numerical variables, fewer than 15 unique values). Conditions that surpassed defined empirical thresholds (p-value <0.05, Spearman correlation >0.3, t-test >10, and ANOVA >20) were flagged as potential batch effects. Except in brain tissues, the COHORT variable (i.e. whether the samples were collected from organ donors or post-mortem) appeared to be the main batch effect, with ripple effects on numerous other related conditions (Figure 1—figure supplement 2). Moreover, SMRIN (sample’s RNA integrity number), DTHHRDY (death classification based on the 4-point Hardy Scale), and MHSMKYRS (smoke years) consistently emerged as conditions associated with the primary axes of variance. The number of genes detected in each sample, determined by the filtration step described above, was also identified as a significant contributor to the primary data variance. We, therefore, corrected for these five conditions, on a tissue-by-tissue basis, by adapting the removeBatchEffect function from the limma package (Ritchie et al., 2015). Specifically, we employed linear models to estimate the contributions to gene expression of each of those factors and subtracted such contributions from the original logCPM matrix. To ensure the biological interpretability of the results, we offset the resulting values to the minimum value in the non-corrected matrix. To prevent sample loss due to missing values for the aforementioned five conditions and since the number of missing values was relatively low compared to the total number of samples, imputation was carried out using the mice package (Buuren and Groothuis-Oudshoorn, 2011).
The resulting matrix of logCPM-corrected values was used for all downstream analyses. As an illustrative example of the importance of batch removal, the expression of surfactant factor SFTPA2 was found to be associated with donors on a ventilator (McCall et al., 2016). Without batch correction, SFTPA2 expression would have been associated with age due to the higher prevalence of such cases among older individuals (Figure 2—figure supplement 4).
ShARP-LM
To model the changes in gene expression with age, we developed the Shifting Age Range Pipeline for Linear Modelling (ShARP-LM). For each tissue, we fitted linear models to the gene expression of samples from donors with ages within windows with a range of 16 years shifted through consecutive years of age (i.e. in a sliding window with window size = 16 and step size = 1 years of age). This was the minimum age span needed to guarantee the presence of more than one sample per window, across all considered tissues. As samples at the ends of the dataset’s age range would be thereby involved in fewer linear models, we made the window size gradually increase from 11 to 16 years when starting from the ‘youngest’ samples and decrease from 16 to 11 years when reaching the ‘oldest’ (Figure 1—figure supplement 3).
Function lm from limma was used to fit the following linear model for gene expression (GE):
For each gene, α, β, and γ are the coefficients to be estimated for their respective hypothesised effects. For each sample, Age in years and Sex in binary were centered and Age&Sex interaction was given by their product. The coefficients E0 and ε are thus the expression of the average sample (i.e. with average sex and average age) and the error term.
For each gene in each model (i.e. each age window in each tissue), we retrieved the t-statistics of differential expression associated with the three relevant variables and their respective p-values. We considered the average age of the samples’ donors within the age window as the representative age of the observed expression changes.
In summary, for a given tissue and variable (Age, Sex, and Age&Sex), ShARP-LM yields t-statistics and p-values over age for all genes, reflecting the magnitude and significance of the changes in their expression throughout adult life.
Gene-centric visualisation of tissue-specific expression changes across age
For visualisation purposes, the trend of each gene’s expression progression over age in each tissue was derived through Local Polynomial Regression Fitting, using R function loess on logCPM values (Figures 1—3). For summarizing in a heatmap a given gene’s expression across age in multiple tissues (Figure 2A) or the expression of several genes across age in a specific tissue, each gene’s regression values are centered and scaled, using R function scale.
For summarizing in a heatmap the significance of a given gene’s expression changes over age in multiple tissues (Figure 2B), cubic smoothing splines are fitted to -log10(p), with p being the t-statistic’s p-value, with R function smooth.spline.
Tissue-specific quantification of global transcriptomic alterations across age
To assess the global transcriptomic impact of each of the three modelled effects in each tissue across age, we analysed the progression over age (i.e. over consecutive linear models) of the percentage of genes whose expression is significantly altered (t-statistic’s p-value ≤0.01) by each effect (Figure 3B). To evaluate the significance of each percentage and assess if high percentages can be confidently associated with major transcriptomic alterations, we controlled for their false discovery rate (FDR) by randomly permuting the samples’ ages and sexes within each age window fifty thousand times and performing ShARP-LM on each randomised dataset. We were then able to associate an FDR to each percentage of altered genes by comparing it with the distribution of those randomly generated (Figure 3B, A).
We also applied a linear model across the entire age range, thereby providing users with more insight and supporting evidence into how a specific gene changes with age. For visualisation purposes, we incorporated a dashed orange line, with the logFC per year for the Age effect as slope, in the respective scatter plots (Figure 3B, C). We depict the Sex effect therein by prominent dots on the average samples, with pink and blue denoting females and males, respectively.
GSEA
For each Peak of significant gene expression modifications, we performed GSEA (Subramanian et al., 2005) on the ordered (from the most positive to the most negative) t-statistics of differential expression for the respective tissue and age, using R package fgsea (Korotkevich et al., 2021) and the Reactome database (Croft et al., 2014). We extracted the GSEA normalised enrichment score (NES), which represents the degree to which a certain gene set is overrepresented at the extreme ends of the ranked list of genes. A positive NES corresponds to the gene set’s overrepresentation amongst up-regulated genes within the age window, whereas a negative NES signifies its overrepresentation amongst down-regulated genes. The NES for each pathway was used in subsequent analyses as a metric of its up- or down-regulation in the Peak. The resulting NES for each pathway was used in subsequent analyses as a metric of its over- or down-representation in the Peak.
To optimise computational efficiency and minimise redundancy in the analysed pathways, we only considered pathways containing a minimum of 15 genes and up to 500 genes, as suggested in the GSEA User Guide (GSEA-MSIGDB, 2023). For the sake of clarity in voyAGEr’s visual representations, we only included pathways with a p-adjusted value less than or equal to 0.05, further narrowing it down to pathways within the top 1% of p-adjusted values. Additionally, we exclusively featured pathways with at least one significant age Peak (FDR ≤ 0.05), as illustrated in Figure 4A.
Families of pathways
To reduce pathway redundancy and facilitate the assessment of their biological relevance in the results’ interpretation, we created an unifying representation of pathways from Reactome (Croft et al., 2014), KEGG (Kanehisa and Goto, 2000), and level 3 Biological Processes from GO (Gene Ontology Consortium, 2004), by adapting a published pathway clustering approach (Chen et al., 2014) to integrate them into families.
The approach relies on the definition of a hierarchy of pathways based on the number of genes they have in common. For each two pathways Pi and Pj, respectively containing sets of genes Gi and Gj, we computed their overlap index (OI) (Chen et al., 2014), defined as follows:
Where |Gi| is the number of genes in set Gi and |Gi∩Gj| is the number of genes in common between Gi and Gj. OIij = 1 would, therefore, indicate that Pi and Pj are identical in gene composition or that one is a subset of the other. On the contrary, OIij = 0 would mean that Pi and Pj have no genes in common. To ease the computational work, we removed from the analysis pathways that are subsets of larger pathways (i.e. each pathway whose genes are all present in another pathway).
From the OIij matrix, from which each row is a vector with the gene overlaps of pathway i with each of the pathways, we computed the matrix of Pearson’s correlation between all pathways’ overlap indexes with R function cor. That matrix was finally transformed into Euclidean distances with R function dist, allowing for pathways to be subsequently clustered with the complete linkage method with R function hclust. The final dendrogram was empirically cut into 10 clusters (Figure 4—figure supplement 1). Pathways that were initially excluded from the computation for being subsets of others were added to the clusters of their respective parent pathways. Each daughter pathway with more than one parent was assigned to the cluster of the parent with the smallest number of genes, thereby maximizing the daughter-parent similarity. The data.table R package, for fast handling of large matrices, was used in this analysis (Robertson et al., 1992).
Gene co-expression modules
Gene co-expression modules were defined with R package WGCNA (Langfelder and Horvath, 2008). For each considered tissue, the process began with the identification of a set of informative genes that exhibit high variability across samples (referred to as variable A), thus improving module definition. Next, we calculated the bicorrelation matrix for the expression of all selected genes with the bicor function. We then applied soft thresholding by raising all correlation values to the power of β, accentuating stronger correlations. The value of β=12 was chosen in accordance with the WGCNA FAQs (Langfelder and Horvath, 2024), and after confirmation of a free-scale topology using the pickSoftThreshold function. We generated the dissimilarity matrix by subtracting the output of the TOMsimilarity function from 1. Gene co-expression modules were then defined using a static tree-cutting algorithm, implemented via the cutreeStaticColor function, requiring as parameters a minimum number of genes per module (referred to as variable B) and the tree-cutting height (variable C).
The empirical determination of parameters A to C was guided by the following principles: (i) maximizing cell type signature enrichment, (ii) minimizing the number of genes per module, and (iii) ensuring that the modules' eigengenes exhibited age-related variability. Different combinations of these variables were exhaustively tested. To maintain biological relevance, modules consisting of non-assigned genes or genes lacking substantial supporting evidence, such as pseudogenes, were excluded.
Maximizing cell type enrichment in the modules, with a focus on known markers for specific cell types, has previously been proven successful in unveiling core transcriptional features of cell types in the human central nervous system (van Dam et al., 2017). Cell-type enrichment analysis relied on Fisher tests, providing odds enrichment scores and significance values (p-values). This involved comparing module genes with the signature, considering as background of genes those included in the module definition for each tissue. We prioritised modules of genes for which we obtained at least one significant result for each cell type (odds ratio (OR) >1 and p-value <0.05). The cell type signatures employed in this analysis were sourced from MSigDB’s C8 collection (Subramanian et al., 2005), and in the case of Whole Blood, additionally from LM22 (Chen et al., 2018).
Specific variance thresholds (variable A) were employed: 0.5, 0.4, 0.35, and 0.9 for Brain – Cortex, Muscle – Skeletal, Heart – Left Ventricle, and Whole Blood, respectively. The minimum number of genes per module (variable B) was set at 15, 20, 20, and 15, respectively. Tree-cutting heights (variable C) of 0.95, 0.98, 0.99, and 0.97 were respectively used.
Each module is characterised by a set of genes and an eigengene, represented by the first principal component obtained through singular-value decomposition of the module’s gene expressions. Subsequently, voyAGEr facilitates an evaluation of cell type enrichment, as described earlier, and enrichment in biological pathways and diseases. The enrichment of modules in cell types, Reactome pathways, and diseases (extracted from DisGeNET database version 7.0; Piñero et al., 2019; Piñero et al., 2017) was quantified using Fisher’s tests. For disease enrichment, the function disease_enrichment from the disgenet2r package (Piñero et al., 2019) was employed, utilising their curated set of diseases. The significance of these enrichments was determined through p-value/FDR adjustment using Benjamini-Hochberg correction. For visual clarity, only pathways and diseases displaying significant enrichment (p≤0.05) in at least one module were considered.
The four tissues (Brain - Cortex, Muscle - Skeletal, Heart - Left Ventricle, and Whole Blood) covered by the Module section of voyAGEr were selected due to their relatively high sample sizes and availability of comprehensive cell type signatures. The increasing availability of human tissue scRNA-seq datasets (e.g., through the Human Cell Atlas; Regev et al., 2017) will allow future updates of voyAGEr to encompass a wider range of tissues.
Data and code availability
Processed GTEx v8 RNA-seq data (read count tables) were downloaded from the project’s data portal (https://www.gtexportal.org/). Donor metadata were obtained from dbGaP - database of Genotypes and Phenotypes (Accession phs000424.v9.p2 project ID 13661). voyAGEr’s output tables can be directly downloaded in standard xls and csv formats. The complete source code for voyAGEr (v2.0.0 for the analyses reported herein), including pre-processing and Shiny app, can be accessed on GitHub at the following repository: https://github.com/DiseaseTranscriptomicsLab/voyAGEr.
Acknowledgements
We thank iMM colleagues Joana Neves and Luísa Lopes, as well as all members from the Disease Transcriptomics Lab, for providing valuable feedback on the manuscript. We also thank the very knowledgeable anonymous reviewers designated by eLife for their constructive and insightful suggestions and criticisms to the first version of this manuscript; their feedback greatly contributed to much improved versions of both the article and voyAGEr itself. This work was supported by European Molecular Biology Organization (EMBO Installation Grant 3057), FCT - Fundação para a Ciência e a Tecnologia IP. (FCT Investigator Starting Grant IF/00595/2014, CEEC Individual Assistant Researcher contract CEECIND/00436/2018, PhD Studentships SFRH/BD/131312/2017, UI/BD/153368/2022 and UI/BD/153363/2022, projects LA/P/0082/2020 and UIDP/50005/2020), European Union (EU) Horizon 2020 Research and Innovation Programme (RiboMed 857119), and GenomePT project (POCI-01–0145-FEDER-022184), supported by COMPETE 2020 – Operational Programme for Competitiveness and Internationalization (POCI), Lisboa Portugal Regional Operational Programme (Lisboa2020), Algarve Portugal Regional Operational Programme (CRESC Algarve2020), under the PORTUGAL 2020 Partnership Agreement, through the European Regional Development Fund (ERDF), and by FCT - Fundação para a Ciência e a Tecnologia.
Funding Statement
The funders had no role in study design, data collection and interpretation, or the decision to submit the work for publication.
Contributor Information
Nuno L Barbosa-Morais, Email: nmorais@fm.ul.pt.
Bérénice A Benayoun, University of Southern California, United States.
Carlos Isales, Augusta University, United States.
Funding Information
This paper was supported by the following grants:
European Molecular Biology Organization Installation Grant 3057 to Nuno L Barbosa-Morais.
Fundação para a Ciência e a Tecnologia FCT Investigator Starting Grant IF/00595/2014 to Nuno L Barbosa-Morais.
Fundação para a Ciência e a Tecnologia CEEC Individual Assistant Researcher contract CEECIND/00436/2018 to Nuno L Barbosa-Morais.
Fundação para a Ciência e a Tecnologia PhD Studentship SFRH/BD/131312/2017 to Nuno Saraiva-Agostinho.
Fundação para a Ciência e a Tecnologia PhD Studentship UI/BD/153368/2022 to Rita Martins-Silva.
Fundação para a Ciência e a Tecnologia PhD Studentship UI/BD/153363/2022 to Alexandre Kaizeler.
Fundação para a Ciência e a Tecnologia Project LA/P/0082/2020 to Arthur L Schneider, Rita Martins-Silva, Alexandre Kaizeler, Nuno Saraiva-Agostinho, Nuno L Barbosa-Morais.
Fundação para a Ciência e a Tecnologia Project UIDP/50005/2020 to Arthur L Schneider, Rita Martins-Silva, Alexandre Kaizeler, Nuno Saraiva-Agostinho, Nuno L Barbosa-Morais.
Horizon 2020 Framework Programme Twinning grant RiboMed 857119 to Nuno L Barbosa-Morais.
Fundação para a Ciência e a Tecnologia GenomePT project POCI-01-0145-FEDER-022184 to Arthur L Schneider, Nuno L Barbosa-Morais.
European Regional Development Fund GenomePT project POCI-01-0145-FEDER-022184 to Arthur L Schneider, Nuno L Barbosa-Morais.
Additional information
Competing interests
No competing interests declared.
Author contributions
Conceptualization, Resources, Data curation, Software, Formal analysis, Investigation, Visualization, Methodology, Writing – original draft.
Resources, Data curation, Software, Formal analysis, Validation, Investigation, Visualization, Methodology, Writing - review and editing.
Resources, Data curation, Software, Formal analysis, Validation, Investigation, Visualization, Methodology, Writing - review and editing.
Resources, Software.
Conceptualization, Supervision, Funding acquisition, Investigation, Methodology, Writing – original draft, Project administration, Writing - review and editing.
Additional files
For each tissue, we kept the genes with at least one CPM of expression in at least 40% of the samples.
Data availability
No data has been generated for this manuscript. The data used for the analyses described in this manuscript were obtained from the GTEx Portal (https://www.gtexportal.org/) and dbGaP accession number phs000424.v9.p2 on 06/12/2023. The complete source code for data processing and Shiny interface is available on GitHub: https://github.com/DiseaseTranscriptomicsLab/voyAGEr.
The following previously published dataset was used:
The GTEx Consortium 2022. Common Fund (CF) Genotype-Tissue Expression Project (GTEx) NCBI Gene Expression Omnibus. phs000424.v9.p2
References
- Almanzar N, Antony J, Baghel AS, Bakerman I, Bansal I, Barres BA, Beachy PA, Berdnik D, Bilen B, Brownfield D, Cain C, Chan CKF, Chen MB, Clarke MF, Conley SD, Darmanis S, Demers A, Demir K, de Morree A, Divita T, du Bois H, Ebadi H, Espinoza FH, Fish M, Gan Q, George BM, Gillich A, Gòmez-Sjöberg R, Green F, Genetiano G, Gu X, Gulati GS, Hahn O, Haney MS, Hang Y, Harris L, He M, Hosseinzadeh S, Huang A, Huang KC, Iram T, Isobe T, Ives F, Jones RC, Kao KS, Karkanias J, Karnam G, Keller A, Kershner AM, Khoury N, Kim SK, Kiss BM, Kong W, Krasnow MA, Kumar ME, Kuo CS, Lam J, Lee DP, Lee SE, Lehallier B, Leventhal O, Li G, Li Q, Liu L, Lo A, Lu WJ, Lugo-Fagundo MF, Manjunath A, May AP, Maynard A, McGeever A, McKay M, McNerney MW, Merrill B, Metzger RJ, Mignardi M, Min D, Nabhan AN, Neff NF, Ng KM, Nguyen PK, Noh J, Nusse R, Pálovics R, Patkar R, Peng WC, Penland L, Pisco AO, Pollard K, Puccinelli R, Qi Z, Quake SR, Rando TA, Rulifson EJ, Schaum N, Segal JM, Sikandar SS, Sinha R, Sit RV, Sonnenburg J, Staehli D, Szade K, Tan M, Tan W, Tato C, Tellez K, Dulgeroff LBT, Travaglini KJ, Tropini C, Tsui M, Waldburger L, Wang BM, van Weele LJ, Weinberg K, Weissman IL, Wosczyna MN, Wu SM, Wyss-Coray T, Xiang J, Xue S, Yamauchi KA, Yang AC, Yerra LP, Youngyunpipatkul J, Yu B, Zanini F, Zardeneta ME, Zee A, Zhao C, Zhang F, Zhang H, Zhang MJ, Zhou L, Zou J, The Tabula Muris Consortium A single-cell transcriptomic atlas characterizes ageing tissues in the mouse. Nature. 2020;583:590–595. doi: 10.1038/s41586-020-2496-1. [DOI] [PMC free article] [PubMed] [Google Scholar]
- Aramillo Irizar P, Schäuble S, Esser D, Groth M, Frahm C, Priebe S, Baumgart M, Hartmann N, Marthandan S, Menzel U, Müller J, Schmidt S, Ast V, Caliebe A, König R, Krawczak M, Ristow M, Schuster S, Cellerino A, Diekmann S, Englert C, Hemmerich P, Sühnel J, Guthke R, Witte OW, Platzer M, Ruppin E, Kaleta C. Transcriptomic alterations during ageing reflect the shift from cancer to degenerative diseases in the elderly. Nature Communications. 2018;9:327. doi: 10.1038/s41467-017-02395-2. [DOI] [PMC free article] [PubMed] [Google Scholar]
- Austad SN, Fischer KE. Sex Differences in Lifespan. Cell Metabolism. 2016;23:1022–1033. doi: 10.1016/j.cmet.2016.05.019. [DOI] [PMC free article] [PubMed] [Google Scholar]
- Benayoun BA, Pollina EA, Singh PP, Mahmoudi S, Harel I, Casey KM, Dulken BW, Kundaje A, Brunet A. Remodeling of epigenome and transcriptome landscapes with aging in mice reveals widespread induction of inflammatory responses. Genome Research. 2019;29:697–709. doi: 10.1101/gr.240093.118. [DOI] [PMC free article] [PubMed] [Google Scholar]
- Berchtold NC, Cribbs DH, Coleman PD, Rogers J, Head E, Kim R, Beach T, Miller C, Troncoso J, Trojanowski JQ, Zielke HR, Cotman CW. Gene expression changes in the course of normal brain aging are sexually dimorphic. PNAS. 2008;105:15605–15610. doi: 10.1073/pnas.0806883105. [DOI] [PMC free article] [PubMed] [Google Scholar]
- Buuren SV, Groothuis-Oudshoorn K. mice: multivariate imputation by chained equations in R. Journal of Statistical Software. 2011;45:i03. doi: 10.18637/jss.v045.i03. [DOI] [Google Scholar]
- Campisi JA. Aging, cellular senescence, and cancer. Annual Review of Physiology. 2013;75:685–705. doi: 10.1146/annurev-physiol-030212-183653. [DOI] [PMC free article] [PubMed] [Google Scholar]
- Cao J, O’Day DR, Pliner HA, Kingsley PD, Deng M, Daza RM, Zager MA, Aldinger KA, Blecher-Gonen R, Zhang F, Spielmann M, Palis J, Doherty D, Steemers FJ, Glass IA, Trapnell C, Shendure J. A human cell atlas of fetal gene expression. Science. 2020;370:eaba7721. doi: 10.1126/science.aba7721. [DOI] [PMC free article] [PubMed] [Google Scholar]
- Chang W, Cheng J, Allaire J, Sievert C, Schloerke B, Xie Y, Allen J, McPherson J, Dipert A, Borges B. Shiny: web application framework for R. R package version 1.8.1GitHub. 2024 https://github.com/rstudio/shiny
- Chen Y-A, Tripathi LP, Dessailly BH, Nyström-Persson J, Ahmad S, Mizuguchi K. Integrated pathway clusters with coherent biological themes for target prioritisation. PLOS ONE. 2014;9:e99030. doi: 10.1371/journal.pone.0099030. [DOI] [PMC free article] [PubMed] [Google Scholar]
- Chen B, Khodadoust MS, Liu CL, Newman AM, Alizadeh AA. In: Cancer Systems Biology. Von L, editor. Springer; 2018. Profiling tumor infiltrating immune cells with CIBERSORT; pp. 243–259. [DOI] [PMC free article] [PubMed] [Google Scholar]
- Craig T, Smelick C, Tacutu R, Wuttke D, Wood SH, Stanley H, Janssens G, Savitskaya E, Moskalev A, Arking R, de Magalhães JP. The Digital Ageing Atlas: integrating the diversity of age-related changes into a unified resource. Nucleic Acids Research. 2015;43:D873–D878. doi: 10.1093/nar/gku843. [DOI] [PMC free article] [PubMed] [Google Scholar]
- Croft D, Mundo AF, Haw R, Milacic M, Weiser J, Wu G, Caudy M, Garapati P, Gillespie M, Kamdar MR, Jassal B, Jupe S, Matthews L, May B, Palatnik S, Rothfels K, Shamovsky V, Song H, Williams M, Birney E, Hermjakob H, Stein L, D’Eustachio P. The Reactome pathway knowledgebase. Nucleic Acids Research. 2014;42:D472–D477. doi: 10.1093/nar/gkt1102. [DOI] [PMC free article] [PubMed] [Google Scholar]
- de Magalhães JP, Curado J, Church GM. Meta-analysis of age-related gene expression profiles identifies common signatures of aging. Bioinformatics. 2009;25:875–881. doi: 10.1093/bioinformatics/btp073. [DOI] [PMC free article] [PubMed] [Google Scholar]
- Dönertaş HM, Fuentealba Valenzuela M, Partridge L, Thornton JM. Gene expression‐based drug repurposing to target aging. Aging Cell. 2018;17:e12819. doi: 10.1111/acel.12819. [DOI] [PMC free article] [PubMed] [Google Scholar]
- Erickson S, Sangfelt O, Heyman M, Castro J, Einhorn S, Grandér D. Involvement of the Ink4 proteins p16 and p15 in T-lymphocyte senescence. Oncogene. 1998;17:595–602. doi: 10.1038/sj.onc.1201965. [DOI] [PubMed] [Google Scholar]
- Fan X, Dong J, Zhong S, Wei Y, Wu Q, Yan L, Yong J, Sun L, Wang X, Zhao Y, Wang W, Yan J, Wang X, Qiao J, Tang F. Spatial transcriptomic survey of human embryonic cerebral cortex by single-cell RNA-seq analysis. Cell Research. 2018;28:730–745. doi: 10.1038/s41422-018-0053-3. [DOI] [PMC free article] [PubMed] [Google Scholar]
- Galatro TF, Holtman IR, Lerario AM, Vainchtein ID, Brouwer N, Sola PR, Veras MM, Pereira TF, Leite REP, Möller T, Wes PD, Sogayar MC, Laman JD, den Dunnen W, Pasqualucci CA, Oba-Shinjo SM, Boddeke EWGM, Marie SKN, Eggen BJL. Transcriptomic analysis of purified human cortical microglia reveals age-associated changes. Nature Neuroscience. 2017;20:1162–1171. doi: 10.1038/nn.4597. [DOI] [PubMed] [Google Scholar]
- García-Pérez R, Ramirez JM, Ripoll-Cladellas A, Chazarra-Gil R, Oliveros W, Soldatkina O, Bosio M, Rognon PJ, Capella-Gutierrez S, Calvo M, Reverter F, Guigó R, Aguet F, Ferreira PG, Ardlie KG, Melé M. The landscape of expression and alternative splicing variation across human traits. Cell Genomics. 2023;3:100244. doi: 10.1016/j.xgen.2022.100244. [DOI] [PMC free article] [PubMed] [Google Scholar]
- Gene Ontology Consortium The Gene Ontology (GO) database and informatics resource. Nucleic Acids Research. 2004;32:258D–261. doi: 10.1093/nar/gkh036. [DOI] [PMC free article] [PubMed] [Google Scholar]
- Gershoni M, Pietrokovski S. The landscape of sex-differential transcriptome and its consequent selection in human adults. BMC Biology. 2017;15:7. doi: 10.1186/s12915-017-0352-z. [DOI] [PMC free article] [PubMed] [Google Scholar]
- Gheorghe M, Snoeck M, Emmerich M, Bäck T, Goeman JJ, Raz V. Major aging-associated RNA expressions change at two distinct age-positions. BMC Genomics. 2014;15:132. doi: 10.1186/1471-2164-15-132. [DOI] [PMC free article] [PubMed] [Google Scholar]
- Gil J, Peters G. Regulation of the INK4b-ARF-INK4a tumour suppressor locus: all for one or one for all. Nature Reviews. Molecular Cell Biology. 2006;7:667–677. doi: 10.1038/nrm1987. [DOI] [PubMed] [Google Scholar]
- Glass D, Viñuela A, Davies MN, Ramasamy A, Parts L, Knowles D, Brown AA, Hedman AK, Small KS, Buil A, Grundberg E, Nica AC, Di Meglio P, Nestle FO, Ryten M, UK Brain Expression consortium. MuTHER consortium. Durbin R, McCarthy MI, Deloukas P, Dermitzakis ET, Weale ME, Bataille V, Spector TD. Gene expression changes with age in skin, adipose tissue, blood and brain. Genome Biology. 2013;14:R75. doi: 10.1186/gb-2013-14-7-r75. [DOI] [PMC free article] [PubMed] [Google Scholar]
- Gorgoulis V, Adams PD, Alimonti A, Bennett DC, Bischof O, Bishop C, Campisi J, Collado M, Evangelou K, Ferbeyre G, Gil J, Hara E, Krizhanovsky V, Jurk D, Maier AB, Narita M, Niedernhofer L, Passos JF, Robbins PD, Schmitt CA, Sedivy J, Vougas K, von Zglinicki T, Zhou D, Serrano M, Demaria M. Cellular senescence: defining a path forward. Cell. 2019;179:813–827. doi: 10.1016/j.cell.2019.10.005. [DOI] [PubMed] [Google Scholar]
- GSEA-MSIGDB . Gene Set Enrichment Analysis (GSEA) User Guide. Broad institute; 2023. [Google Scholar]
- Harries LW, Hernandez D, Henley W, Wood AR, Holly AC, Bradley-Smith RM, Yaghootkar H, Dutta A, Murray A, Frayling TM, Guralnik JM, Bandinelli S, Singleton A, Ferrucci L, Melzer D. Human aging is characterized by focused changes in gene expression and deregulation of alternative splicing. Aging Cell. 2011;10:868–878. doi: 10.1111/j.1474-9726.2011.00726.x. [DOI] [PMC free article] [PubMed] [Google Scholar]
- Haustead DJ, Stevenson A, Saxena V, Marriage F, Firth M, Silla R, Martin L, Adcroft KF, Rea S, Day PJ, Melton P, Wood FM, Fear MW. Transcriptome analysis of human ageing in male skin shows mid-life period of variability and central role of NF-κB. Scientific Reports. 2016;6:26846. doi: 10.1038/srep26846. [DOI] [PMC free article] [PubMed] [Google Scholar]
- Holzscheck N, Söhle J, Kristof B, Grönniger E, Gallinat S, Wenck H, Winnefeld M, Falckenhayn C, Kaderali L. Multi-omics network analysis reveals distinct stages in the human aging progression in epidermal tissue. Aging. 2020;12:12393–12409. doi: 10.18632/aging.103499. [DOI] [PMC free article] [PubMed] [Google Scholar]
- Işıldak U, Somel M, Thornton JM, Dönertaş HM. Temporal changes in the gene expression heterogeneity during brain development and aging. Scientific Reports. 2020;10:4080. doi: 10.1038/s41598-020-60998-0. [DOI] [PMC free article] [PubMed] [Google Scholar]
- Janssens GE, Lin X-X, Millan-Ariño L, Kavšek A, Sen I, Seinstra RI, Stroustrup N, Nollen EAA, Riedel CG. Transcriptomics-based screening identifies pharmacological inhibition of Hsp90 as a means to defer aging. Cell Reports. 2019;27:467–480. doi: 10.1016/j.celrep.2019.03.044. [DOI] [PMC free article] [PubMed] [Google Scholar]
- Jozsi AC, Dupont-Versteegden EE, Taylor-Jones JM, Evans WJ, Trappe TA, Campbell WW, Peterson CA. Aged human muscle demonstrates an altered gene expression profile consistent with an impaired response to exercise. Mechanisms of Ageing and Development. 2000;120:45–56. doi: 10.1016/s0047-6374(00)00178-0. [DOI] [PubMed] [Google Scholar]
- Kaczmarek M. Variation in age at natural menopause among polish women in relation to biological and social factors. Plantin Publ. & Press Ltd; 2014. [DOI] [Google Scholar]
- Kanehisa M, Goto S. KEGG: kyoto encyclopedia of genes and genomes. Nucleic Acids Research. 2000;28:27–30. doi: 10.1093/nar/28.1.27. [DOI] [PMC free article] [PubMed] [Google Scholar]
- Kassam I, Wu Y, Yang J, Visscher PM, McRae AF. Tissue-specific sex differences in human gene expression. Human Molecular Genetics. 2019;28:2976–2986. doi: 10.1093/hmg/ddz090. [DOI] [PMC free article] [PubMed] [Google Scholar]
- Kelley KW, Nakao-Inoue H, Molofsky AV, Oldham MC. Variation among intact tissue samples reveals the core transcriptional features of human CNS cell classes. Nature Neuroscience. 2018;21:1171–1184. doi: 10.1038/s41593-018-0216-z. [DOI] [PMC free article] [PubMed] [Google Scholar]
- Khramtsova EA, Davis LK, Stranger BE. The role of sex in the genomics of human complex traits. Nature Reviews. Genetics. 2019;20:173–190. doi: 10.1038/s41576-018-0083-1. [DOI] [PubMed] [Google Scholar]
- Kimmel JC, Penland L, Rubinstein ND, Hendrickson DG, Kelley DR, Rosenthal AZ. Murine single-cell RNA-seq reveals cell-identity- and tissue-specific trajectories of aging. Genome Research. 2019;29:2088–2103. doi: 10.1101/gr.253880.119. [DOI] [PMC free article] [PubMed] [Google Scholar]
- Korotkevich G, Sukhov V, Budin N, Shpak B, Artyomov MN, Sergushichev A. Fast gene set enrichment analysis. bioRxiv. 2021 doi: 10.1101/060012. [DOI]
- Kunst J. Hightchater: A wrapper for the ‘Highcharts’ library. 0.9Rpackage. 2022 https://jkunst.com/highcharter/
- Langfelder P, Horvath S. WGCNA: an R package for weighted correlation network analysis. BMC Bioinformatics. 2008;9:559. doi: 10.1186/1471-2105-9-559. [DOI] [PMC free article] [PubMed] [Google Scholar]
- Langfelder P, Horvath S. WGCNA frequently asked questions. Metwarebio 2024
- Law CW, Chen Y, Shi W, Smyth GK. voom: Precision weights unlock linear model analysis tools for RNA-seq read counts. Genome Biology. 2014;15:R29. doi: 10.1186/gb-2014-15-2-r29. [DOI] [PMC free article] [PubMed] [Google Scholar]
- Lehallier B, Gate D, Schaum N, Nanasi T, Lee SE, Yousef H, Moran Losada P, Berdnik D, Keller A, Verghese J, Sathyan S, Franceschi C, Milman S, Barzilai N, Wyss-Coray T. Undulating changes in human plasma proteome profiles across the lifespan. Nature Medicine. 2019;25:1843–1850. doi: 10.1038/s41591-019-0673-2. [DOI] [PMC free article] [PubMed] [Google Scholar]
- Lonsdale J, Thomas J, Salvatore M, Phillips R, Lo E, Shad S, Hasz R, Walters G, Garcia F, Young N, Foster B, Moser M, Karasik E, Gillard B, Ramsey K, Sullivan S, Bridge J, Magazine H, Syron J, Fleming J, Siminoff L, Traino H, Mosavel M, Barker L, Jewell S, Rohrer D, Maxim D, Filkins D, Harbach P, Cortadillo E, Berghuis B, Turner L, Hudson E, Feenstra K, Sobin L, Robb J, Branton P, Korzeniewski G, Shive C, Tabor D, Qi L, Groch K, Nampally S, Buia S, Zimmerman A, Smith A, Burges R, Robinson K, Valentino K, Bradbury D, Cosentino M, Diaz-Mayoral N, Kennedy M, Engel T, Williams P, Erickson K, Ardlie K, Winckler W, Getz G, DeLuca D, MacArthur D, Kellis M, Thomson A, Young T, Gelfand E, Donovan M, Meng Y, Grant G, Mash D, Marcus Y, Basile M, Liu J, Zhu J, Tu Z, Cox NJ, Nicolae DL, Gamazon ER, Im HK, Konkashbaev A, Pritchard J, Stevens M, Flutre T, Wen X, Dermitzakis ET, Lappalainen T, Guigo R, Monlong J, Sammeth M, Koller D, Battle A, Mostafavi S, McCarthy M, Rivas M, Maller J, Rusyn I, Nobel A, Wright F, Shabalin A, Feolo M, Sharopova N, Sturcke A, Paschal J, Anderson JM, Wilder EL, Derr LK, Green ED, Struewing JP, Temple G, Volpi S, Boyer JT, Thomson EJ, Guyer MS, Ng C, Abdallah A, Colantuoni D, Insel TR, Koester SE, Little AR, Bender PK, Lehner T, Yao Y, Compton CC, Vaught JB, Sawyer S, Lockhart NC, Demchok J, Moore HF. The Genotype-Tissue Expression (GTEx) project. Nature Genetics. 2013;45:580–585. doi: 10.1038/ng.2653. [DOI] [PMC free article] [PubMed] [Google Scholar]
- López-Otín C, Blasco MA, Partridge L, Serrano M, Kroemer G. The hallmarks of aging. Cell. 2013;153:1194–1217. doi: 10.1016/j.cell.2013.05.039. [DOI] [PMC free article] [PubMed] [Google Scholar]
- Lu T, Pan Y, Kao S-Y, Li C, Kohane I, Chan J, Yankner BA. Gene regulation and DNA damage in the ageing human brain. Nature. 2004;429:883–891. doi: 10.1038/nature02661. [DOI] [PubMed] [Google Scholar]
- Lui JC, Chen W, Barnes KM, Baron J. Changes in gene expression associated with aging commonly originate during juvenile growth. Mechanisms of Ageing and Development. 2010;131:641–649. doi: 10.1016/j.mad.2010.08.010. [DOI] [PMC free article] [PubMed] [Google Scholar]
- Mayne BT, Bianco-Miotto T, Buckberry S, Breen J, Clifton V, Shoubridge C, Roberts CT. Large scale gene expression meta-analysis reveals tissue-specific, sex-biased gene expression in humans. Frontiers in Genetics. 2016;7:183. doi: 10.3389/fgene.2016.00183. [DOI] [PMC free article] [PubMed] [Google Scholar]
- McCall MN, Illei PB, Halushka MK. Complex sources of variation in tissue expression data: analysis of the gtex lung transcriptome. American Journal of Human Genetics. 2016;99:624–635. doi: 10.1016/j.ajhg.2016.07.007. [DOI] [PMC free article] [PubMed] [Google Scholar]
- Melé M, Ferreira PG, Reverter F, DeLuca DS, Monlong J, Sammeth M, Young TR, Goldmann JM, Pervouchine DD, Sullivan TJ, Johnson R, Segrè AV, Djebali S, Niarchou A, GTEx Consortium. Wright FA, Lappalainen T, Calvo M, Getz G, Dermitzakis ET, Ardlie KG, Guigó R. Human genomics: the human transcriptome across tissues and individuals. Science. 2015;348:660–665. doi: 10.1126/science.aaa0355. [DOI] [PMC free article] [PubMed] [Google Scholar]
- Nakamura S, Kawai K, Takeshita Y, Honda M, Takamura T, Kaneko S, Matoba R, Matsubara K. Identification of blood biomarkers of aging by transcript profiling of whole blood. Biochemical and Biophysical Research Communications. 2012;418:313–318. doi: 10.1016/j.bbrc.2012.01.018. [DOI] [PubMed] [Google Scholar]
- Narita M, Nũnez S, Heard E, Narita M, Lin AW, Hearn SA, Spector DL, Hannon GJ, Lowe SW. Rb-mediated heterochromatin formation and silencing of E2F target genes during cellular senescence. Cell. 2003;113:703–716. doi: 10.1016/s0092-8674(03)00401-x. [DOI] [PubMed] [Google Scholar]
- Niccoli T, Partridge L. Ageing as a risk factor for disease. Current Biology. 2012;22:R741–R752. doi: 10.1016/j.cub.2012.07.024. [DOI] [PubMed] [Google Scholar]
- Olah M, Patrick E, Villani A-C, Xu J, White CC, Ryan KJ, Piehowski P, Kapasi A, Nejad P, Cimpean M, Connor S, Yung CJ, Frangieh M, McHenry A, Elyaman W, Petyuk V, Schneider JA, Bennett DA, De Jager PL, Bradshaw EM. A transcriptomic atlas of aged human microglia. Nature Communications. 2018;9:539. doi: 10.1038/s41467-018-02926-5. [DOI] [PMC free article] [PubMed] [Google Scholar]
- Palmer AL, Ousman SS. Astrocytes and Aging. Frontiers in Aging Neuroscience. 2018;10:337. doi: 10.3389/fnagi.2018.00337. [DOI] [PMC free article] [PubMed] [Google Scholar]
- Piñero J, Bravo À, Queralt-Rosinach N, Gutiérrez-Sacristán A, Deu-Pons J, Centeno E, García-García J, Sanz F, Furlong LI. DisGeNET: a comprehensive platform integrating information on human disease-associated genes and variants. Nucleic Acids Research. 2017;45:D833–D839. doi: 10.1093/nar/gkw943. [DOI] [PMC free article] [PubMed] [Google Scholar]
- Piñero J, Ramírez-Anguita JM, Saüch-Pitarch J, Ronzano F, Centeno E, Sanz F, Furlong LI. The DisGeNET knowledge platform for disease genomics: 2019 update. Nucleic Acids Research. 2019;01:gkz1021. doi: 10.1093/nar/gkz1021. [DOI] [PMC free article] [PubMed] [Google Scholar]
- Rando TA, Wyss-Coray T. Asynchronous, contagious and digital aging. Nature Aging. 2021;1:29–35. doi: 10.1038/s43587-020-00015-1. [DOI] [PMC free article] [PubMed] [Google Scholar]
- Regev A, Teichmann SA, Lander ES, Amit I, Benoist C, Birney E, Bodenmiller B, Campbell P, Carninci P, Clatworthy M, Clevers H, Deplancke B, Dunham I, Eberwine J, Eils R, Enard W, Farmer A, Fugger L, Göttgens B, Hacohen N, Haniffa M, Hemberg M, Kim S, Klenerman P, Kriegstein A, Lein E, Linnarsson S, Lundberg E, Lundeberg J, Majumder P, Marioni JC, Merad M, Mhlanga M, Nawijn M, Netea M, Nolan G, Pe’er D, Phillipakis A, Ponting CP, Quake S, Reik W, Rozenblatt-Rosen O, Sanes J, Satija R, Schumacher TN, Shalek A, Shapiro E, Sharma P, Shin JW, Stegle O, Stratton M, Stubbington MJT, Theis FJ, Uhlen M, van Oudenaarden A, Wagner A, Watt F, Weissman J, Wold B, Xavier R, Yosef N, Human Cell Atlas Meeting Participants The Human Cell Atlas. eLife. 2017;6:e27041. doi: 10.7554/eLife.27041. [DOI] [PMC free article] [PubMed] [Google Scholar]
- Ritchie ME, Phipson B, Wu D, Hu Y, Law CW, Shi W, Smyth GK. limma powers differential expression analyses for RNA-sequencing and microarray studies. Nucleic Acids Research. 2015;43:e47. doi: 10.1093/nar/gkv007. [DOI] [PMC free article] [PubMed] [Google Scholar]
- Robertson MJ, Barnes JC, Drew GM, Clark KL, Marshall FH, Michel A, Middlemiss D, Ross BC, Scopes D, Dowle MD. Pharmacological profile of GR117289 in vitro: a novel, potent and specific non-peptide angiotensin AT1 receptor antagonist. British Journal of Pharmacology. 1992;107:1173–1180. doi: 10.1111/j.1476-5381.1992.tb13425.x. [DOI] [PMC free article] [PubMed] [Google Scholar]
- Robinson MD, McCarthy DJ, Smyth GK. edgeR: a Bioconductor package for differential expression analysis of digital gene expression data. Bioinformatics. 2010;26:139–140. doi: 10.1093/bioinformatics/btp616. [DOI] [PMC free article] [PubMed] [Google Scholar]
- Robinson MD, Oshlack A. A scaling normalization method for differential expression analysis of RNA-seq data. Genome Biology. 2010;11:R25. doi: 10.1186/gb-2010-11-3-r25. [DOI] [PMC free article] [PubMed] [Google Scholar]
- Rodwell GEJ, Sonu R, Zahn JM, Lund J, Wilhelmy J, Wang L, Xiao W, Mindrinos M, Crane E, Segal E, Myers BD, Brooks JD, Davis RW, Higgins J, Owen AB, Kim SK. A transcriptional profile of aging in the human kidney. PLOS Biology. 2004;2:e427. doi: 10.1371/journal.pbio.0020427. [DOI] [PMC free article] [PubMed] [Google Scholar]
- Saraiva-Agostinho N, de Almeida BP. cTRAP: identification of candidate causal perturbations from differential gene expression data. 0.1R Pacakge. 2020 https://rdrr.io/bioc/cTRAP/
- Schaum N, Lehallier B, Hahn O, Pálovics R, Hosseinzadeh S, Lee SE, Sit R, Lee DP, Losada PM, Zardeneta ME, Fehlmann T, Webber JT, McGeever A, Calcuttawala K, Zhang H, Berdnik D, Mathur V, Tan W, Zee A, Tan M, Tabula Muris Consortium. Pisco AO, Karkanias J, Neff NF, Keller A, Darmanis S, Quake SR, Wyss-Coray T. Ageing hallmarks exhibit organ-specific temporal signatures. Nature. 2020;583:596–602. doi: 10.1038/s41586-020-2499-y. [DOI] [PMC free article] [PubMed] [Google Scholar]
- Shavlakadze T, Morris M, Fang J, Wang SX, Zhu J, Zhou W, Tse HW, Mondragon-Gonzalez R, Roma G, Glass DJ. Age-related gene expression signature in rats demonstrate early, late, and linear transcriptional changes from multiple tissues. Cell Reports. 2019;28:3263–3273. doi: 10.1016/j.celrep.2019.08.043. [DOI] [PubMed] [Google Scholar]
- Stegeman R, Weake VM. Transcriptional Signatures of Aging. Journal of Molecular Biology. 2017;429:2427–2437. doi: 10.1016/j.jmb.2017.06.019. [DOI] [PMC free article] [PubMed] [Google Scholar]
- Subramanian A, Tamayo P, Mootha VK, Mukherjee S, Ebert BL, Gillette MA, Paulovich A, Pomeroy SL, Golub TR, Lander ES, Mesirov JP. Gene set enrichment analysis: a knowledge-based approach for interpreting genome-wide expression profiles. PNAS. 2005;102:15545–15550. doi: 10.1073/pnas.0506580102. [DOI] [PMC free article] [PubMed] [Google Scholar]
- Subramanian A, Narayan R, Corsello SM, Peck DD, Natoli TE, Lu X, Gould J, Davis JF, Tubelli AA, Asiedu JK, Lahr DL, Hirschman JE, Liu Z, Donahue M, Julian B, Khan M, Wadden D, Smith IC, Lam D, Liberzon A, Toder C, Bagul M, Orzechowski M, Enache OM, Piccioni F, Johnson SA, Lyons NJ, Berger AH, Shamji AF, Brooks AN, Vrcic A, Flynn C, Rosains J, Takeda DY, Hu R, Davison D, Lamb J, Ardlie K, Hogstrom L, Greenside P, Gray NS, Clemons PA, Silver S, Wu X, Zhao W-N, Read-Button W, Wu X, Haggarty SJ, Ronco LV, Boehm JS, Schreiber SL, Doench JG, Bittker JA, Root DE, Wong B, Golub TR. A Next generation connectivity map: L1000 platform and the first 1,000,000 Profiles. Cell. 2017;171:1437–1452. doi: 10.1016/j.cell.2017.10.049. [DOI] [PMC free article] [PubMed] [Google Scholar]
- Sun X, Kaufman PD. Ki-67: more than a proliferation marker. Chromosoma. 2018;127:175–186. doi: 10.1007/s00412-018-0659-8. [DOI] [PMC free article] [PubMed] [Google Scholar]
- Tacutu R, Thornton D, Johnson E, Budovsky A, Barardo D, Craig T, Diana E, Lehmann G, Toren D, Wang J, Fraifeld VE, de Magalhães JP. Human Ageing Genomic Resources: new and updated databases. Nucleic Acids Research. 2018;46:D1083–D1090. doi: 10.1093/nar/gkx1042. [DOI] [PMC free article] [PubMed] [Google Scholar]
- Thomas RP, Guigneaux M, Wood T, Evers BM. Age-associated changes in gene expression patterns in the liver. Journal of Gastrointestinal Surgery. 2002;6:445–453. doi: 10.1016/s1091-255x(01)00010-5. [DOI] [PubMed] [Google Scholar]
- Tower J. Sex-specific gene expression and life span regulation. Trends in Endocrinology and Metabolism. 2017;28:735–747. doi: 10.1016/j.tem.2017.07.002. [DOI] [PMC free article] [PubMed] [Google Scholar]
- van Dam S, Võsa U, van der Graaf A, Franke L, de Magalhães JP. Gene co-expression analysis for functional classification and gene–disease predictions. Briefings in Bioinformatics. 2017;bbw139:bbw139. doi: 10.1093/bib/bbw139. [DOI] [PMC free article] [PubMed] [Google Scholar]
- van Deursen JM. The role of senescent cells in ageing. Nature. 2014;509:439–446. doi: 10.1038/nature13193. [DOI] [PMC free article] [PubMed] [Google Scholar]
- Welle S, Brooks AI, Delehanty JM, Needler N, Thornton CA. Gene expression profile of aging in human muscle. Physiological Genomics. 2003;14:149–159. doi: 10.1152/physiolgenomics.00049.2003. [DOI] [PubMed] [Google Scholar]
- Wyss-Coray T. Ageing, neurodegeneration and brain rejuvenation. Nature. 2016;539:180–186. doi: 10.1038/nature20411. [DOI] [PMC free article] [PubMed] [Google Scholar]
- Yang J, Huang T, Petralia F, Long Q, Zhang B, Argmann C, Zhao Y, Mobbs CV, Schadt EE, Zhu J, Tu Z, Ardlie KG, Deluca DS, Segrè AV, Sullivan TJ, Young TR, Gelfand ET, Trowbridge CA, Maller JB, Tukiainen T, Lek M, Ward LD, Kheradpour P, Iriarte B, Meng Y, Palmer CD, Winckler W, Hirschhorn J, Kellis M, MacArthur DG, Getz G, Shablin AA, Li G, Zhou Y-H, Nobel AB, Rusyn I, Wright FA, Lappalainen T, Ferreira PG, Ongen H, Rivas MA, Battle A, Mostafavi S, Monlong J, Sammeth M, Mele M, Reverter F, Goldmann J, Koller D, Guigo R, McCarthy MI, Dermitzakis ET, Gamazon ER, Konkashbaev A, Nicolae DL, Cox NJ, Flutre T, Wen X, Stephens M, Pritchard JK, Lin L, Liu J, Brown A, Mestichelli B, Tidwell D, Lo E, Salvatore M, Shad S, Thomas JA, Lonsdale JT, Choi C, Karasik E, Ramsey K, Moser MT, Foster BA, Gillard BM, Syron J, Fleming J, Magazine H, Hasz R, Walters GD, Bridge JP, Miklos M, Sullivan S, Barker LK, Traino H, Mosavel M, Siminoff LA, Valley DR, Rohrer DC, Jewel S, Branton P, Sobin LH, Qi L, Hariharan P, Wu S, Tabor D, Shive C, Smith AM, Buia SA, Undale AH, Robinson KL, Roche N, Valentino KM, Britton A, Burges R, Bradbury D, Hambright KW, Seleski J, Korzeniewski GE, Erickson K, Marcus Y, Tejada J, Taherian M, Lu C, Robles BE, Basile M, Mash DC, Volpi S, Struewing J, Temple GF, Boyer J, Colantuoni D, Little R, Koester S, Carithers NLJ, Moore HM, Guan P, Compton C, Sawyer SJ, Demchok JP, Vaught JB, Rabiner CA, Lockhart NC, The GTEx Consortium Synchronized age-related gene expression changes across multiple tissues in human and the link to complex diseases. Scientific Reports. 2015;5:15145. doi: 10.1038/srep15145. [DOI] [PMC free article] [PubMed] [Google Scholar]
- Yihui X, Joe C, Xianying T. DT: A wrapper of the Javascript library ‘Datatables. 0.32Rpackage. 2024 https://github.com/rstudio/DT
- Yoshida S, Yashar BM, Hiriyanna S, Swaroop A. Microarray analysis of gene expression in the aging human retina. Investigative Ophthalmology & Visual Science. 2002;43:2554–2560. [PubMed] [Google Scholar]
- Yu Y, Fuscoe JC, Zhao C, Guo C, Jia M, Qing T, Bannon DI, Lancashire L, Bao W, Du T, Luo H, Su Z, Jones WD, Moland CL, Branham WS, Qian F, Ning B, Li Y, Hong H, Guo L, Mei N, Shi T, Wang KY, Wolfinger RD, Nikolsky Y, Walker SJ, Duerksen-Hughes P, Mason CE, Tong W, Thierry-Mieg J, Thierry-Mieg D, Shi L, Wang C. A rat RNA-Seq transcriptomic BodyMap across 11 organs and 4 developmental stages. Nature Communications. 2014;5:3230. doi: 10.1038/ncomms4230. [DOI] [PMC free article] [PubMed] [Google Scholar]
- Zahn JM, Sonu R, Vogel H, Crane E, Mazan-Mamczarz K, Rabkin R, Davis RW, Becker K, Owen AB, Kim SK. Transcriptional profiling of aging in human muscle reveals a common aging signature. PLOS Genetics. 2005;preprint:e115. doi: 10.1371/journal.pgen.0020115.eor. [DOI] [PMC free article] [PubMed] [Google Scholar]
- Zahn JM, Poosala S, Owen AB, Ingram DK, Lustig A, Carter A, Weeraratna AT, Taub DD, Gorospe M, Mazan-Mamczarz K, Lakatta EG, Boheler KR, Xu X, Mattson MP, Falco G, Ko MSH, Schlessinger D, Firman J, Kummerfeld SK, Wood WH, Zonderman AB, Kim SK, Becker KG. AGEMAP: a gene expression database for aging in mice. PLOS Genetics. 2007;3:e201. doi: 10.1371/journal.pgen.0030201. [DOI] [PMC free article] [PubMed] [Google Scholar]