Abstract
The fiber orientation distribution function (FOD) is an advanced model for high angular resolution diffusion MRI representing complex fiber geometry. However, the complicated mathematical structures of the FOD function pose challenges for FOD image processing tasks such as interpolation, which plays a critical role in the propagation of fiber tracts in tractography. In FOD-based tractography, linear interpolation is commonly used for numerical efficiency, but it is prone to generate false artificial information, leading to anatomically incorrect fiber tracts. To overcome this difficulty, we propose a flowbased and geometrically consistent interpolation framework that considers peak-wise rotations of FODs within the neighborhood of each location. Our method decomposes a FOD function into multiple components and uses a smooth vector field to model the flows of each peak in its neighborhood. To generate the interpolated result along the flow of each vector field, we develop a closed-form and efficient method to rotate FOD peaks in neighboring voxels and realize geometrically consistent interpolation of FOD components. By combining the interpolation results from each peak, we obtain the final interpolation of FODs. Experimental results on Human Connectome Project (HCP) data demonstrate that our method produces anatomically more meaningful FOD interpolations and significantly enhances tractography performance.
Keywords: Fiber Orientation Distribution, Interpolation, Tractography
1. Introduction
Diffusion MRI (dMRI) is the most widely used technique for studying human brain structural connectivity in vivo [1]. Significant improvements in imaging techniques dramatically increased the spatial and angular resolution of dMRI [2] and provided opportunities for advanced models such as fiber orientation distribution (FOD) [3], which facilitates the development of FOD-based fiber tracking for brain connectivity research. However, well-known challenges in current tractography methods generate large amounts of false positives and negatives [4]. While there have been considerable efforts in developing novel fiber tracking methods [5], a critical step in tractography, FOD interpolation, has received rare attention.
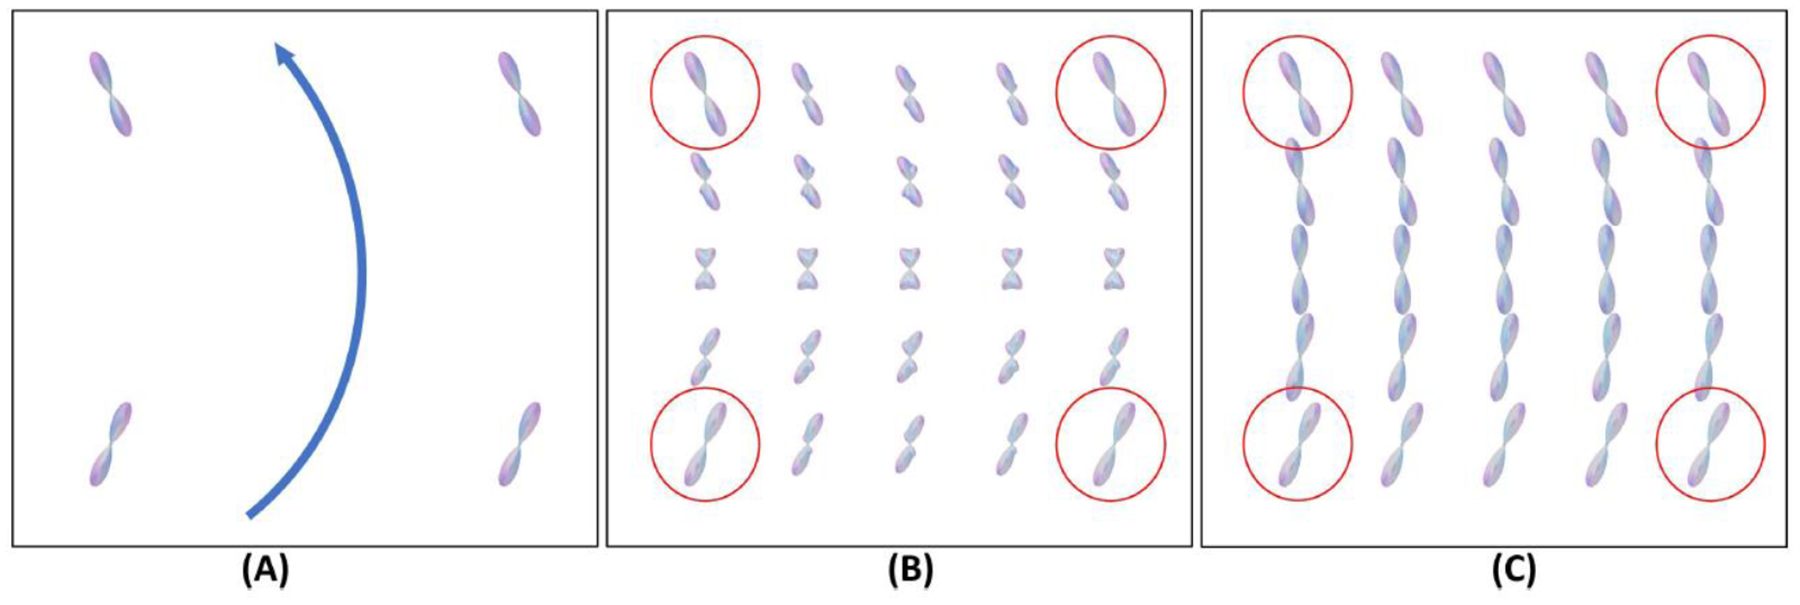
In popular FOD-based tractography, linear interpolation is commonly adopted for numerical efficiency. Still, it often generates artificial directions and ignores rotations between neighboring FODs, as shown in Figure 1. (B), which can lead to false positive streamlines. To enhance FOD interpolation, a Riemannian framework was proposed in [6]; under the square root reparameterization, the space of FOD functions can form the positive orthant of the unit Hilbert sphere. However, this framework is computationally expensive and sometimes fails to provide anatomically meaningful interpolations [7]. A rotation group action-based framework [7] was proposed that simultaneously averages the shape and rotation of FODs. A later work [8] proposed a rotation-induced Riemannian metric for FODs and introduced a weighted mean for FOD interpolation. However, since only one rotation is used for the whole FOD, these methods cannot handle more general situations where individual FOD peaks experience different rotations. More importantly, these methods have not been adopted in a tractography framework to advance fiber tracking performance due to their numerical complexity.
Figure 1.

An illustrative example of FOD interpolations. (A) FODs of four neighboring voxels from a bending fiber bundle were highlighted by red circles in (B) and (C). The blue arrow shows the direction of the fiber bundle. (B) Interpolated FODs by linear interpolation, where artificial peaks have been generated. (C) The interpolated result by our proposed method correctly accounts for rotation and follows the bending geometry of the fiber bundle.
In this work, we develop a novel framework to perform geometrically consistent interpolation of FODs and demonstrate its effectiveness in enhancing the performance of fiber tracking. We decompose each FOD function with multiple peak lobes into components, each with only one peak lobe. Then, we locally model neighboring voxels’ single-peak components, consistent in direction, as a vector field flow fitted by polynomials. Each vector field locally represents the geometry of an underlying fiber bundle and continuously determines the direction of single-peak components within the support. Then, a closed-form solution is developed to account for rotations of FODs represented as spherical harmonics and realize the geometrically consistent interpolation of each FOD component, as shown in Figure 1. (C). The interpolation of a complete FOD function with multiple peak lobes is obtained by merging the singlepeak interpolations from all the covering vector fields. In our experiments, we use HCP data to quantify the accuracy of the proposed FOD interpolation algorithm and show that it achieves superior performance than the commonly used linear interpolation approach. Furthermore, we apply our interpolation method to perform upsampling of FOD fields and significantly improve the performance of FOD-based tractography both qualitatively and quantitatively.
2. Method
2.1. FOD Decomposition
The fiber orientation distribution (FOD) is an advanced model representing the complicated crossing fiber’s geometry [9]. However, the multiple peak lobes of the FOD function pose a challenge for image processing. Our solution is to decompose the FOD function into several independent components, each containing only one peak lobe. A FOD function is conventionally represented under the real spherical harmonics (SPHARMs) basis up to the order N:
| (1) |
where is the mth (-n≤m≤n) real SPHARM basis at the order n (0≤n≤ N) and is the coefficient for the corresponding basis, U is the vector that represents all the coefficients , and θ and φ are the polar and azimuth angles of the spherical coordinates in R3. For any FOD function, we expand it using (1) on a unit sphere represented by a triangular mesh, search the peaks on the mesh, and accept the peaks whose value is higher than a threshold THD (e.g., 0.1). For a FOD function with K peak lobes, we solve the following optimization problem for its decomposition:
| (2) |
where Uk are the coefficients for the decomposed single-peak FOD components, and Ak is the matrix that represents the values of SPHARMs at neighboring directions around the kth peak (vertices within two rings of each peak). The first term enforces the sum of the decomposed single-peak components to equal the original FOD; the second term enforces each component to equal the original FOD near the corresponding peak; the third term suppresses each component around other peaks. We show an example of a FOD function decomposition in Figure 2, where a FOD function is decomposed into two single-peak components.
Figure 2.

A FOD function with two peak lobes is decomposed into two SPHARM-based FOD functions, each with only a salient peak lobe.
2.2. Modeling Single Peak FOD Components as Flow of Vector Fields
For each single-peak FOD component, we model it with the flow of a smooth vector field, which supports geometrically consistent interpolations of FOD components.
We represent the kth single-peak component of the FOD function at a voxel p0 as . We choose the peak direction of as the seeding vector vp0 of the local supporting vector field. Then we compute a tube , centering at p0, along the direction vp0 with a radius r and a height h (Figure 3. (A)). For each voxel pt within the tube , we choose the single-peak component (Figure 3. (B)) whose peak direction vpt is closest to vp0, and the peak direction vpt is a vector at pt (Figure 3. (C)). We do not pick any vector for voxels without a valid peak direction whose angular difference is less than a threshold θ to the seeding vector vp0. These peak vectors {vpt} form a vector field within this tube, and we use a second-order polynomial to fit each component of this vector field:
| (3) |
where (1≤d≤3) represent dth component of the vector at voxel pt. The second term regulates the second-order coefficients for smoothness. The polynomials are used to model the vector field within the tube that represents the kth underlying fiber bundle locally around the voxel p0.
Figure 3.

A vector field within a tube centering at a voxel p0. (A) Tube (yellow box) centering at p0 along the peak direction vp0 of the kth FOD component (green). (B) The FODs within the tube and the {} are in green. (C) The vectors {vpt} are picked at voxels within the tube, and these vectors are used to solve (3) and compute the supporting vector field .
2.3. Rotation Calculation for SPHARM-based FODs
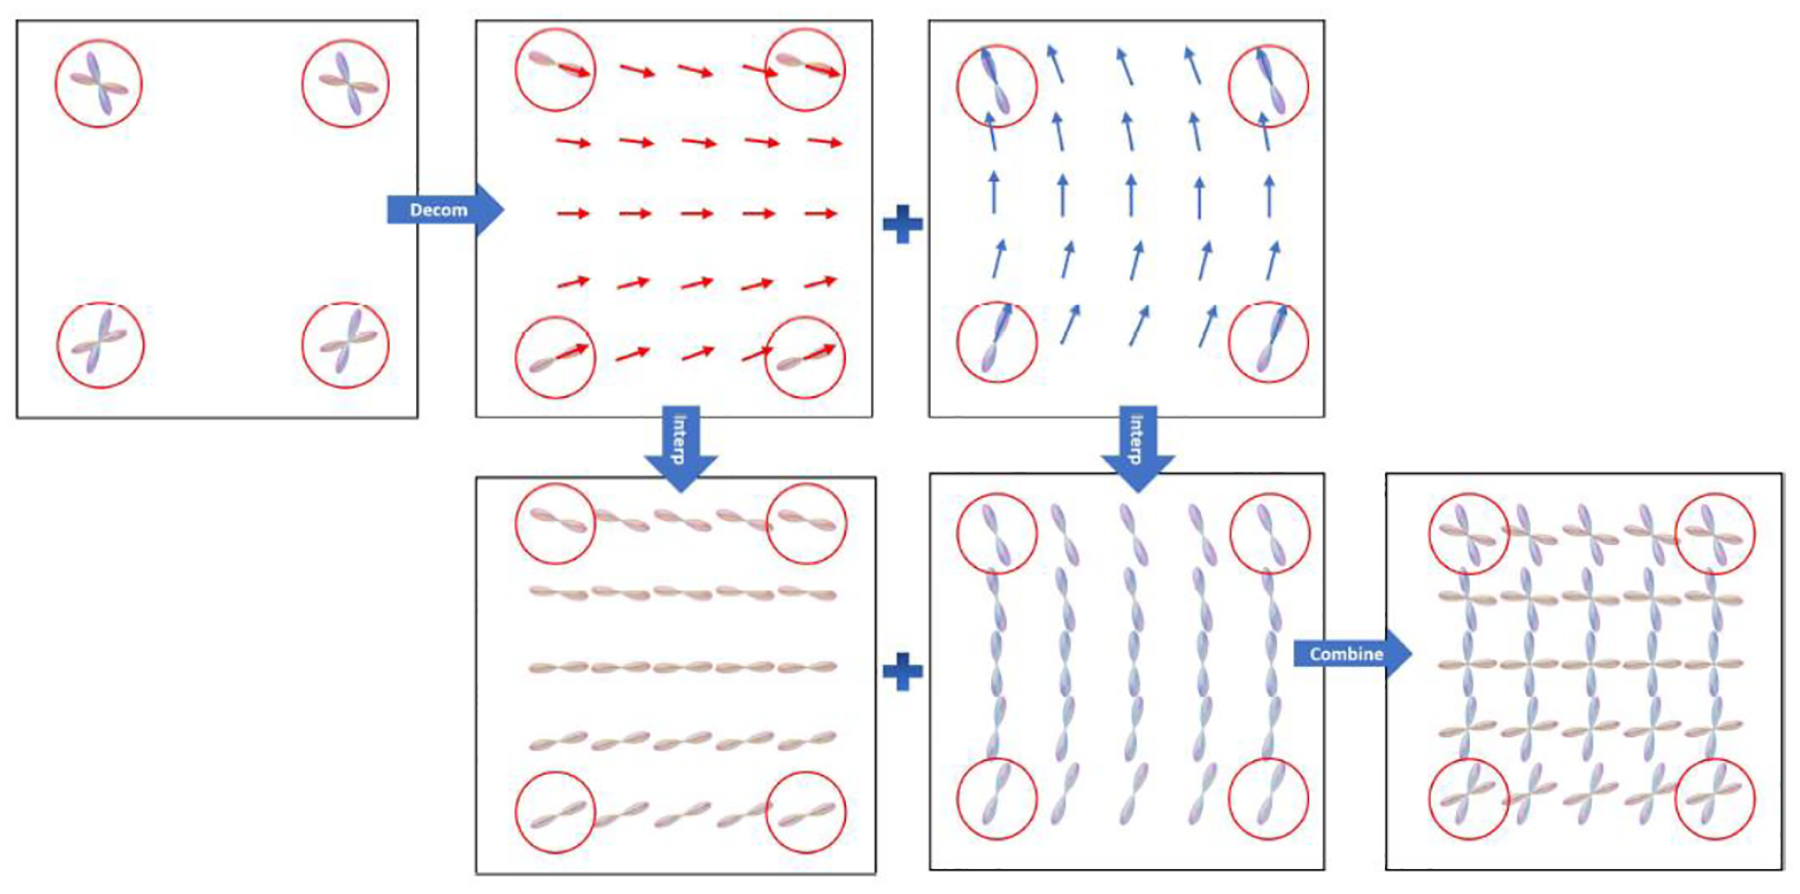
For a target point q where we perform the interpolation, we choose the nearest voxel p0, which has been augmented with a set of tubes {} and vector fields {} through the computation of section 2.2. For each vector field , we compute the vector vq at point q using its polynomial representation. Each of the corresponding kth single-peak FOD component from voxels within one voxel distance to q are used for interpolation. First, we rotate each single-peak component so that its peak direction is aligned with the vector vq. An easy way to compute the rotation is , where r is a vector with its direction determined by the crossing product between the peak vectors vpt and vq, and its length is the angle between vpt and vq; [∙]× is the crossproduct matrix of a vector [8]. Since the rotated single-peak FOD components are now aligned in direction, we can compute the weighted mean of SPHARM coefficients, which is the interpolated FOD component corresponding to the kth peak around voxel p0. The weights can be inverse distance or linear interpolation weights. After interpolating all the FOD single-peak components independently, we combine them into the complete interpolated FOD function at point q. The flowchart of the method is shown in Figure 4. Our framework independently handles the single-peak components of different FODs and successfully obtains geometrically consistent interpolation of complicated crossing fiber geometry.
Figure 4.

In the flowchart, the original FODs are highlighted by red circles at the four corners. The FOD functions are decomposed into single-peak components in the first row and locally fitted by vector field flows. In the second row, we rotate the single-peak components at four corners to align with the vectors at each target point, and then we compute their weighted mean at each target point. Finally, we combine the single-peak components into complete FODs.
An essential step for the interpolation above is to transform the FOD function by a rotation R. A straightforward numerical way is to expand the FOD function on a spherical triangular mesh and rotate the mesh to rotate the function and compute the inner products between the rotated FOD function and each of the SPHARM basis to obtain the coefficients. However, the numerical method is computationally expensive. Instead, we propose a closed-form solution to derive a matrix from the rotation R that can be applied to the coefficients of the SPHARMs. Let FODR represent the FOD function after applying the rotation R. We have the following relation:
| (4) |
where (θr,φr) is the coordinate acquired by rotating the coordinate (θ,φ) with the inverse rotation R−1. We represent (4) using the SPHARMs:
| (5) |
where and are coefficients for FODR and FOD, respectively. The key to computing coefficients is representing the SPHARM function by a linear combination of ; namely, finding the transformation of SPHARMs under a coordinate system rotation. For rotation R−1, we follow Wigner’s work [10] to decompose it as three successive rotations around three axes:
| (6) |
where Zγ and Zα are the rotations around the current z-axis by angles γ and α, respectively; Yβ is the rotation around the current y-axis by an angle β.
We transform the real SPHARMs into complex SPHARMs for more straightforward computation. Based on a group symmetry argument [10], Wigner has proven that Wigner D-matrices can represent the transformation of the nth-order complex SPHARMs between two coordinate systems based on the decomposition in (6):
| (7) |
where Wn is a (2n+1) complex vector that represents the nth-order complex SPHARMs; Dn is a (2n+1)-by-(2n+1) matrix whose elements are represented as:
| (8) |
where the first and third terms correspond to the rotations Zα and Zγ in (6), and the rotations around the z-axis are trivial since they only change the azimuth angle φ in the complex SPHARMs. The middle term is induced from the rotation Yβ, which corresponds to a rotation around the y-axis, and is much more complicated:
| (9) |
where P is the Jacobi polynomial, and other elements of this matrix can be induced by the symmetry property [11, 12]. Combining equations (5) and (7), we have:
| (10) |
where vn and un are real (2n+1) vectors whose mth element is and in (5); U is the real to complex SPHARMs transformation matrix, and its inverse is U−1. Now we can compute the nth-order coefficients of the rotated FODR in (4) by formula (10). The computation achieved by the closed-form representation is efficient because it only involves small-size matrix operations. For example, the largest matrix in coefficients computation for a FOD function represented by up to 16th-order SPHARMs is 33×33.
2.4. Evaluation Methods
We compare the proposed FOD interpolation method with the linear interpolation of SPHARM coefficients, the most used method in FOD-based tractography. We measure the quality of the interpolated FOD functions based on down-sampling; we downsimple a ground truth FOD volume data to half the resolution, interpolate the downsampled data to the original resolution, and measure the interpolated FOD functions against the ground truth data based on two metrics. The first metric is to measure the sharpness of the interpolated FOD functions, which indicates the specificity and accuracy of the FOD function. Inspired by the full width at half maximum (FWHM) in signal processing, we define the full area at half maximum (FAHM) of a FOD function f as . The metric FAHM is more sensitive to boating effects than entropy [7] and generalized fractional anisotropy [8]. Another metric is the relative error between the interpolated FOD function and the ground truth FOD function. The relative error is the L2 distance of two FOD functions divided by the L2 norm of the ground truth FOD function.
We also evaluate the effectiveness of the proposed method on tractography. We up-sample the FOD volume images to super-resolution images, including the cortical spinal tract (CST) area that connects the cortical surface to the internal capsule. Then, we run the popular tractography from the MRTrix [13] on the original and superresolution data. We use an evaluation called Topographic Regularity, an essential property widely presented in motor and sensory pathways [14–17], to show the improvements of the tractography on up-sampled FOD data. We measure the topographic regularity using an intuitive metric proposed in [14], where the classical multidimensional scaling (MDS) is used to project both the beginning (cortical surface) and ending points (internal capsule) of the streamlines of each CST bundle to R2. Then, the Procrustes distance between the projected beginning and ending points is computed to characterize how well topographic regularity is preserved during fiber tracking.
3. Experiment Results
We evaluated the FOD interpolation using 40 HCP subjects[18], including 20 females and 20 males. We reconstructed 16th-order SPHARM-based FODs [9] from the HCP data with an isotropic resolution of 1.25mm. For parameters in our method, we set λ1, λ2, and λ3 in equations (2) and (3) to be 1; the radius r, height h, and θ of the tubes to be three times of voxel size, five times of voxel size, and 10 degrees.
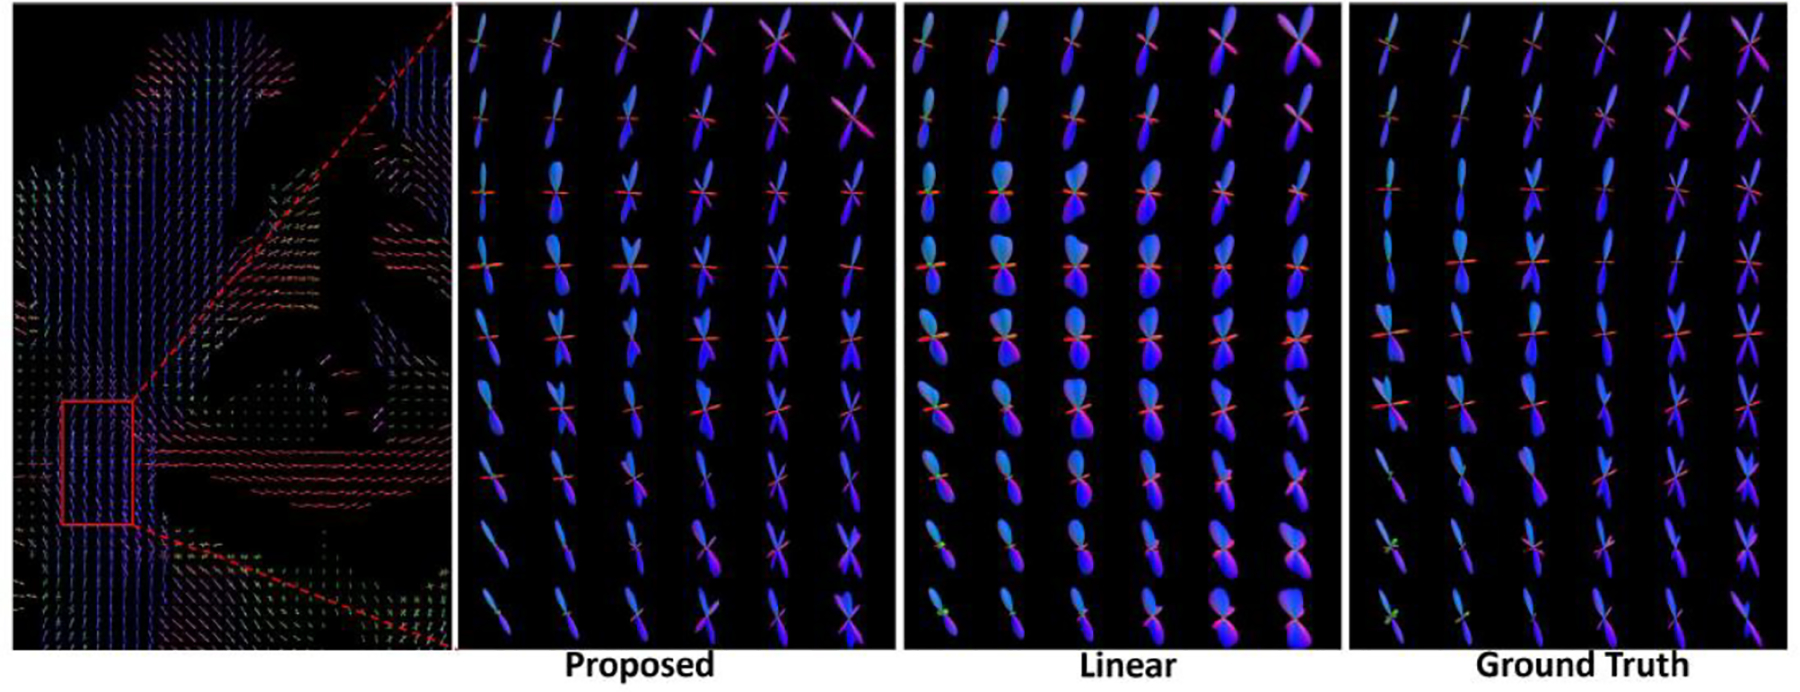
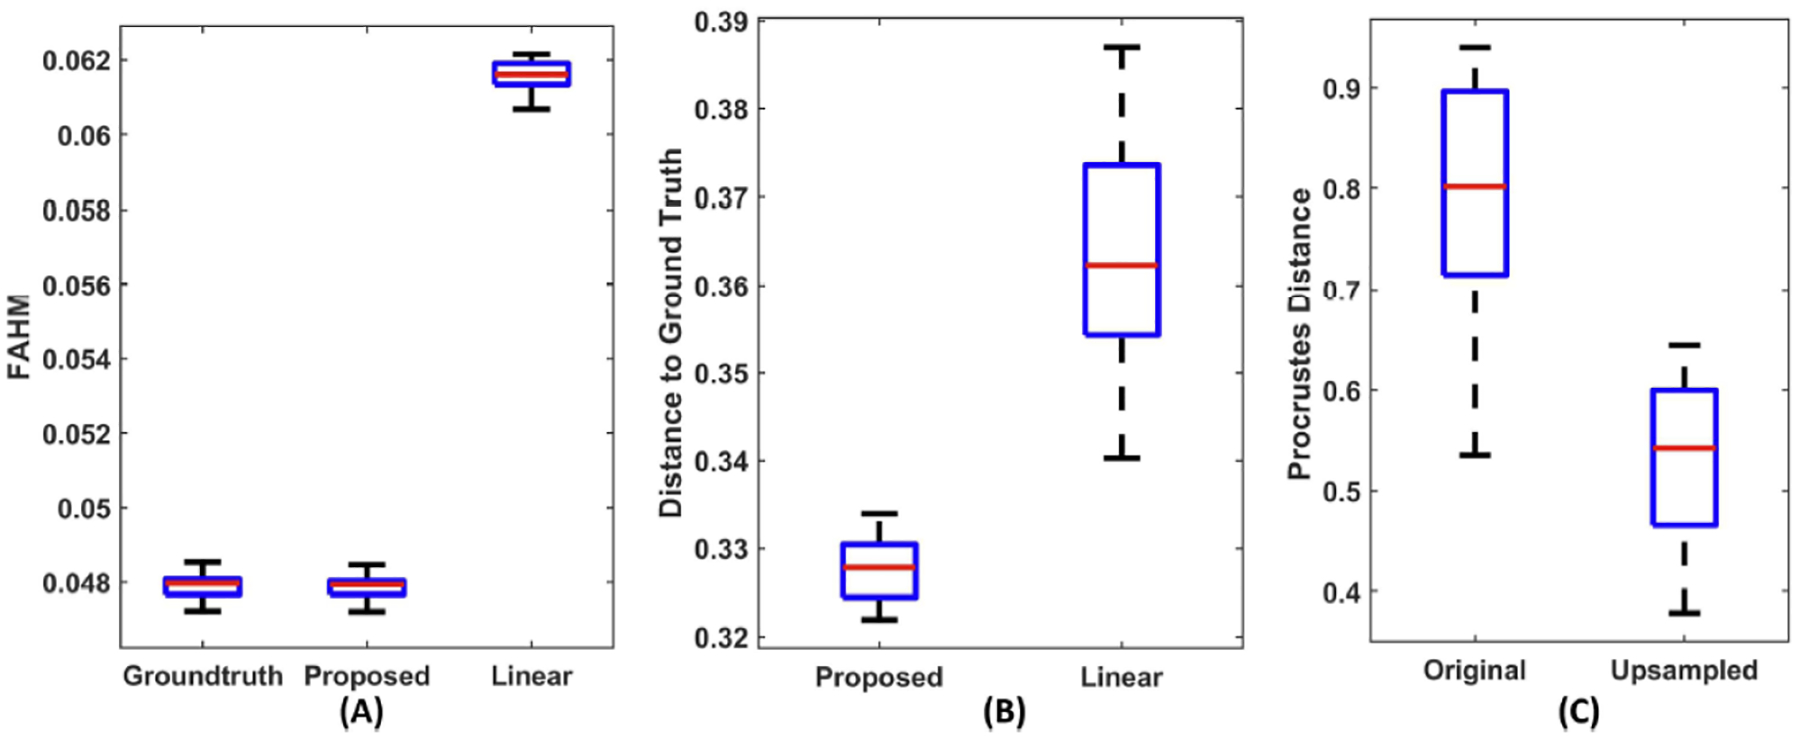
The HCP FOD data is used as the ground truth for down-sampling-based evaluation. We show the FODs from one interpolated slice of a subject in Figure 5 and highlight the FODs from an ROI (red box) where several fiber bundles cross. Contrasting to the proposed method, FODs from linear interpolation tend to lose their sharpness. For each subject, we computed the FAHM and relative L2 error for each interpolated FOD, which was then used to compute the mean FAHM and mean relative L2 error among all interpolated FODs. We show the boxplots of these measures from the 40 HCP subjects in Figure 6. (A) and (B). The FAHM measurement shows our approach avoids the bloating effects and preserves a similar level of sharpness to the ground truth FODs; the lower mean relative L2 error to the ground truth from our method further shows the proposed interpolation achieved more accurate interpolation.
Figure 5.

One interpolated slice of the FODs. For FODs within the red box, a zoomed view of the proposed interpolation, the linear interpolation, and the ground truth are plotted.
Figure 6.

Boxplots from quantitative comparisons using data from 40 HCP subjects. (A) Mean FAHM of the ground-truth FODs, upsampled FODs from the proposed and linear interpolation. (B) Relative error between up-sampled FODs and ground truth. (C) Procrustes distance of CST bundles from fiber tracking based on linear interpolation (original) and our up-sampled FODs.
We up-sampled the 40 HCP FOD volume images around the CST region to superresolution images with an isotropic resolution of 0.25mm. Then, we ran FOD-based probabilistic tractography on the original and up-sampled FOD data using the iFOD1 algorithm of the MRtrix software [13]. In each run, 10K seed points are randomly selected, and the main parameters of iFOD1 are set as: step size = 0.02mm, which is around 0.1 times the voxel size of the up-sampled image, and angle threshold = 7 degrees. The same parameters were used for the original HCP dataset to avoid the bias of parameters. Three representative examples of the reconstructed CST bundle from the motor cortex to the internal capsule are shown in Figure 7, where we can easily see that the tracts from the super-resolution FOD by our proposed interpolation method are much smoother and better reflect the somatotopic organizational principles of the CST from neuroanatomy than the baseline tracking results. In Figure 6. (C), boxplots of the results from Procrustes analyses further confirm this observation and demonstrate that our geometric FOD interpolation algorithm can significantly enhance the anatomical consistency of fiber tracking results.
Figure 7.

Tractography of CST on original HCP data and upsampled data for three subjects, and for each bundle, we downsample the number of streamlines to 1000 for visualization.
4. Conclusion
We propose a novel interpolation method for FOD function with enhanced consistency of fiber geometry. The experiments show that our method provides a more accurate interpolation of FODs and can generate super-resolution FODs via upsampling to improve the tractography’s performance significantly. In future work, we will integrate the proposed FOD interpolation with tractography algorithms and validate its performance in reducing false positives and negatives in challenging fiber bundles.
Acknowledgement
This work is supported by the National Institute of Health (NIH) under grants R01EB022744, RF1AG077578, RF1AG056573, RF1AG064584, R21AG064776, P41EB015922, U19AG078109.
References
- 1.Wandell BA: Clarifying Human White Matter. Annu Rev Neurosci 39, 103–128 (2016) [DOI] [PubMed] [Google Scholar]
- 2.Ugurbil K, Xu J, Auerbach EJ, Moeller S, Vu AT, Duarte-Carvajalino JM, Lenglet C, Wu X, Schmitter S, Van de Moortele PF, Strupp J, Sapiro G, De Martino F, Wang D, Harel N, Garwood M, Chen L, Feinberg DA, Smith SM, Miller KL, Sotiropoulos SN, Jbabdi S, Andersson JL, Behrens TE, Glasser MF, Van Essen DC, Yacoub E, Consortium WU-MH: Pushing spatial and temporal resolution for functional and diffusion MRI in the Human Connectome Project. Neuroimage 80, 80–104 (2013) [DOI] [PMC free article] [PubMed] [Google Scholar]
- 3.Tournier JD, Calamante F, Connelly A: Robust determination of the fibre orientation distribution in diffusion MRI: Non-negativity constrained super-resolved spherical deconvolution. NeuroImage 35, 1459–1472 (2007) [DOI] [PubMed] [Google Scholar]
- 4.Thomas C, Ye FQ, Irfanoglu MO, Modi P, Saleem KS, Leopold DA, Pierpaoli C: Anatomical accuracy of brain connections derived from diffusion MRI tractography is inherently limited. Proc Natl Acad Sci U S A 111, 16574–16579 (2014) [DOI] [PMC free article] [PubMed] [Google Scholar]
- 5.Aydogan DB, Shi Y: Parallel Transport Tractography. IEEE Trans Med Imaging 40, 635–647 (2021) [DOI] [PMC free article] [PubMed] [Google Scholar]
- 6.Goh A, Lenglet C, Thompson PM, Vidal R: A nonparametric Riemannian framework for processing high angular resolution diffusion images and its applications to ODF-based morphometry. Neuroimage 56, 1181–1201 (2011) [DOI] [PMC free article] [PubMed] [Google Scholar]
- 7.Cetingul HE, Afsari B, Wright MJ, Thompson PM, Vidal R: Group Action Induced Averaging for Hardi Processing. Proc IEEE Int Symp Biomed Imaging 1389–1392 (2012) [DOI] [PMC free article] [PubMed] [Google Scholar]
- 8.Li J, Shi Y, Toga AW: Diffusion of fiber orientation distribution functions with a rotation-induced riemannian metric. Med Image Comput Comput Assist Interv 17, 249–256 (2014) [DOI] [PMC free article] [PubMed] [Google Scholar]
- 9.Tran G, Shi Y: Fiber Orientation and Compartment Parameter Estimation from Multi-Shell Diffusion Imaging. IEEE Trans Med Imaging 34, 2320–2332 (2015) [DOI] [PMC free article] [PubMed] [Google Scholar]
- 10.Wigner EP: Group Theory and Its Application to the Quantum Mechanics of Atomic Spectra. American journal of physics 28, 408–409 (1960) [Google Scholar]
- 11.Aubert G: An alternative to Wigner d-matrices for rotating real spherical harmonics. AIP advances 3, 62121–062121 (2013) [Google Scholar]
- 12.Lai S-T, Palting P, Chiu Y-N: On the closed form of Wigner rotation matrix elements. Journal of mathematical chemistry 19, 131–145 (1996) [Google Scholar]
- 13.Tournier JD, Calamante F, Connelly A: MRtrix: Diffusion tractography in crossing fiber regions. Int J Imag Syst Tech 22, 53–66 (2012) [Google Scholar]
- 14.Aydogan DB, Shi Y: Tracking and validation techniques for topographically organized tractography. Neuroimage 181, 64–84 (2018) [DOI] [PMC free article] [PubMed] [Google Scholar]
- 15.Jbabdi S, Sotiropoulos SN, Behrens TE: The topographic connectome. Curr Opin Neurobiol 23, 207–215 (2013) [DOI] [PMC free article] [PubMed] [Google Scholar]
- 16.Nie X, Shi Y: Topographic Filtering of Tractograms as Vector Field Flows. pp. 564–572. Springer International Publishing, (Year) [PMC free article] [PubMed] [Google Scholar]
- 17.Patel GH, Kaplan DM, Snyder LH: Topographic organization in the brain: searching for general principles. Trends Cogn Sci 18, 351–363 (2014) [DOI] [PMC free article] [PubMed] [Google Scholar]
- 18.Van Essen DC, Ugurbil K, Auerbach E, Barch D, Behrens TE, Bucholz R, Chang A, Chen L, Corbetta M, Curtiss SW, Della Penna S, Feinberg D, Glasser MF, Harel N, Heath AC, Larson-Prior L, Marcus D, Michalareas G, Moeller S, Oostenveld R, Petersen SE, Prior F, Schlaggar BL, Smith SM, Snyder AZ, Xu J, Yacoub E, Consortium WU-MH: The Human Connectome Project: a data acquisition perspective. Neuroimage 62, 2222–2231 (2012) [DOI] [PMC free article] [PubMed] [Google Scholar]


