

Abstract
Background:
Reported rates of maternal mortality in the United States have been staggeringly high and increasing, and cardiovascular disease (CVD) is a chief contributor to such deaths. However, the impact of hypertensive disorders of pregnancy (HDP) on short-term risk of cardiovascular death is not well understood.
Objectives:
To evaluate the association between HDP (chronic hypertension, gestational hypertension, preeclampsia, eclampsia, and superimposed preeclampsia) and pregnancy-associated mortality rates (PMR) from all causes, CVD-related causes both at delivery and within one year following delivery.
Methods:
We used the Nationwide Readmissions Database (2010–2018) to examine PMRs for females 15–54 years old. International Classification of Disease 9 and 10 diagnosis codes were used to identify pregnancy-associated deaths due to HDP and CVD. Discrete-time Cox proportional hazards regression models were used to calculate adjusted hazard ratios (HR) and 95% confidence intervals (CI) for mortality at delivery (0 days) and at <30, <60, <90, <180, and <365 days after delivery in relation to HDP.
Results:
Of 33,417,736 hospital deliveries, the rate of HDP was 11.0% (n = 3,688,967), and the PMR from CVD was 6.4 per 100,000 delivery hospitalisations (n = 2141). Compared with normotensive patients, HRs for CVD-related PMRs increased with HDP severity, reaching over 58-fold for eclampsia patients. HRs were higher for stroke-related (1.2 to 170.9) than heart disease (HD)-related (0.99 to 39.8) mortality across all HDPs. Except for gestational hypertension, the increased risks of CVD mortality were evident at delivery and persisted one year postpartum for all HDPs.
Conclusions:
HDPs are strong risk factors for pregnancy-associated mortality due to CVD at delivery and within one year postpartum; the risks are stronger for stroke than HD-related PMR. While absolute PMRs are low, this study supports the importance of extending postpartum care beyond the traditional 42-day postpartum visit for people whose pregnancies are complicated by hypertension.
Keywords: Pregnancy-associated mortality, Hypertensive disorders of pregnancy, Cardiovascular disease, Heart disease, Stroke
Social Media Quote
Preeclampsia/eclampsia is associated with a substantially higher risk of pregnancy-associated mortality due to cardiovascular disease in the year following delivery.
Background
Maternal mortality rates (MMR) declined rapidly in the United States in the 20th century.1 This decline attributable to improved living conditions, safer surgical procedures, blood transfusions, sterilisation techniques, effective anaesthesia, an increase in hospitalised births, and the use of antibiotics. However, since the turn of the 21st century, MMRs in the United States have increased,2,3 from 9.8 in 20004 to a staggering 32.9 per 100,000 live births in 2021.5 The high and rising rates of maternal death, especially the racial disparities in maternal mortality, have become a cause for serious concern, although there is controversy regarding the accuracy of these reported MMRs from death certificates due to potential pregnancy checkbox misclassifications.5–8
Globally, cardiovascular disease (CVD) has been ranked as the leading cause of maternal mortality.9,10 It is estimated that over 80% of deaths that occur during pregnancy, delivery, and up to one year postpartum are potentially preventable; of these deaths, 21% are related to cardiac/coronary conditions and cardiomyopathy.11 Given the substantial increase in rates of preexisting heart disease in the US in recent years,12 and the increasing prevalence of cardiovascular diseases, such as ischemic heart disease, acute coronary syndrome, stroke, cardiomyopathy, heart failure, pulmonary hypertension, arrhythmia, and congenital heart disease,13 the contribution of CVD-related deaths in pregnancy and in the postpartum period remains a growing clinical and public health concern.
Hypertensive disorders of pregnancy (HDP), including chronic hypertension, gestational hypertension, preeclampsia, eclampsia, and superimposed preeclampsia, are common obstetrical complications that occur in approximately 10% of pregnancies worldwide;14,15 in addition, the prevalence of gestational hypertension, preeclampsia, and eclampsia has been increasing in the US between 2010 (8.9%) and 2019 (14.9%).13 Preeclampsia has been implicated in chronic health conditions along the life course,16 with studies reporting a 2-fold increase in associated rates of all-cause mortality and premature death,4,14 and up to a 3-fold higher mortality rate for ischaemic heart disease, heart failure, hypertension, stroke,17 and CVD14 in relation to preeclampsia. Preeclampsia/eclampsia rates increased by 25% from 1987 to 2004 in the US18,19 and have continued to increase from 2010 (4.7%) to 2019 (7.7%).13 Similarly, the risk of severe preeclampsia increased 6 to 7-fold from 1980 to 2003.20 Preeclampsia-associated MMRs in the US declined annually by 2.6% over the last four decades (1979–2018), while chronic hypertension-associated MMRs have increased annually by 9.2%.21
Given the temporal increase in the population prevalence of HDP, we designed a study to evaluate the association between HDP and short-term mortality risk from all-cause CVD, heart disease (HD), and stroke during delivery and within one year following delivery.
Methods
This population-based retrospective cohort study was based on the 2010–2018 Nationwide Readmissions Database (NRD), assembled as part of the Healthcare Cost and Utilization Project (HCUP), by the Agency for Healthcare Research and Quality. The NRD consists of all-payer hospital inpatient stays in the US (18 states in 2010 and 28 states in 2018)22 using sample weights to generate nationally representative estimates of hospital discharges. Data were drawn from State Inpatient Databases (SID) to link patient readmissions across hospitals within a state up to one calendar year.23 Therefore, the maximum follow-up time for each patient in our study was 12 months.
Exposure: Hypertensive disorders of pregnancy
HDPs were examined in six categories, including chronic hypertension, gestational hypertension, preeclampsia without severe features, preeclampsia with severe features (without eclampsia), superimposed preeclampsia (without eclampsia), and eclampsia. We used the International Classification of Disease (ICD) codes version 9 (2010 to third quarter 2015) and version 10 (fourth quarter 2015 to 2018) to identify hospital deliveries and associated HDPs (Table S1). This classification is consistent with the HDP categories used by the American College of Obstetricians and Gynecologists (ACOG; with Haemolysis, elevated liver enzymes, low platelet count [HELLP] syndrome considered as a severe form of preeclampsia).24
Outcome: Pregnancy-associated mortality
The World Health Organization (WHO) defines maternal deaths as “deaths from any cause related to or aggravated by pregnancy or its management (excluding accidental or incidental causes) during pregnancy and childbirth or within 42 days of termination of pregnancy, irrespective of the duration and site of the pregnancy”25 and late maternal death as “ the death of a woman from direct or indirect obstetric causes, more than 42 days but less than one year after termination of pregnancy”.25 All deaths that occur in pregnancy, at delivery or in the 1 year period following delivery, irrespective of whether or not they are caused by pregnancy or aggravated by the pregnant state are referred to as pregnancy-associated deaths.26 We defined all in-hospital deaths at delivery and subsequent in-hospital deaths that occurred within one year postpartum as pregnancy-associated deaths to identify associations beyond the traditional 42-day time period. While the NRD database identifies hospital deaths, the assigned underlying cause of death was not specified. We identified pregnancy-associated CVD deaths using ICD 9 (up to 30 diagnoses and 15 procedures) and ICD 10 (up to 40 diagnoses and 25 procedures) codes in the hospitalisation record. We stratified pregnancy-associated deaths as those from any cause, CVD-related causes, and its two main sub-categories: (i) heart disease deaths, which included ischaemic heart disease, atherosclerotic heart disease, acute myocardial infarction, hypertensive heart disease, heart failure, cardiomyopathy, and cardiac arrhythmias deaths; and (ii) stroke deaths, which included ischaemic and haemorrhagic types (Table S1).
Cohort composition
The cohort was restricted to hospitalised deliveries, regardless of plurality (singleton or multiple births) and outcome (live birth or stillbirth), to females aged 15–54 years from January to December 2010 to 2018 (weighted n = 33,417,736). The outcome event was hospitalised deaths at delivery or following delivery up to December 31 of each year; Table S2 characterises the distribution of deaths and deliveries per month. We excluded deliveries with diagnoses related to ectopic pregnancy, molar pregnancy, or abortive outcomes, pre-existing CVD prior to delivery and diagnoses of both chronic hypertension and pre-existing hypertensive heart/renal disease in pregnancy (Table S1). The latter exclusions were intended to restrict the focus to deliveries with HDP without documented CVD prior to pregnancy. Deliveries diagnosed with unspecified hypertension were also excluded because they represented a heterogeneous group including mild and severe HDP (Figure S1).
Statistical analysis
Pregnancy-associated mortality rates (PMR) due to HDP (per 100,000 delivery hospitalisations: hereafter referred to as “per 100,000”) and rate differences (RD, expressed per 100,000) were estimated within the calendar year of delivery. These rates were determined hierarchically: we first estimated rates of all-cause pregnancy-associated deaths, followed by deaths due to CVD causes (as well as their sub-categories). We estimated the hazard ratio (HR) and 95% confidence interval (CI) for PMR in relation to each HDP derived from Cox proportional hazards regression models. In all models, we adjusted for the potential confounding effects of maternal age (15–19, 20–24,…, 45–54 years), hospital bed size (small, medium, or large) specific to the hospital’s location, and teaching status,27 hospital type (government, non-federal, private, not-profit, private, invest-own), hospital teaching status (metropolitan non-teaching, metropolitan, teaching, non-metropolitan hospital), income quartile (low, medium-low, medium-high, high, or unknown; based on the median household income of patients’ ZIP code and year),28 insurance, year of delivery, assisted reproductive technology (ART) conception, pre-pregnancy diabetes, and multiple gestation (singleton, twins and higher order).
Hospitalisation discharge month and year were provided by the NRD but not discharge day. We generated the day based on a random uniform distribution accounting for differing numbers of days in each month and leap years to calculate person-time months of follow-up. Patients were followed from the delivery discharge date to the last day of the calendar year or in-hospital death. Patients who delivered in January had up to 12 person-months of follow-up time, and those who delivered in December had up to 1 person-month of follow-up time. Cumulative discrete-time Cox proportional hazards models were fit for hospital death at delivery (0 days) and within 30, 60, 90, 180, and 365 days following delivery.
Missing data
There were little missing data overall, with the missing proportions being 0.2% (n = 71,074) for insurance and 0.9% (n = 306,229) for income. A missing level indicator was created for both insurance and income to include deliveries with missing information in the analyses.
Sensitivity analysis
We performed two sensitivity analyses. First, we computed the E-values for the HR and the CI closest to the null to account for bias due to unmeasured confounders. The E-value is defined as the minimum strength of association that an unmeasured confounder would need to have with both the exposure and the outcome (above the measured covariates), to fully explain away an association.29 Second, we further adjusted the models for the month of delivery within a calendar year to evaluate if bias due to secular changes in the distribution of deaths confounded the associations between HDP and CVD-related deaths.
All statistical analyses were performed using SAS (version 9.4; SAS Institute Inc., Cary, NC, USA), and data visualisation was performed in RStudio (version 2022.12.0.353; Boston, MA, USA)
Ethics approval
Since the HCUP’s NRD data are deidentified and publicly available, they do not require ethics approval for studies involving human subjects. Therefore, no ethics approval was sought.
Results
Demographic characteristics
There were 33,417,736 (weighted) hospital deliveries from 2010–2018 with 3,688,967 (11.0%) deliveries complicated by any HDP (Table 1 and Table S3). The rate of HDP increased from 2010 (9.4%) to 2018 (14.4%), and rates were especially high among persons with advancing age. Prevalence rates of comorbidities were higher among patients with HDP.
Table 1.
Distribution of normotensive and hypertensive disorders of pregnancy at delivery: Nationwide Readmissions Database, 2010–2018
| Total Number (%col) |
Normotensive Number (%col) |
Any hypertensive disorder of pregnancy | ||
|---|---|---|---|---|
| Number (%col) |
Rate per 100 hospitalisations | |||
| Total | 33,417,736 | 29,728,769 (100.0) | 3,688,967 (100.0) | (11.0) |
| Hypertensive disorder | ||||
| Normotensive | - | 29,728,769 (100.0) | - | |
| Chronic hypertension | - | - | 622,434 (16.9) | (2.1) |
| Gestational hypertension | - | - | 1,395,990 (37.8) | (4.5) |
| Preeclampsia without severe features | - | - | 788,764 (21.4) | (2.6) |
| Preeclampsia with severe features | - | - | 607,617 (16.5) | (2.0) |
| Superimposed Preeclampsia | - | - | 248,821 (6.7) | (0.8) |
| Eclampsia | - | - | 25,341 (0.7) | (0.1) |
| Maternal age (year) | ||||
| 15–19 | 2,345,377 (7.0) | 2,087,441 (7.0) | 257,936 (7.0) | (11.0) |
| 20–24 | 7,301,478 (21.8) | 6,567,341 (22.1) | 734,137 (19.9) | (10.1) |
| 25–29 | 9,595,481 (28.7) | 8,605,377 (28.9) | 990,103 (26.8) | (10.3) |
| 30–34 | 8,888,361 (26.6) | 7,920,667 (26.6) | 967,694 (26.2) | (10.9) |
| 35–39 | 4,290,392 (12.8) | 3,727,090 (12.5) | 563,302 (15.3) | (13.1) |
| 40–44 | 934,631 (2.8) | 774,212 (2.6) | 160,419 (4.3) | (17.2) |
| 45–54 | 62,017 (0.2) | 46,641 (0.2) | 15,376 (0.4) | (24.8) |
| Hospital bedsize | ||||
| Small | 4,489,730 (13.4) | 4,025,581 (13.5) | 464,149 (12.6) | (10.3) |
| Medium | 9,170,745 (27.4) | 8,192,262 (27.6) | 978,483 (26.5) | (10.7) |
| Large | 19,757,261 (59.1) | 17,510,926 (58.9) | 2,246,335 (60.9) | (11.4) |
| Hospital type | ||||
| Government, non-federal | 3,946,622 (11.8) | 3,476,639 (11.7) | 469,983 (12.7) | (11.9) |
| Private, not-profit | 25,306,690 (75.7) | 22,515,768 (75.7) | 2,790,923 (75.7) | (11.0) |
| Private, invest-own | 4,164,424 (12.5) | 3,736,362 (12.6) | 428,062 (11.6) | (10.3) |
| Teaching hospital status | ||||
| Metropolitan, non-teaching | 10,256,185 (30.7) | 9,315,789 (31.3) | 940,396 (25.5) | (9.2) |
| Metropolitan, teaching | 19,738,974 (59.1) | 17,322,276 (58.3) | 2,416,698 (65.5) | (12.2) |
| Non-metropolitan hospital | 3,422,577 (10.2) | 3,090,705 (10.4) | 331,873 (9.0) | (9.7) |
| Insurance | ||||
| Medicare | 229,133 (0.7) | 188,411 (0.6) | 40,721 (1.1) | (17.8) |
| Medicaid | 14,199,867 (42.5) | 12,633,207 (42.5) | 1,566,660 (42.5) | (11.0) |
| Private | 17,357,215 (51.9) | 15,438,222 (51.9) | 1,918,993 (52.0) | (11.1) |
| Self-pay | 511,100 (1.5) | 465,962 (1.6) | 45,138 (1.2) | (8.8) |
| Others | 1,049,347 (3.1) | 940,747 (3.2) | 108,600 (2.9) | (10.3) |
| Unknown | 71,074 (0.2) | 62,219 (0.2) | 8,855 (0.2) | (12.5) |
| Income | ||||
| Low | 9,299,803 (27.8) | 8,125,659 (27.3) | 1,174,143 (31.8) | (12.6) |
| Medium low | 8,364,469 (25.0) | 7,435,115 (25.0) | 929,354 (25.2) | (11.1) |
| Medium high | 8,280,367 (24.8) | 7,397,054 (24.9) | 883,313 (23.9) | (10.7) |
| High | 7,166,868 (21.4) | 6,499,619 (21.9) | 667,248 (18.1) | (9.3) |
| Unknown | 306,229 (0.9) | 271,322 (0.9) | 34,908 (0.9) | (11.4) |
| Diabetes mellitus | ||||
| Non-diabetic | 30,822,790 (92.2) | 27,692,229 (93.1) | 3,130,560 (84.9) | (10.2) |
| Pre-pregnancy | 327,857 (1.0) | 195,777 (0.7) | 132,080 (3.6) | (40.3) |
| Gestational | 2,267,082 (6.8) | 1,840,757 (6.2) | 426,325 (11.6) | (18.8) |
| Comorbidities | ||||
| Preterm delivery | 1,424,430 (4.3) | 1,146,364 (3.9) | 278,067 (7.5) | (19.5) |
| IUGR/SGA | 1,001,814 (3.0) | 781,644 (2.6) | 220,170 (6.0) | (22.0) |
| Stillbirth | 149,746 (0.4) | 126,003 (0.4) | 23,743 (0.6) | (15.9) |
| Placental abruption | 357,166 (1.1) | 292,793 (1.0) | 64,373 (1.7) | (18.0) |
| Multiple gestation | 625,632 (1.9) | 478,804 (1.6) | 146,828 (4.0) | (23.5) |
| Caesarean delivery | 10,964,115 (32.8) | 9,220,030 (31.0) | 1,744,085 (47.3) | (15.9) |
| Assisted reproduction conception | 310,174 (0.9) | 243,131 (0.8) | 67,044 (1.8) | (21.6) |
| Year of hospital discharge | ||||
| 2010 | 3,772,312 (11.3) | 3,416,790 (11.5) | 355,522 (9.6) | (9.4) |
| 2011 | 3,733,283 (11.2) | 3,380,560 (11.4) | 352,723 (9.6) | (9.4) |
| 2012 | 3,718,978 (11.1) | 3,357,193 (11.3) | 361,785 (9.8) | (9.7) |
| 2013 | 3,725,806 (11.1) | 3,358,669 (11.3) | 367,137 (10.0) | (9.9) |
| 2014 | 3,749,407 (11.2) | 3,364,949 (11.3) | 384,458 (10.4) | (10.3) |
| 2015 | 3,737,390 (11.2) | 3,316,509 (11.2) | 420,881 (11.4) | (11.3) |
| 2016 | 3,734,415 (11.2) | 3,280,334 (11.0) | 454,081 (12.3) | (12.2) |
| 2017 | 3,651,066 (10.9) | 3,174,864 (10.7) | 476,202 (12.9) | (13.0) |
| 2018 | 3,595,080 (10.8) | 3,078,901 (10.4) | 516,178 (14.0) | (14.4) |
All-Cause and CVD Mortality Rates
The PMR per 100,000 for in-hospital deaths was 9.4 (n = 3151), 6.4 (n = 2141), 5.6 (n = 1873), and 1.3 (n = 449), for all-cause mortality, CVD, HD, and stroke-related hospitalised mortality, respectively (Table S4). HD and stroke death rates were highest in eclampsia patients with similar rates of stroke at delivery and up to one year postpartum (Figure 1). HD deaths were mostly due to co-occurring cardiac arrhythmias and rates were similar during and after delivery. Stroke death rates were mostly due to haemorrhagic stroke, and higher rates of ischemic stroke occurred after delivery than during delivery (Figure S2). Although the prevalence rates of HDPs increased over time (Figure 2A), CVD PMRs per 100,000 for preeclampsia without severe features decreased over time (Figure 2B).
Figure 1.
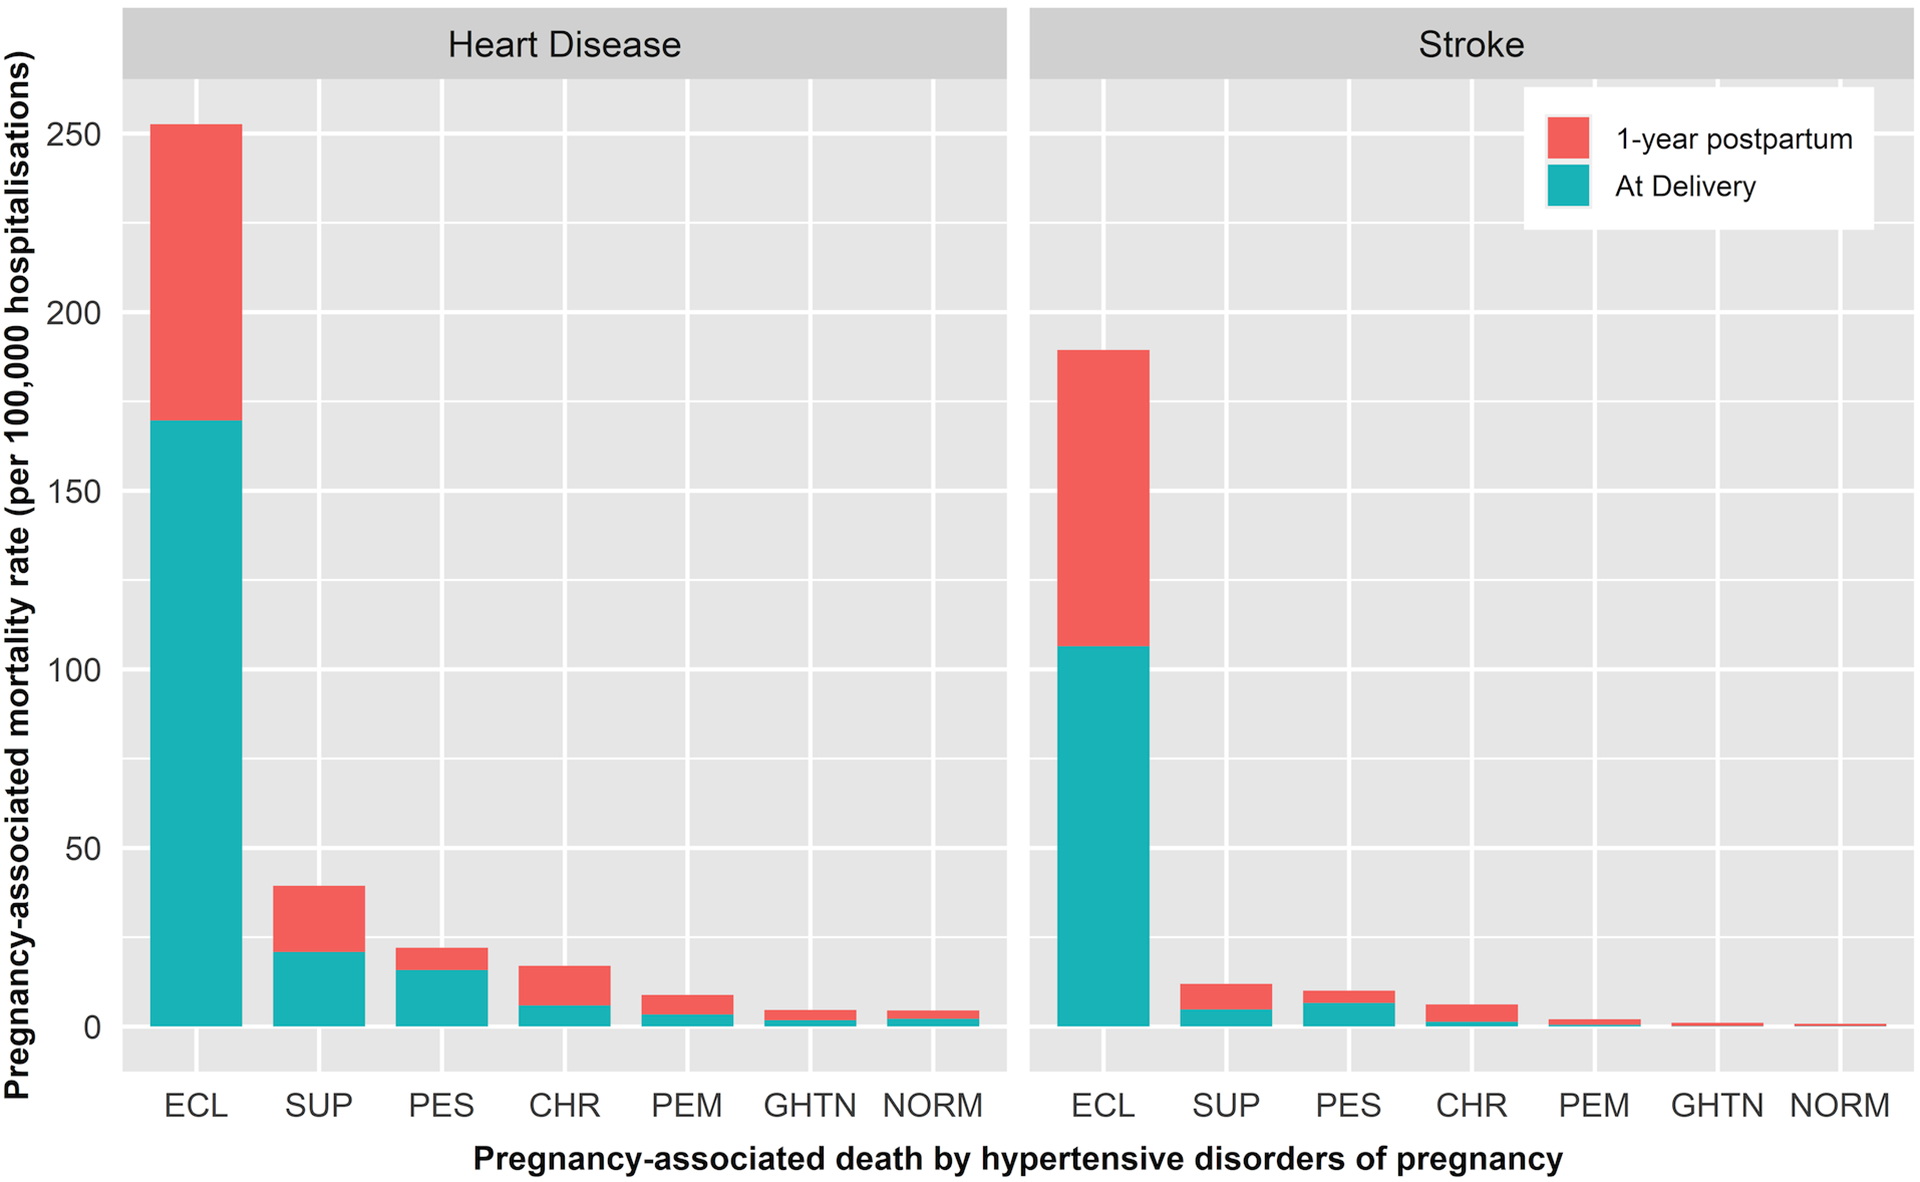
Pregnancy-associated mortality rates from heart disease and stroke by hypertensive disorders of pregnancy, eclampsia (ECL), superimposed preeclampsia (SUP), preeclampsia with severe features (PES), chronic hypertension (CHR), preeclampsia without severe features (PEM), gestational hypertension (GHTN), and normotension (NORM) at delivery and after delivery: Nationwide Readmissions Database, 2010–2018
Figure 2.
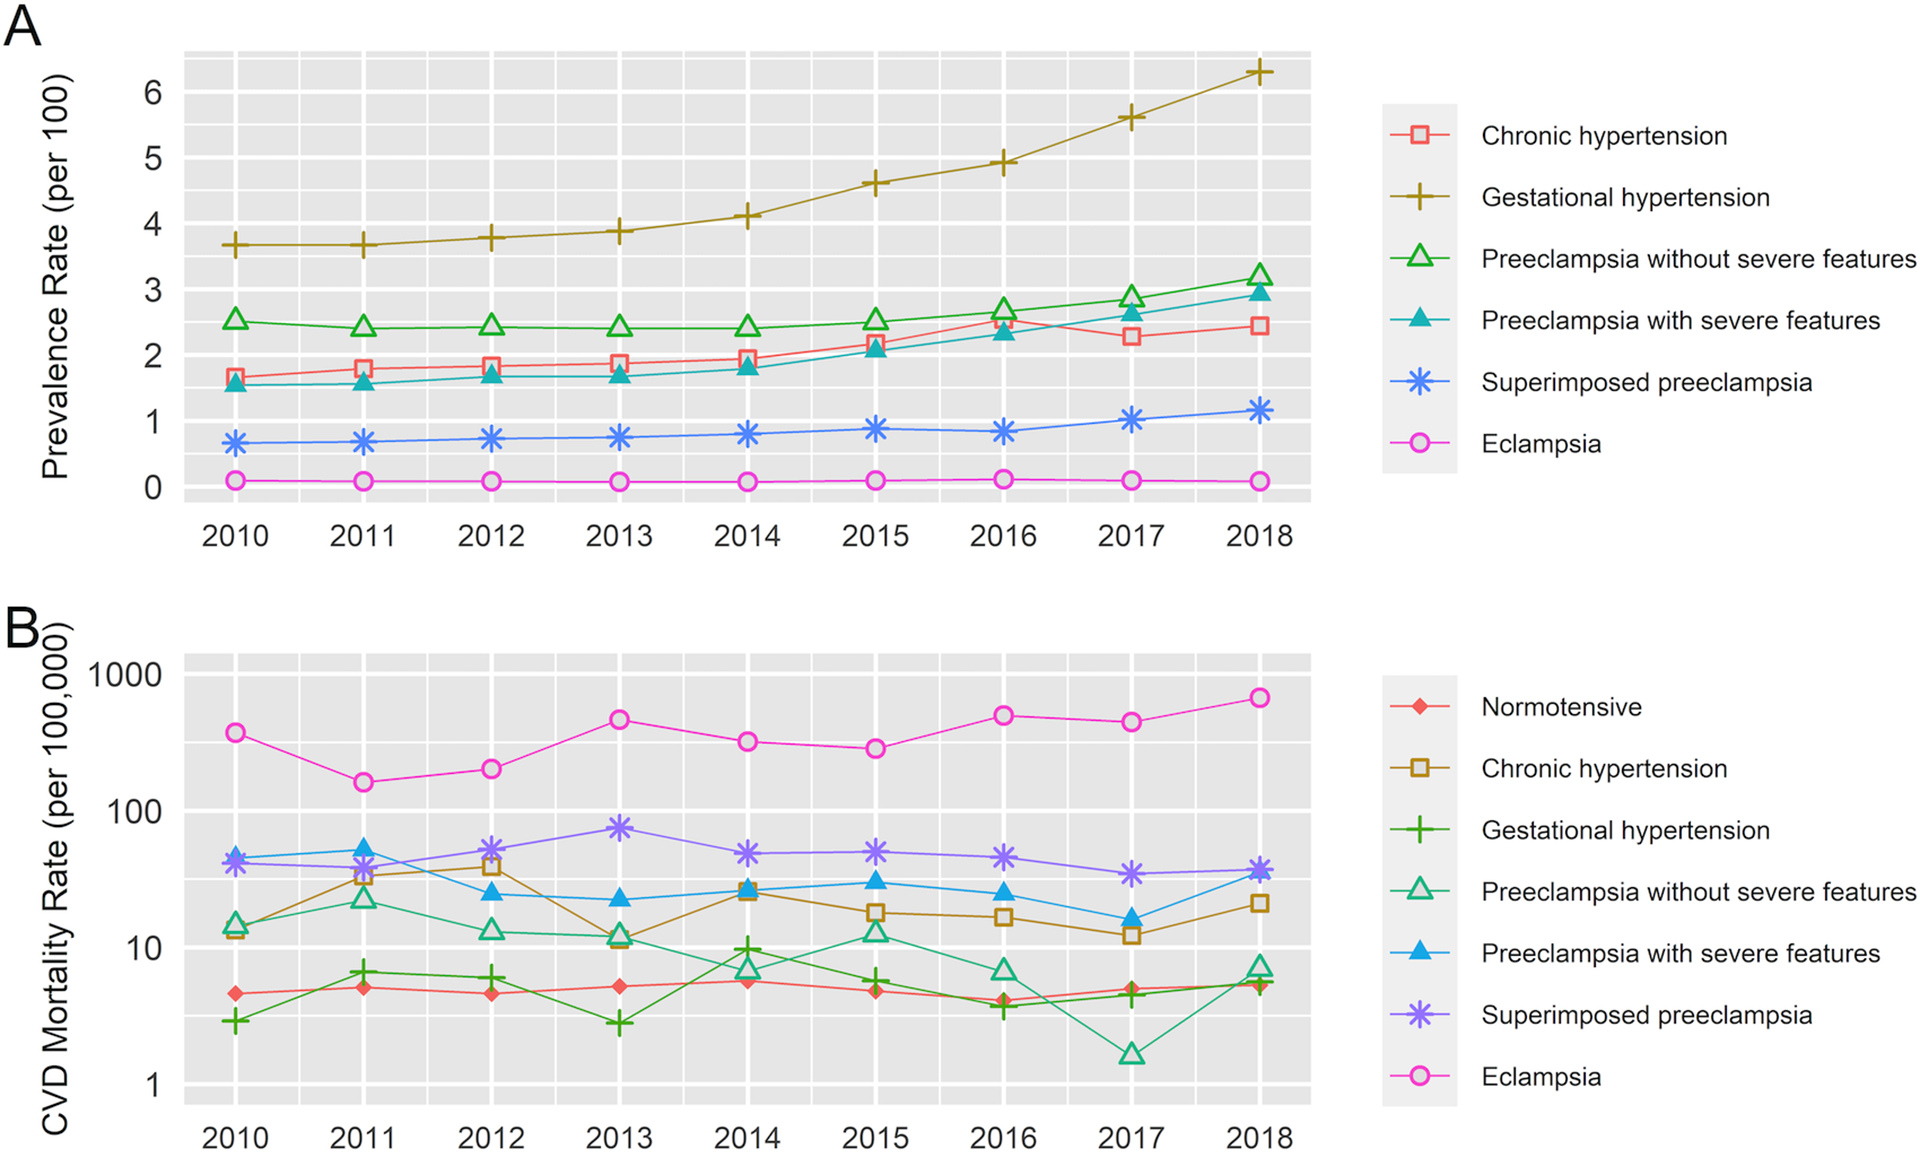
Prevalence rates of hypertensive disorders of pregnancy from 2010 to 2018 (panel A), and pregnancy-associated mortality rates from cardiovascular disease in relation to hypertensive disorders of pregnancy over time (panel B): Nationwide Readmissions Database, 2010–2018
PMRs were higher for HD death and stroke mortality among patients with HDPs compared with normotensive patients (except for patients with gestational hypertension; Table 2). Patients with eclampsia had the highest CVD (381 per 100,000) and stroke PMRs (190 per 100,000). The PMRs for patients with gestational hypertension and normotensive patients were similar.
Table 2.
Pregnancy-associated mortality rates (per 100,000 hospitalisations) for all-cause deaths and cause-specific deaths in relation to patients diagnosed with hypertensive disorders of pregnancy: Nationwide Readmissions Database, 2010–2018
| Hypertensive Disorders of Pregnancy | Number of delivery hospitalisations (Rate per 100) | Person-months (Median follow-up time, 95% CI) | Number of in hospital deaths (pregnancy associated mortality rate per 100,000 hospitalisations) | |||
|---|---|---|---|---|---|---|
| All-Cause | Cardiovascular Disease | Heart Disease | Stroke | |||
| Normotensive | 29,728,769 (89.0) | 5.87 (5.86, 5.87) | 2218 (8) | 1463 (5) | 1336 (5) | 236 (1) |
| Chronic hypertension | 622,434 (2.1) | 5.80 (5.77, 5.83) | 170 (27) | 129 (21) | 105 (17) | 39 (6) |
| Gestational hypertension | 1,395,990 (4.5) | 5.90 (5.88, 5.92) | 108 (8) | 73 (5) | 66 (5) | 16 (1) |
| Preeclampsia without severe features | 788,764 (2.6) | 5.99 (5.96, 6.01) | 126 (16) | 82 (10) | 70 (9) | 17 (2) |
| Preeclampsia with severe features | 607,617 (2.0) | 5.80 (5.77, 5.83) | 273 (45) | 181 (30) | 134 (22) | 61 (10) |
| Superimposed preeclampsia | 248,821 (0.8) | 5.83 (5.79, 5.87) | 142 (57) | 115 (46) | 98 (39) | 30 (12) |
| Eclampsia | 25,341 (0.1) | 5.91 (5.77, 6.04) | 114 (451) | 97 (381) | 64 (251) | 48 (190) |
Compared with normotensive patients, there was an excess of 17 (95% CI 12, 23) deaths per 100,000 for HD and 9 (95% CI 5, 13) deaths per 100,000 for stroke among those with preeclampsia with severe features (Table S5). These excess PMRs were higher among patients with superimposed preeclampsia with the highest excess among patients with eclampsia.
Adjusted Mortality Risks
The adjusted overall and cause-specific risks of PMR within the calendar year of delivery were elevated for all HDPs except for gestational hypertension. Risks increased progressively among patients with HDP severity. Patients with chronic hypertension had higher risks than patients with preeclampsia without severe features but lower risks than patients with preeclampsia with severe features (Table 3; unadjusted HRs in Table S6). Those with eclampsia had a 58.6-fold increased risk for CVD mortality compared with normotensive patients, with stronger associations for stroke than HD death. Notably, stroke mortality risks on a relative scale (i.e., compared with risks among normotensive patients, Table 3) were higher than HD mortality risks across all HDP (although absolute risks of HD death were higher than that of stroke, Table 2).
Table 3.
Associations between hypertensive disorders of pregnancy and all-cause and cause-specific pregnancy associated mortality within the calendar year of delivery: Nationwide Readmissions Database, 2010–2018
| Hypertensive Disorders of Pregnancy | Adjusted hazard ratio (95% confidence interval) of pregnancy associated mortality | |||
|---|---|---|---|---|
| All-Cause Mortality | Cardiovascular Disease Mortality | Heart Disease Mortality | Stroke Mortality | |
| Normotensive | 1.00 (Reference) | 1.00 (Reference) | 1.00 (Reference) | 1.00 (Reference) |
| Chronic hypertension | 2.38 (1.78, 3.18) | 2.71 (1.94, 3.78) | 2.38 (1.63, 3.47) | 5.66 (3.06, 10.46) |
| Gestational hypertension | 0.97 (0.73, 1.29) | 1.02 (0.72, 1.44) | 0.99 (0.69, 1.43) | 1.18 (0.52, 2.67) |
| Preeclampsia without severe features | 1.98 (1.46, 2.68) | 1.96 (1.33, 2.91) | 1.82 (1.20, 2.77) | 2.45 (0.98, 6.16) |
| Preeclampsia with severe features | 4.93 (3.85, 6.32) | 4.88 (3.71, 6.41) | 3.94 (2.89, 5.36) | 9.44 (5.48, 16.25) |
| Superimposed preeclampsia | 4.53 (3.32, 6.19) | 5.26 (3.75, 7.38) | 4.81 (3.32, 6.97) | 8.29 (4.20, 16.38) |
| Eclampsia | 45.51 (33.61, 61.61) | 58.55 (41.77, 82.08) | 39.76 (25.94, 60.96) | 170.85 (95.23, 306.50) |
Hazards ratios were adjusted for the confounding effects of assisted reproductive technology conception, pre-pregnancy diabetes, multiple gestation, maternal age, hospital bed size, hospital type, hospital teaching status income quartile, insurance, and year of delivery through the Cox proportional hazards regression model
See Table S11 for E-Values
HD and stroke mortality risks progressively increased up to one year following delivery for chronic hypertension and preeclampsia without severe features, while risks decreased for preeclampsia with severe features and eclampsia (Figures 3 and 4 and Tables 2, S7–S10). Stroke mortality risk was greatest at delivery (0 days) for preeclampsia with severe features (HR 23.11, 95% CI 10.70, 49.92), superimposed preeclampsia (HR 12.61, 95% CI 3.79, 41.92), and eclampsia (HR 363.25, 95% CI 153.44, 859.93) (Table S10).
Figure 3.
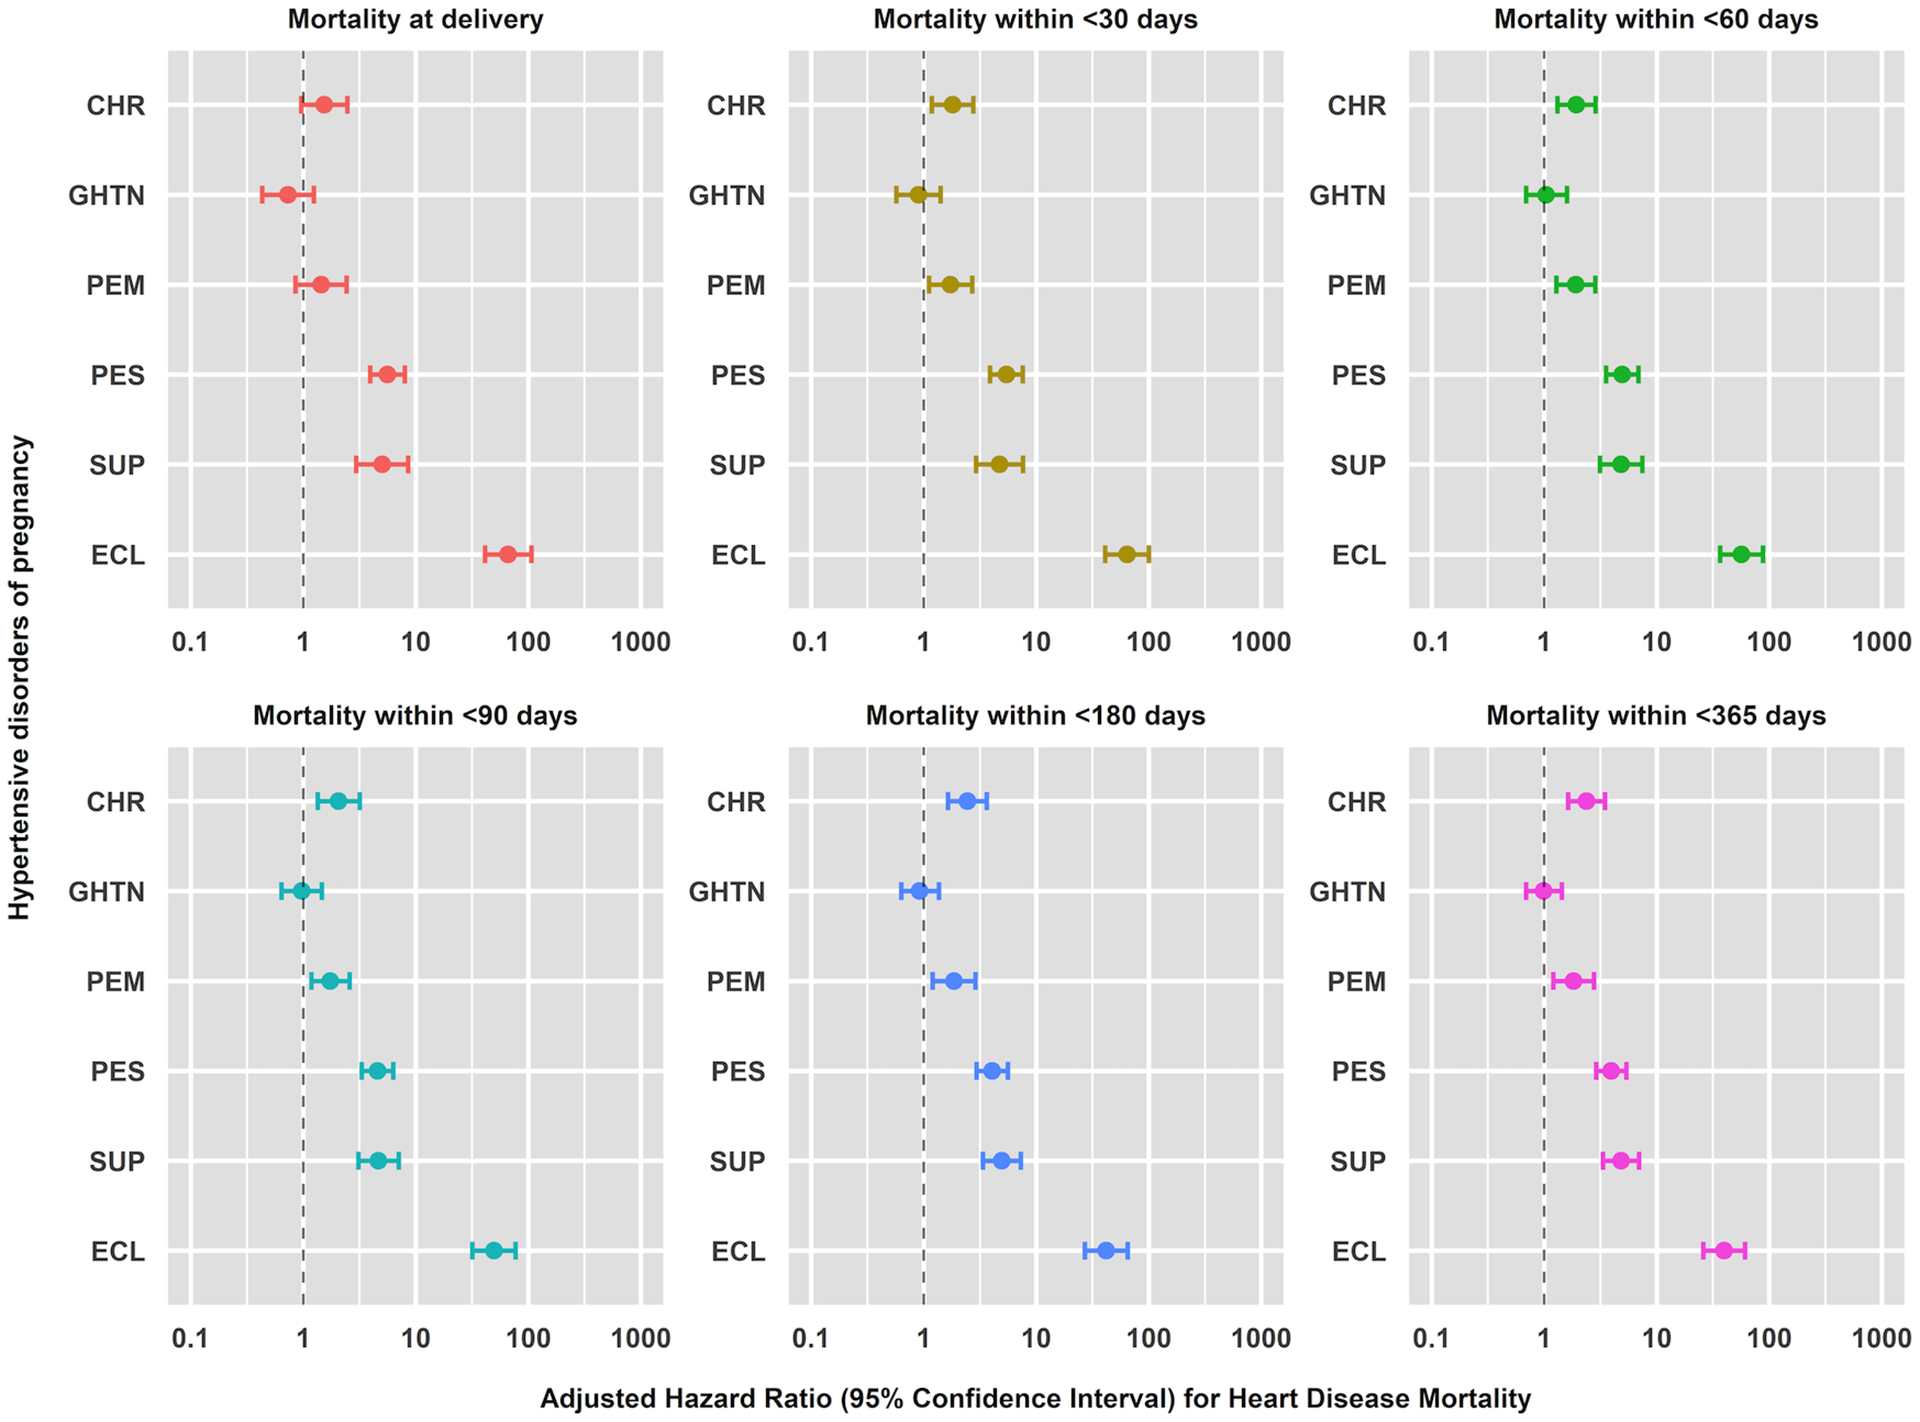
Cumulative adjusted hazard ratios with 95% confidence interval of pregnancy-associated heart disease mortality rates from at delivery (0 days) and within <30, <60, <90, <180, and <365 days following delivery in relation to hypertensive disorders of pregnancy.
Hazards ratios were adjusted for the confounding effects of assisted reproductive technology (ART) conception, pre-pregnancy diabetes, multiple gestation, maternal age, hospital bed size, hospital type, hospital teaching status income quartile, insurance, and year of delivery through a discrete-time Cox proportional hazards regression model: Nationwide Readmissions Database, 2010–2018
Figure 4.
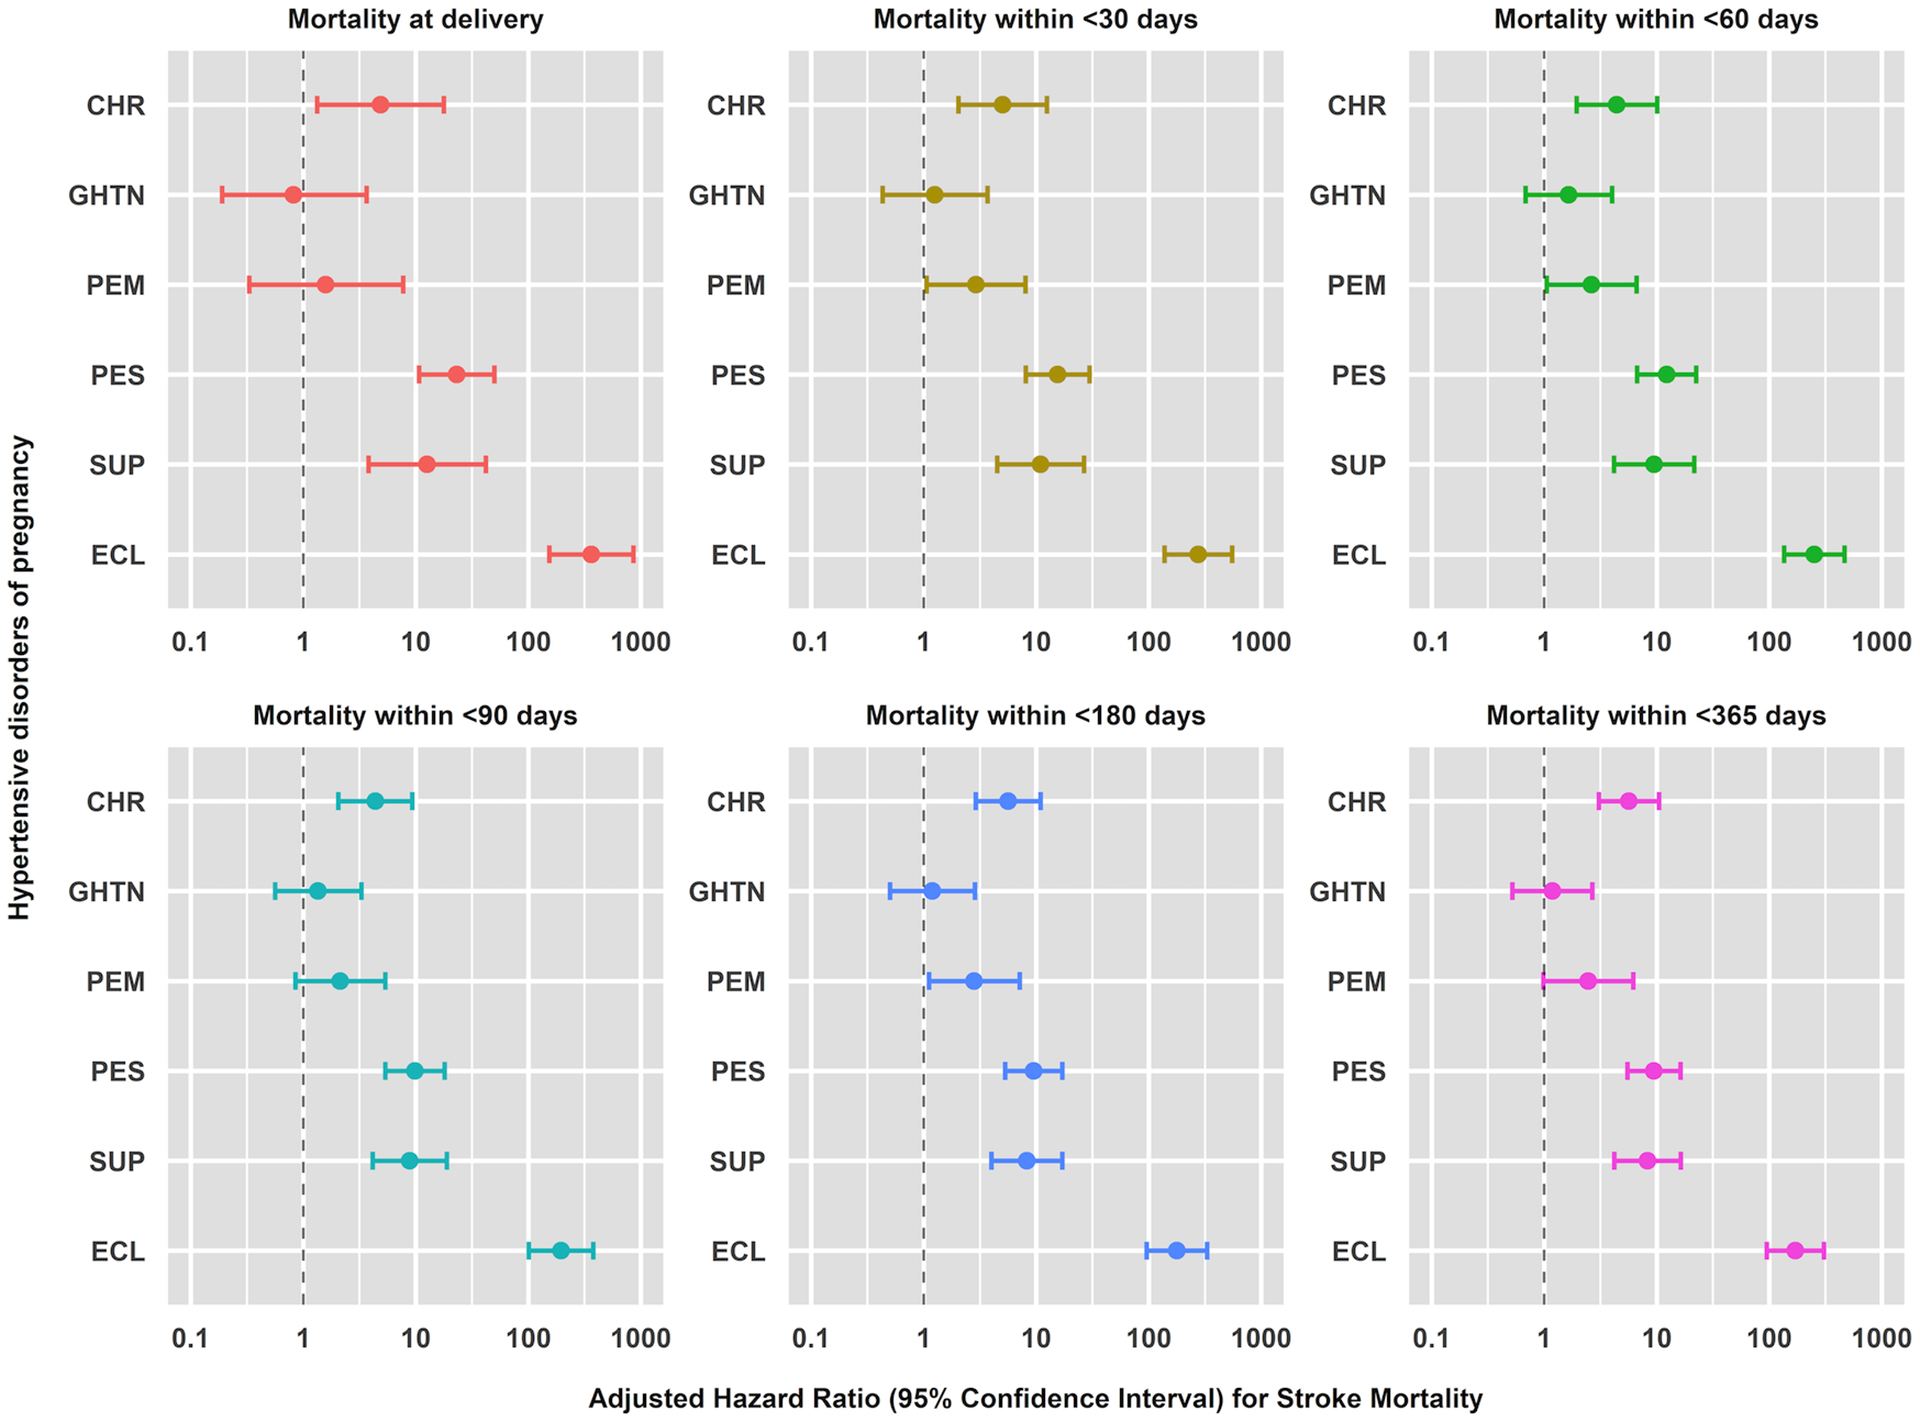
Cumulative adjusted hazard ratios with 95% confidence interval of pregnancy-associated stroke mortality rates at delivery (0 days) and within <30, <60, <90, <180, and <365 days following delivery in relation to hypertensive disorders of pregnancy: Nationwide Readmissions Database, 2010–2018
Hazards ratios were adjusted for the confounding effects of assisted reproductive technology (ART) conception, pre-pregnancy diabetes, multiple gestation, maternal age, hospital bed size, hospital type, hospital teaching status income quartile, insurance, and year of delivery through a discrete-time Cox proportional hazards regression model.
Sensitivity Analysis
The high E-values and 95% CI for all-cause and cause-specific PMRs in relation to chronic hypertension, preeclampsia with and without severe features, superimposed preeclampsia, and eclampsia suggest that bias due to unmeasured confounders is an unlikely explanation for the observed effects (Table S11). HRs were similar after adjusting for the confounding of delivery month i.e., bias due to secular changes in the distribution of deaths during the follow-up period did not appear to affect the associations between HDP and CVD-related deaths.
Comment
Principal findings
This large population-based study reveals several important associations between HDP and PMRs. HD- and stroke-related PMRs were high among patients diagnosed with HDP, particularly eclampsia, with increased risks evident at delivery and persisting one year postpartum. Those with gestational hypertension appeared to have similar risks of CVD mortality as normotensive patients one year after delivery, but stroke risks were elevated at <365 days postpartum. In general, HDP carried a substantially increased risk of CVD-related PMR and appeared to have a more profound relative impact on stroke than HD-related PMR.
Strengths of the study
Studies have shown that more than one-third of eclampsia cases occur acutely (with no signs or symptoms of preeclampsia preceding the seizures), approximately 20% of eclampsia cases occur in the setting of mild hypertension, and blood pressure may be normal in 25% of patients, so the degree of hypertension may not predict eclampsia.30–34 In addition, this evaluation of in-hospital mortality likely provides more accurate CVD-related PMR than rates obtained from vital registration data which relies on the standardised pregnancy checkbox on death certificates. The NRD does not share the same potential inflation of PMRs due to the pregnancy checkbox issue previously observed with death certificate data.35 Finally, the large, nationally representative sample allows for the generalisability of HDP and CVD pregnancy-associated mortality associations in the United States.
Limitations of the data
The NRD only included hospitalisations up to one calendar year following the admission date; out-of-hospital maternal deaths and deaths beyond the calendar year but within one year postpartum could not be evaluated. This could result in lower PMRs due to shorter follow up for deliveries at the later end of the calendar year. The hospitalised PMR in the NRD from 2010–2018 (9.4 per 100,000) was lower than the estimate reported by National Center for Health Statistics (17.4 per 100,000 in 2018).3 However, studies using an alternative approach and only accounting for deaths with pregnancy or postpartum causes listed among the multiple causes of death36 have also shown a lower PMR (7.9 in 2016–1736 and 9.6 per 100,000 live births from 2018–202037), similar to the in-hospital PMR reported in this study. Furthermore, since an underlying cause of death was not available in the NRD, we studied pregnancy-associated mortality due to CVD using NRD-identified deaths coupled with the appropriate ICD-coded diagnoses at the time of death. This analysis was limited to studying the impact of each HDP on CVD PMR, while ongoing studies are being conducted to evaluate the association between chronic hypertension,38 preeclampsia, and eclampsia on short-term CVD morbidity (unpublished). Additionally, since only month and year were available in the data, it could not be determined whether the deaths occurred within 42 days of pregnancy, so risk at 42 days was not reported due to potential misclassification. Finally, we were unable to account for multiple pregnancies across years to the same woman since the NRD data does not link women across years.
Accuracy of ICD coding and underreporting of preexisting hypertension could contribute to the misclassification of risks for CVD mortality attributed to HDP.39 Data from the National Inpatient Sample from 2017 to 2019 showed a higher prevalence of HDP amongst Black women (20.9%) compared with people who were White (14.7%), Hispanic (12.5%), Asian or Pacific Islander (9.3%), other (12.0%), or missing race (12.7%) in the United States.40 Studies have reported 3–5 times higher PMRs for Black women compared with White, Asian, Native Hawaiian, or Other Pacific Islander women.21,41,42 These associations between race/ethnicity, pre-pregnancy obesity, parity, HDP, and pregnancy-associated mortality could not be examined using the NRD owing to the absence of relevant data elements. Nevertheless, the reported E-values suggest unmeasured confounders are unlikely to explain away the powerful associations noted here.
Interpretation
CVD accounts for most maternal deaths. Some deaths could occur due to lack of symptom recognition and delays in diagnosis43 since most people who die from CVD during pregnancy or postpartum do not have a prior diagnosis of CVD.44 With about 68% of pregnancy-related deaths caused by CVD deemed to be preventable,45 there is a need for consensus on PMR prevention efforts related to CVD.46 Patients with HDP have a higher risk of subsequent CVD, and evidence-based guidelines recommend that HDP should be considered a part of a comprehensive CVD risk assessment.47,48 Pregnant persons with HDP, especially those with preexisting hypertension, need high-quality care as heart failure and related cardiac symptoms can be confused with common symptoms of normal pregnancy, and delays in diagnosis are associated with an increased incidence of preventable complications.49 Early identification and optimal treatment of HDPs, especially preeclampsia-eclampsia, are key for the primary prevention of maternal stroke.50
Recent trends in MMR in the US show a decline in preeclampsia/eclampsia-related mortality but an increase in chronic hypertension-related mortality.21,35 Interventions to prevent preeclampsia-related deaths such as low-dose aspirin for patients at high risk of preeclampsia during pregnancy,51 early delivery for early-onset preeclampsia,52 and magnesium sulfate to help prevent postpartum seizures53 may contribute to the observed decline in short-term CVD mortality risk. Furthermore, preexisting hypertension is a risk factor for CVD maternal mortality as such hypertension has been shown to increase the risk for early-onset preeclampsia and late-onset preeclampsia by 10- and 5-fold, respectively.52
A Canadian study (1989–2016) observed increased risks of short- and long-term mortality associated with preeclampsia/eclampsia in the period from delivery up to 42 days postpartum (HR 1.56, 95% CI 1.27, 1.92), 43 days–11 months (HR 1.44, 95% CI 0.35, 5.85), and also 43 days to 29 years after delivery (HR 1.36, 95% CI 1.08, 1.70).54 Our study showed substantially higher relative rates (RRs) of stroke compared with RRs of HD death in eclampsia patients. Although RRs of stroke were also much higher in pre-eclampsia patients (compared with RRs of HD), the RRs of both stroke and HD were much lower among pre-eclampsia patients compared with eclampsia patients. A meta-analysis revealed few studies have examined the association between chronic hypertension/superimposed preeclampsia and long-term haemorrhagic or ischaemic stroke compared with studies on preeclampsia and gestational hypertension.55 Our study addresses this research gap and shows how each HDP impacts CVD (and subtype)-related mortality. Discrete-time Cox regression models bring a new perspective on the temporal risk of each HDP and pregnancy-associated death, especially at the time of delivery and up to one year after delivery. A population-based cohort study in the Netherlands with a median follow-up time of 11.2 years showed that patients with preeclampsia and gestational hypertension in the first pregnancy had higher risks of long-term CVD mortality (HR 1.65, 95% CI 1.48–1.83 and HR 2.22, 95% CI 1.91–2.57, respectively) compared with normotensive patients.56 Our study highlights associations between HDP and CVD mortality apparent even at delivery for patients with chronic hypertension, preeclampsia with and without severe features, superimposed preeclampsia, and eclampsia.
In 2018, ACOG recommended that all patients should have contact with their obstetrical care providers within the first 3 weeks postpartum, with ongoing care as needed, and concluding with a visit no later than 12 weeks postpartum. This process of care on a continuum is a new paradigm different from the traditional recommendation for a postpartum visit at 4–6 weeks, and reinforces the importance of care in the “fourth trimester.”57 However, our study shows that serious risk extends up to one year; consequently, ongoing care for patients with HDPs is needed beyond the fourth trimester. The 2013 ACOG Task Force on Hypertension in Pregnancy provided extensive guidelines for the management of HDP during pregnancy but only a short summary of later-life CVD risk in women with preeclampsia.58 Guidelines for ongoing care up to one postpartum year are needed for each HDP. The 2017 American College of Cardiology/ American Heart Association Task Force on the management of high blood pressure recommended the same interventions for pregnant persons with severe preeclampsia or eclampsia.59 Our results suggest distinctions be made between people with preeclampsia versus eclampsia since people with eclampsia have much higher risks for stroke and HD mortality than those with preeclampsia. Moreover, guidelines are needed for people with superimposed preeclampsia as temporal risks for CVD mortality are different from those with preeclampsia in the absence of preexisting hypertension. Thus, timely follow-up and individualised care are necessary during the one year postpartum (and possibly beyond).
Conclusions
HDPs are strong risk factors for pregnancy-associated death due to CVD both during pregnancy and in the year after delivery. Each HDP demonstrates a different postpartum risk for CVD mortality and varying strengths of association. It is important to note that while absolute PMRs are low, pregnancy-associated deaths due to CVD are an important cause of such preventable deaths. Our study underscores the importance of improving pregnancy and postpartum care and supports the extension of care beyond the puerperium up to at least one year after delivery for patients with specific HDPs.
Supplementary Material
Synopsis.
Study question
What is the association between hypertensive disorders of pregnancy (HDP) and pregnancy-associated mortality from cardiovascular disease (CVD) at delivery and within one year postpartum?
What is already known
Rates of maternal mortality and HDPs have been increasing in the United States. CVD is implicated in about 30% of maternal deaths worldwide, and HDP has been associated with long-term CVD mortality.
What this study adds
Patients with HDP have an elevated risk of pregnancy-associated mortality from CVD compared with normotensive patients. Risks are evident at delivery, and postpartum risk varies with HDP severity. This study distinguishes between heart disease (HD) and stroke death risks for eclampsia and preeclampsia. While absolute mortality rates associated with chronic hypertension and preeclampsia are higher for HD than stroke, the relative risks for stroke mortality are higher than those for HD mortality among patients with versus without hypertension.
Funding
Dr. Ananth and Ms. Lee are supported, in part, by the National Heart, Lung, and Blood Institute (grant R01-HL150065). Dr. Ananth is additionally supported, in part, by the National Institute of Environmental Health Sciences (grant R01-ES033190). Dr. Joseph’s work is supported by an Investigator award from the BC Children’s Hospital Research Institute.
Footnotes
Disclosures
None.
Data sharing statement
All data utilised in this study can be accessed from the Healthcare Cost and Utilization Project (https://www.hcup-us.ahrq.gov/).
References
- 1.Hoyert DL. Maternal mortality rates in the United States, 2021. NCHS Health E-Stats. 2023. doi: DOI: 10.15620/cdc:124678. [DOI] [Google Scholar]
- 2.Hirshberg A, Srinivas SK. Epidemiology of maternal morbidity and mortality. Semin Perinatol. 2017;41:332–337. doi: 10.1053/j.semperi.2017.07.007 [DOI] [PubMed] [Google Scholar]
- 3.Declercq E, Zephyrin L. Maternal Mortality in the United States: A Primer. 2020.
- 4.Collier AY, Molina RL. Maternal Mortality in the United States: Updates on Trends, Causes, and Solutions. Neoreviews. 2019;20:e561–e574. doi: 10.1542/neo.20-10-e561 [DOI] [PMC free article] [PubMed] [Google Scholar]
- 5.Hoyert DL, Minino AM. Maternal Mortality in the United States: Changes in Coding, Publication, and Data Release, 2018. Natl Vital Stat Rep. 2020;69:1–18. [PubMed] [Google Scholar]
- 6.Joseph KS, Lisonkova S, Muraca GM, Razaz N, Sabr Y, Mehrabadi A, Schisterman EF. Factors Underlying the Temporal Increase in Maternal Mortality in the United States. Obstet Gynecol. 2017;129:91–100. doi: 10.1097/AOG.0000000000001810 [DOI] [PMC free article] [PubMed] [Google Scholar]
- 7.Hoyert DL, Uddin SFG, Minino AM. Evaluation of the Pregnancy Status Checkbox on the Identification of Maternal Deaths. Natl Vital Stat Rep. 2020;69:1–25. [PubMed] [Google Scholar]
- 8.Rossen LM, Womack LS, Hoyert DL, Anderson RN, Uddin SFG. The Impact of the Pregnancy Checkbox and Misclassification on Maternal Mortality Trends in the United States, 1999–2017. Vital Health Stat 3. 2020:1–61. [PubMed] [Google Scholar]
- 9.Vahedi FA, Gholizadeh L, Heydari M. Hypertensive Disorders of Pregnancy and Risk of Future Cardiovascular Disease in Women. Nurs Womens Health. 2020;24:91–100. doi: 10.1016/j.nwh.2020.02.001 [DOI] [PubMed] [Google Scholar]
- 10.Grodzinsky A, Schmidt L. Cardiovascular Contribution to Maternal Mortality. Cardiol Clin. 2021;39:1–5. doi: 10.1016/j.ccl.2020.09.001 [DOI] [PubMed] [Google Scholar]
- 11.Trost SL, Beauregard J, Chandra G, Njie F, Berry J, Harvey A, et al. Pregnancy-Related Deaths: Data from Maternal Mortality Review Committees in 36 US States, 2017–2019. 2022.
- 12.Lima FV, Yang J, Xu J, Stergiopoulos K. National Trends and In-Hospital Outcomes in Pregnant Women With Heart Disease in the United States. Am J Cardiol. 2017;119:1694–1700. doi: 10.1016/j.amjcard.2017.02.003 [DOI] [PubMed] [Google Scholar]
- 13.Majmundar M, Doshi R, Patel KN, Zala H, Kumar A, Kalra A. Prevalence, trends, and outcomes of cardiovascular diseases in pregnant patients in the USA: 2010–19. Eur Heart J. 2023;44:726–737. doi: 10.1093/eurheartj/ehac669 [DOI] [PubMed] [Google Scholar]
- 14.Wang YX, Arvizu M, Rich-Edwards JW, Wang L, Rosner B, Stuart JJ, et al. Hypertensive Disorders of Pregnancy and Subsequent Risk of Premature Mortality. J Am Coll Cardiol. 2021;77:1302–1312. doi: 10.1016/j.jacc.2021.01.018 [DOI] [PMC free article] [PubMed] [Google Scholar]
- 15.Agrawal A, Wenger NK. Hypertension During Pregnancy. Curr Hypertens Rep. 2020;22:64. doi: 10.1007/s11906-020-01070-0 [DOI] [PubMed] [Google Scholar]
- 16.McNestry C, Killeen SL, Crowley RK, McAuliffe FM. Pregnancy complications and later life women’s health. Acta Obstet Gyn Scan. 2023. doi: 10.1111/aogs.14523 [DOI] [PMC free article] [PubMed] [Google Scholar]
- 17.Theilen LH, Fraser A, Hollingshaus MS, Schliep KC, Varner MW, Smith KR, Esplin MS. All-Cause and Cause-Specific Mortality After Hypertensive Disease of Pregnancy. Obstet Gynecol. 2016;128:238–244. doi: 10.1097/AOG.0000000000001534 [DOI] [PMC free article] [PubMed] [Google Scholar]
- 18.Gestational Hypertension and Preeclampsia: ACOG Practice Bulletin Summary, Number 222. Obstetrics & Gynecology. 2020;135:1492–1495. doi: 10.1097/aog.0000000000003892 [DOI] [PubMed] [Google Scholar]
- 19.Wallis AB, Saftlas AF, Hsia J, Atrash HK. Secular trends in the rates of preeclampsia, eclampsia, and gestational hypertension, United States, 1987–2004. Am J Hypertens. 2008;21:521–526. doi: 10.1038/ajh.2008.20 [DOI] [PubMed] [Google Scholar]
- 20.Ananth CV, Keyes KM, Wapner RJ. Pre-eclampsia rates in the United States, 1980–2010: age-period-cohort analysis. BMJ. 2013;347:f6564. doi: 10.1136/bmj.f6564 [DOI] [PMC free article] [PubMed] [Google Scholar]
- 21.Ananth CV, Brandt JS, Hill J, Graham HL, Grover S, Schuster M, et al. Historical and Recent Changes in Maternal Mortality Due to Hypertensive Disorders in the United States, 1979 to 2018. Hypertension. 2021;78:1414–1422. doi: 10.1161/HYPERTENSIONAHA.121.17661 [DOI] [PMC free article] [PubMed] [Google Scholar]
- 22.NRD Nationwide Readmissions Database (NRD). In: Healthcare Cost and Utilization Project (HCUP). Agency for Healthcare Reserach and Quality; 2010–2017. [Google Scholar]
- 23.NRD Database Documentation Archive. In: Healthcare Cost and Utilization Project (HCUP). Rockville, MD: Agency for Healthcare Research and Quality. [PubMed] [Google Scholar]
- 24.Gestational Hypertension and Preeclampsia: ACOG Practice Bulletin, Number 222. Obstet Gynecol. 2020;135:e237–e260. doi: 10.1097/AOG.0000000000003891 [DOI] [PubMed] [Google Scholar]
- 25.Maternal Death Survillance and Response Technical Guidance. 2013.
- 26.Creanga AA, Berg CJ, Ko JY, Farr SL, Tong VT, Bruce FC, Callaghan WM. Maternal mortality and morbidity in the United States: where are we now? J Womens Health (Larchmt). 2014;23:3–9. doi: 10.1089/jwh.2013.4617 [DOI] [PMC free article] [PubMed] [Google Scholar]
- 27.HCUP NRD Description of Data Elements. Agency for Healthcare Research and Quality; https://hcup-us.ahrq.gov/db/vars/hosp_bedsize/nrdnote.jsp. Accessed October 5, 2023. [Google Scholar]
- 28.HCUP NRD Description of Data Elements. Agency for Healthcare Research and Quality; https://hcup-us.ahrq.gov/db/vars/zipinc_qrtl/nrdnote.jsp. Accessed 5 October 2023. [Google Scholar]
- 29.Mathur MB, Ding P, Riddell CA, VanderWeele TJ. Web Site and R Package for Computing E-values. Epidemiology. 2018;29:e45–e47. doi: 10.1097/EDE.0000000000000864 [DOI] [PMC free article] [PubMed] [Google Scholar]
- 30.Gestational Hypertension and Preeclampsia: ACOG Practice Bulletin, Number 222. Obstetrics & Gynecology. 2020;135:e237–e260. doi: 10.1097/aog.0000000000003891 [DOI] [PubMed] [Google Scholar]
- 31.Wilkerson RG, Ogunbodede AC. Hypertensive Disorders of Pregnancy. Emerg Med Clin North Am. 2019;37:301–316. doi: 10.1016/j.emc.2019.01.008 [DOI] [PubMed] [Google Scholar]
- 32.Boushra M, Natesan SM, Koyfman A, Long B. High risk and low prevalence diseases: Eclampsia. Am J Emerg Med. 2022;58:223–228. doi: 10.1016/j.ajem.2022.06.004 [DOI] [PubMed] [Google Scholar]
- 33.Berhan Y, Berhan A. Should magnesium sulfate be administered to women with mild pre-eclampsia? A systematic review of published reports on eclampsia. J Obstet Gynaecol Res. 2015;41:831–842. doi: 10.1111/jog.12697 [DOI] [PubMed] [Google Scholar]
- 34.Sibai BM, Stella CL. Diagnosis and management of atypical preeclampsia-eclampsia. Am J Obstet Gynecol. 2009;200:481 e481–487. doi: 10.1016/j.ajog.2008.07.048 [DOI] [PubMed] [Google Scholar]
- 35.Joseph KS, Boutin A, Lisonkova S, Muraca GM, Razaz N, John S, et al. Maternal Mortality in the United States Recent Trends, Current Status, and Future Considerations. Obstetrics and Gynecology. 2021;137:763–771. doi: 10.1097/Aog.0000000000004361 [DOI] [PMC free article] [PubMed] [Google Scholar]
- 36.MacDorman MF, Thoma M, Declcerq E, Howell EA. Racial and Ethnic Disparities in Maternal Mortality in the United States Using Enhanced Vital Records, 2016‒2017. Am J Public Health. 2021;111:1673–1681. doi: 10.2105/AJPH.2021.306375 [DOI] [PMC free article] [PubMed] [Google Scholar]
- 37.Joseph KS, Lisonkova S, Boutin A, Muraca GM, Razaz N, John S, Sabr Y, et al. Maternal mortality in the United States: Are the high and rising rates due to changes in obstetric factors, maternal medical conditions or maternal mortality surveillance? . Am J Obstet Gynecol. 2024. (In press). [DOI] [PubMed] [Google Scholar]
- 38.Rosenfeld EB, Brandt JS, Fields JC, Lee R, Graham HL, Sharma R, Ananth CV. Chronic Hypertension and the Risk of Readmission for Postpartum Cardiovascular Complications. In: The Green Journal; 2023. [DOI] [PMC free article] [PubMed] [Google Scholar]
- 39.Garovic VD, White WM, Vaughan L, Saiki M, Parashuram S, Garcia-Valencia O, et al. Incidence and Long-Term Outcomes of Hypertensive Disorders of Pregnancy. J Am Coll Cardiol. 2020;75:2323–2334. doi: 10.1016/j.jacc.2020.03.028 [DOI] [PMC free article] [PubMed] [Google Scholar]
- 40.Ford ND, Cox S, Ko JY, Ouyang L, Romero L, Colarusso T, et al. Hypertensive Disorders in Pregnancy and Mortality at Delivery Hospitalization - United States, 2017–2019. MMWR Morb Mortal Wkly Rep. 2022;71:585–591. doi: 10.15585/mmwr.mm7117a1 [DOI] [PMC free article] [PubMed] [Google Scholar]
- 41.Fleszar LG, Bryant AS, Johnson CO, Blacker BF, Aravkin A, Baumann M, et al. Trends in State-Level Maternal Mortality by Racial and Ethnic Group in the United States. JAMA. 2023;330:52–61. doi: 10.1001/jama.2023.9043 [DOI] [PMC free article] [PubMed] [Google Scholar]
- 42.Petersen EE, Davis NL, Goodman D, Cox S, Syverson C, Seed K, Shapiro-Mendoza C, et al. Racial/Ethnic Disparities in Pregnancy-Related Deaths - United States, 2007–2016. MMWR Morb Mortal Wkly Rep. 2019;68:762–765. doi: 10.15585/mmwr.mm6835a3 [DOI] [PMC free article] [PubMed] [Google Scholar]
- 43.ACOG Practice Bulletin No. 212: Pregnancy and Heart Disease. Obstetrics & Gynecology. 2019;133:e320–e356. doi: 10.1097/aog.0000000000003243 [DOI] [PubMed] [Google Scholar]
- 44.Chambers ME, De Zoysa MY, Hameed AB. Screening for Cardiovascular Disease in Pregnancy: Is There a Need? J Cardiovasc Dev Dis. 2022;9. doi: ARTN 8910.3390/jcdd9030089 [DOI] [PMC free article] [PubMed] [Google Scholar]
- 45.Ouyang P, Sharma G. The Potential for Pregnancy Heart Teams to Reduce Maternal Mortality in Women With Cardiovascular Disease. Journal of the American College of Cardiology. 2020;76:2114–2116. doi: 10.1016/j.jacc.2020.09.007 [DOI] [PubMed] [Google Scholar]
- 46.Knight M, Joseph KS. Severe maternal morbidity and maternal mortality: A need for consensus on concepts and prevention efforts. Paediatr Perinat Ep. 2020;34:377–378. doi: 10.1111/ppe.12676 [DOI] [PubMed] [Google Scholar]
- 47.Shah LM, Varma B, Nasir K, Walsh MN, Blumenthal RS, Mehta LS, Sharma G. Reducing disparities in adverse pregnancy outcomes in the United States. Am Heart J. 2021;242:92–102. doi: 10.1016/j.ahj.2021.08.019 [DOI] [PubMed] [Google Scholar]
- 48.Varagic J, Desvigne-Nickens P, Gamble-George J, Hollier L, Maric-Bilkan C, Mitchell M, Pemberton VL, Redmond N. Maternal Morbidity and Mortality: Are We Getting to the “Heart” of the Matter? J Womens Health. 2021;30:178–186. doi: 10.1089/jwh.2020.8852 [DOI] [PMC free article] [PubMed] [Google Scholar]
- 49.Davis MB, Arany Z, McNamara DM, Goland S, Elkayam U. Peripartum Cardiomyopathy: JACC State-of-the-Art Review. J Am Coll Cardiol. 2020;75:207–221. doi: 10.1016/j.jacc.2019.11.014 [DOI] [PubMed] [Google Scholar]
- 50.Elgendy IY, Bukhari S, Barakat AF, Pepine CJ, Lindley KJ, Miller EC. Maternal Stroke A Call for Action. Circulation. 2021;143:727–738. doi: 10.1161/Circulationaha.120.051460 [DOI] [PMC free article] [PubMed] [Google Scholar]
- 51.Parikh NI, Gonzalez JM, Anderson CAM, Judd SE, Rexrode KM, Hlatky MA, Gunderson EP, Stuart JJ, Vaidya D, American Heart Association Council on E, et al. Adverse Pregnancy Outcomes and Cardiovascular Disease Risk: Unique Opportunities for Cardiovascular Disease Prevention in Women: A Scientific Statement From the American Heart Association. Circulation. 2021;143:e902–e916. doi: 10.1161/CIR.0000000000000961 [DOI] [PubMed] [Google Scholar]
- 52.Lisonkova S, Joseph KS. Incidence of preeclampsia: risk factors and outcomes associated with early- versus late-onset disease. American Journal of Obstetrics and Gynecology. 2013;209. doi: ARTN544.e110.1016/j.ajog.2013.08.019 [DOI] [PubMed] [Google Scholar]
- 53.Fillion A, Guerby P, Menzies D, Lachance C, Comeau MP, Bussieres MC, Doucet-Gingras FA, Zerounian S, Bujold E. Pathological investigation of placentas in preeclampsia (the PEARL study). Hypertens Pregnancy. 2021;40:56–62. doi: 10.1080/10641955.2020.1866008 [DOI] [PubMed] [Google Scholar]
- 54.Ukah UV, Dayan N, Potter BJ, Ayoub A, Auger N. Severe Maternal Morbidity and Risk of Mortality Beyond the Postpartum Period. Obstet Gynecol. 2021;137:277–284. doi: 10.1097/AOG.0000000000004223 [DOI] [PubMed] [Google Scholar]
- 55.Brohan MP, Daly FP, Kelly L, McCarthy FP, Khashan AS, Kublickiene K, Barrett PM. Hypertensive disorders of pregnancy and long-term risk of maternal stroke-a systematic review and meta-analysis. Am J Obstet Gynecol. 2023;229:248–268. doi: 10.1016/j.ajog.2023.03.034 [DOI] [PubMed] [Google Scholar]
- 56.Welters SM, de Boer M, Teunissen PW, Hermes W, Ravelli ACJ, Mol BW, et al. Cardiovascular mortality in women in their forties after hypertensive disorders of pregnancy in the Netherlands: a national cohort study. Lancet Healthy Longev. 2023;4:e34–e42. doi: 10.1016/S2666-7568(22)00292-6 [DOI] [PubMed] [Google Scholar]
- 57.McKinney J, Keyser L, Clinton S, Pagliano C. ACOG Committee Opinion No. 736: Optimizing Postpartum Care. Obstet Gynecol. 2018;132:784–785. doi: 10.1097/AOG.0000000000002849 [DOI] [PubMed] [Google Scholar]
- 58.Hypertension in pregnancy. Report of the American College of Obstetricians and Gynecologists’ Task Force on Hypertension in Pregnancy. Obstet Gynecol. 2013;122:1122–1131. doi: 10.1097/01.AOG.0000437382.03963.88 [DOI] [PubMed] [Google Scholar]
- 59.Whelton PK, Carey RM, Aronow WS, Casey DE, Collins KJ, Himmelfarb CD, et al. 2017 ACC/AHA/AAPA/ABC/ACPM/AGS/APhA/ASH/ASPC/NMA/PCNA Guideline for the Prevention, Detection, Evaluation, and Management of High Blood Pressure in Adults: Executive Summary: A Report of the American College of Cardiology/American Heart Association Task Force on Clinical Practice Guidelines. Circulation. 2018;138:E426–E483. doi: 10.1161/Cir.0000000000000597 [DOI] [PubMed] [Google Scholar]
Associated Data
This section collects any data citations, data availability statements, or supplementary materials included in this article.
Supplementary Materials
Data Availability Statement
All data utilised in this study can be accessed from the Healthcare Cost and Utilization Project (https://www.hcup-us.ahrq.gov/).