

Abstract
Introduction:
Bronchiolitis is a leading indication for pediatric emergency department (ED) visits and hospitalizations. Our objective was to provide a comprehensive review of national trends and epidemiology of ED visits for bronchiolitis from 1993 to 2019 in the U.S.
Methods:
We retrospectively reviewed the National Hospital Ambulatory Medical Care Survey (NHAMCS) reporting of ED visits for bronchiolitis for children age <2 years from 1993–2019. Bronchiolitis cases were identified using billing codes assigned at discharge. The primary outcome was bronchiolitis ED visit rates, calculated using NHAMCS-assigned patient visit weights. We then evaluated for temporal variation in patient characteristics, facility location, and hospitalizations among the bronchiolitis ED visits.
Results:
There were an estimated 8 million ED visits for bronchiolitis for children <2 years between 1993 and 2019. Bronchiolitis ED visits rates ranged from 28–36 per 1000 ED visits from 1993–2010 and increased significantly to 65 per 1000 ED visits in the 2017–2019 time period (p<0.001). There was no significant change over time in patient age, sex, race and ethnicity, insurance status, hospital type or triage level upon ED presentation. Approximately half of bronchiolitis ED visits occurred in the winter months throughout the study period.
Conclusion:
In this analysis of 27 years of national data, we identified a recent rise in ED visit rates for bronchiolitis, which have almost doubled from 2010 to 2019 following a period of relative stability between 1993 and 2010.
Keywords: bronchiolitis, emergency department, trends
Background:
Bronchiolitis is the most common lower acute respiratory infection in children age <2 years and severe cases often necessitate emergency care and/or hospitalization.1 As such, trends in bronchiolitis emergency department (ED) visits and hospitalization are an important indicator of healthcare utilization in this age group. In 2022, the “triple-demic” of RSV, COVID-19 and influenza highlighted the importance of understanding historical trends in pediatric respiratory illnesses to better anticipate pediatric acute care capacity needs.
Several prior studies have investigated trends in ED visits and hospitalizations for bronchiolitis, however studies were performed over varying time periods using different data sources. Early studies using nationally representative data demonstrated that bronchiolitis ED visit rates were stable from 1992–2000,2 and then increased slightly from 2006–2010, mostly due to increased rates for children age 1 year or older.3 No studies have examined bronchiolitis ED visit rates after 2010.
More recent trend analyses have focused on bronchiolitis hospitalizations and intensive care unit (ICU) admissions and have conflicting findings. Nationally representative data from the US and Canada suggest decreasing or stable rates of bronchiolitis hospitalizations over the past decade.4,5 In contrast, two studies evaluating administrative data from US freestanding children’s hospitals both demonstrated a sharp increase in ICU admissions between 2010 and 2019.6,7 However, since most children with bronchiolitis are seen in general hospitals, not freestanding children’s hospitals, it is unclear if these results are generalizable.8
Finally, no single study has examined national ED visit or hospitalization trends over more than a 10-year period. Therefore, our objective was to provide a comprehensive review of national epidemiologic pre-COVID trends for ED visits for bronchiolitis from 1993 to 2019 in the United States.
Methods
Study Design
We performed a serial cross-sectional analysis of ED visits for bronchiolitis for children age <2 years using the 1993–2019 National Hospital Ambulatory Medical Care Survey (NHAMCS). NHAMCS is an annual survey designed to collect data on the utilization and provision of ambulatory care services in acute care and short-stay hospitals in the US. Federal, military, and Veterans Administration hospitals are excluded from data collection. NHAMCS-ED utilizes a four-stage probability sampling design to identify 1) geographically-defined primary sampling units, 2) hospitals within each primary sampling unit, 3) EDs within each hospital, and 4) individual patient encounters within an ED.9 Trained interviewers then collect data on patient characteristics and visit characteristics from all ED encounters during an assigned 4-week period using a structured data entry form.10 Up to three diagnoses were recorded for visits from 1993–2013 and five for visits from 2014–2019. The local institutional review board waived the review of this study.
Study Sample
We included data for all children age <2 years who had an ED visit between 1993–2019. We ended our analysis in 2019 to focus on trends before the COVID-19 pandemic.
Outcomes
The primary outcome was bronchiolitis ED visit rate, calculated as the number of ED visits for bronchiolitis divided by the total number of ED visits for the study population of interest per 3- year time period. Bronchiolitis was defined by use of International Classification of Diseases, Ninth Revision, Clinical Modification (ICD-9-CM) 466.x from 1993–2015 and International Classification of Diseases, Tenth Revision, Clinical Modification (ICD-10-CM) J21.x from 2016 to 2019 in any of the diagnosis fields, consistent with the approach used in prior studies.2–4,11
Patient and Facility Covariates
Other variables of interest included patient demographic factors (age, sex, race, and ethnicity), patient visit characteristics (insurance status, triage severity level, season of visit, and hospitalization), and hospital-level characteristics (hospital urbanicity, geographical region, and patient population served). Locations of EDs were categorized as urban or rural based on the standard metropolitan statistical area, as coded by the U.S. Census Bureau.12 Metropolitan statistical area was not available in the NHAMCS 2012 dataset. We defined a children’s hospital as a hospital where ≥75% of evaluated patients were less than 18 years old, consistent with prior literature.8
Analysis
National point estimates and confidence intervals of categorical variables were calculated using NHAMCS-assigned patient visit weights and presented in thousands. Estimates based on fewer than 30 observations or with a relative standard error greater than 30% were considered unreliable per NHAMCS recommendation and the 95% confidence interval (CI) was not reported. Bronchiolitis ED visit rate was calculated as the estimated number of ED bronchiolitis visits divided by the estimated number of total ED visits (for children age <2 years) and stratified by age (<1 year, 1–1.9 years). Descriptive statistics were obtained for selected covariates associated with ED visits for bronchiolitis. All results were aggregated into 3-year time periods to increase statistical power. Chi-squared test for linear trend was performed to examine temporal changes in bronchiolitis ED visits and associated patient and hospital characteristics, with a two-tail p-value <0.05 considered statistically significant.
A logistic regression model was used to assess if the primary outcome (i.e., ED visit rate for bronchiolitis) changed over the 27-year study period, after adjusting for the patient and facility covariates listed above. Variables were selected a priori based on author expertise and prior studies.2–4 Both unadjusted and adjusted odds ratios (ORs) were reported with 95% confidence intervals (CIs). All statistical analyses were performed in Stata 15.1 (StataCorp, College Station, TX).
Results
Between 1993 and 2019, there were an estimated 8 million ED visits for bronchiolitis, accounting for approximately 4% of the estimated 189 million ED visits by children <2 years. Estimated ED visits for bronchiolitis more than doubled from 1993–1995 to 2017–2019 with only modest increases in total ED visit volume (Figure 1). Overall bronchiolitis ED visit rates increased across the study period (p<0.001), with rates almost doubling from 36.0 visits per 1,000 ED visits in 2008–2010 to 65.3 visits per 1,000 ED visits in 2017–2019 (Figure 2). Similar trends were observed when stratified by age (children <1 year: p <0.001; children 1–1.9 years old: p=0.002).
Figure 1.
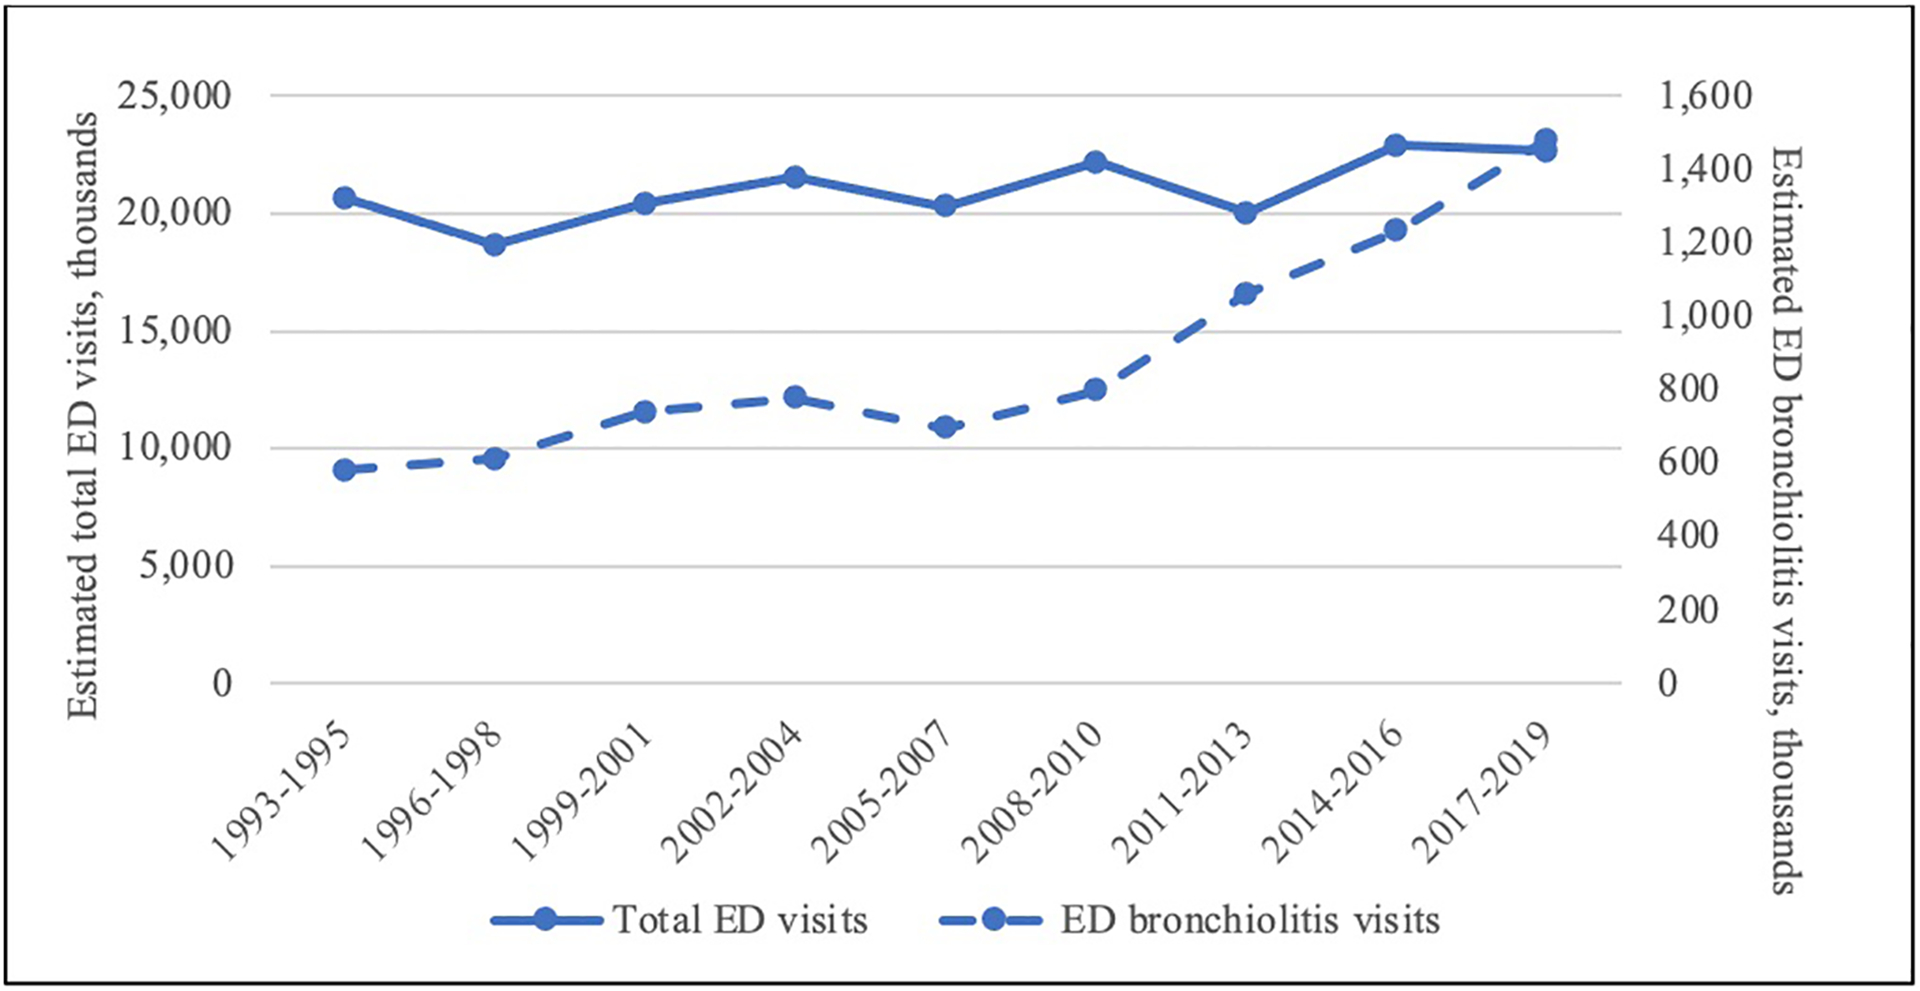
Estimated total ED visits and ED visits for bronchiolitis among children <2 years.
Figure 2.
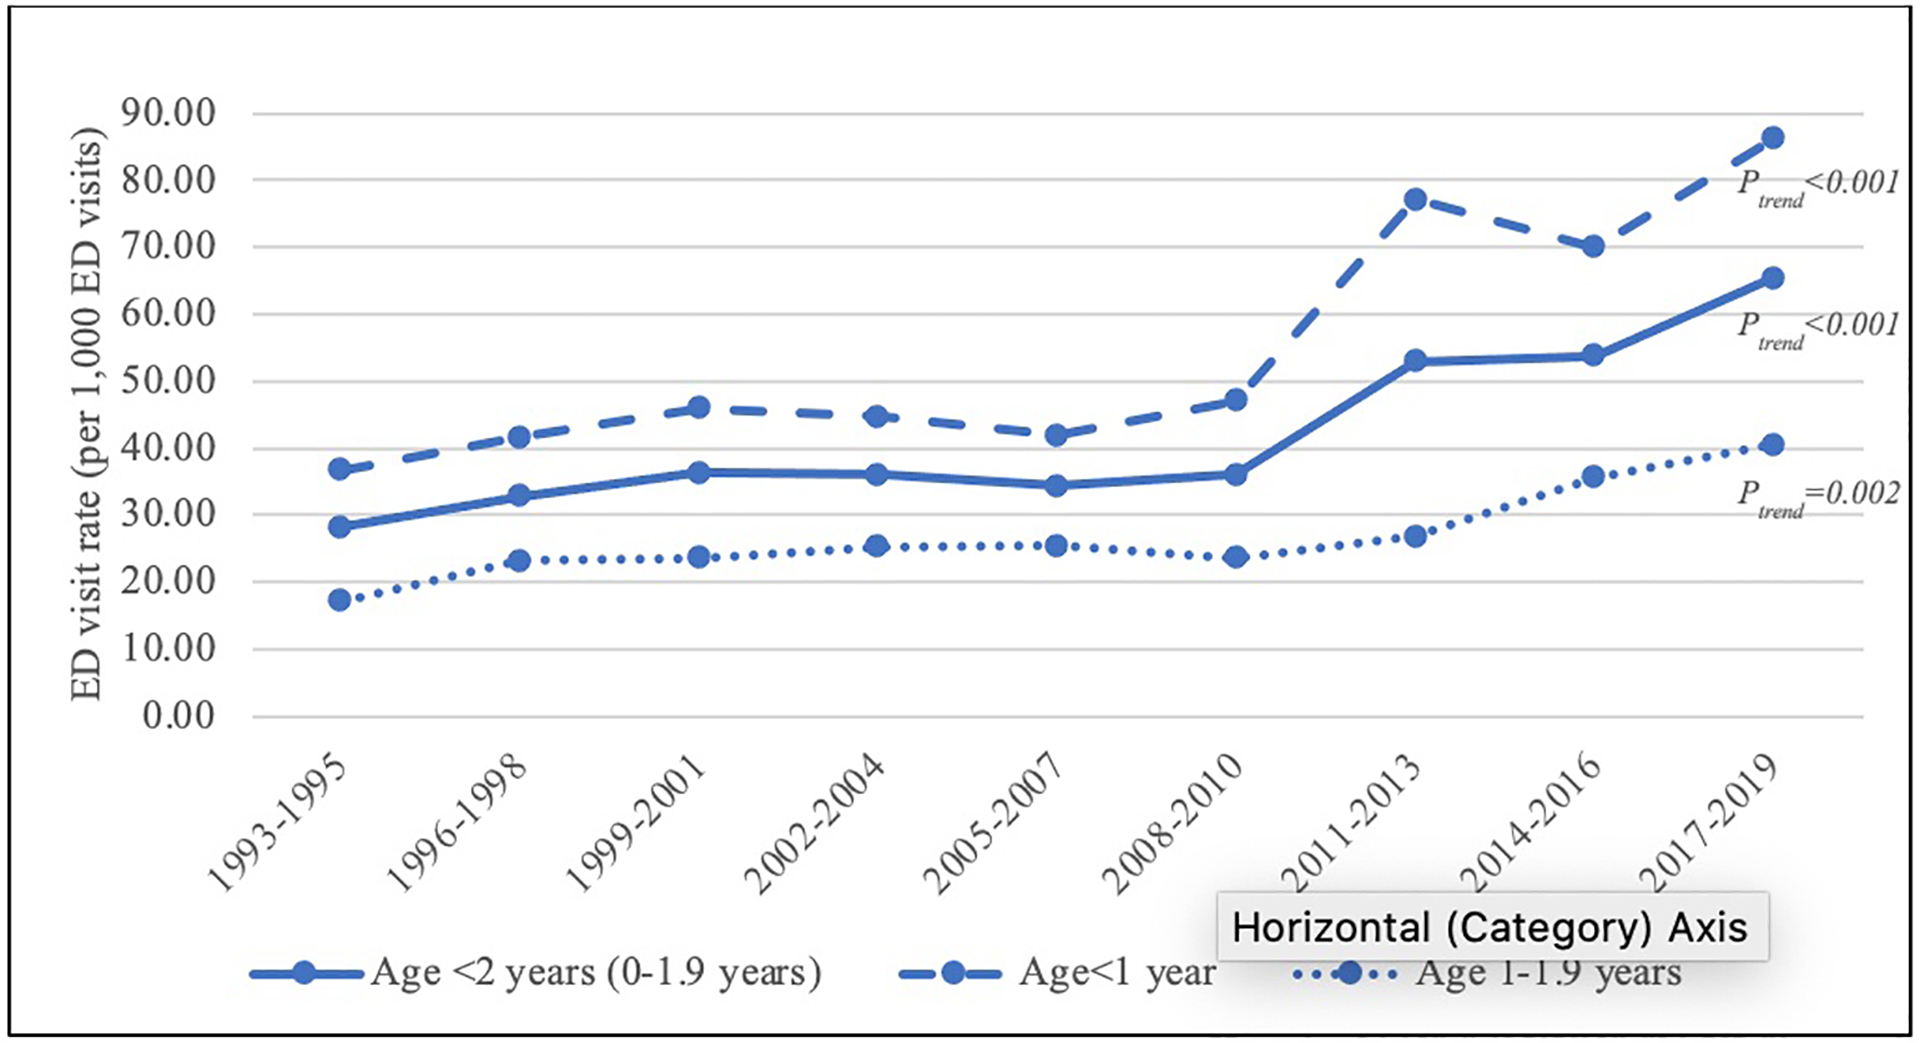
Bronchiolitis ED visit rates (per 1,000 ED visits), stratified by overall study population, children <1 year old and children 1–1.9 years old.
Table 1 depicts trends in patient characteristics and facility characteristics for bronchiolitis ED visits across the study period. While the overall bronchiolitis ED visit rate increased over time, there were no significant changes in age, sex, race and ethnicity, insurance status or triage severity level upon ED presentation. Patients were more likely to be seen in an urban vs. rural hospital throughout the study period and around 75% were evaluated in a general hospital ED compared to 25% in a children’s hospital ED between 1993 and 2016. This proportion was lower in 2017–2019 (54% evaluated in a general hospital ED). Approximately half (43%−61%) of bronchiolitis ED visits occurred in winter months (December through February).
Table 1.
Demographic and Facility Characteristics of Emergency Department Visits for Bronchiolitis in the U.S., 1993–2019
| 1993–1995 | 1996–1998 | 1999–2001 | 2002–2004 | 2005–2007 | 2008–2010 | 2011–2013 | 2014–2016 | 2017–2019 | Ptrend | ||||||||||
|---|---|---|---|---|---|---|---|---|---|---|---|---|---|---|---|---|---|---|---|
| Weighted N (CI) | Weighted % (CI) | Weighted N (CI) | Weighted % (CI) | Weighted N (CI) | Weighted % (CI) | Weighted N (CI) | Weighted % (CI) | Weighted N (CI) | Weighted % (CI) | Weighted N (CI) | Weighted % (CI) | Weighted N (CI) | Weighted % (CI) | Weighted N (CI) | Weighted % (CI) | Weighted N (CI) | Weighted % (CI) | ||
| Aye | |||||||||||||||||||
| <1yr | 425 (292–557) | 73 (63–81) | 410 (283–537) | 67 (59–74) | 532 (327–1,898) | 72 (62–80) | 534 (329–2,400) | 69 (58–78) | 461 (314–607) | 66 (58–74) | 552 (377–727) | 69 (61–76) | 805 (493–1,117) | 76 (65–84) | 849 (601–1,097) | 69 (59–77) | 1,062 (687–1,437) | 72 (62–80) | 0.73 |
| 1-1.9yr | 156 (92–221) | 27 (19–37) | 203 (130–276) | 33 (26–41) | 208 (131–724) | 28 (20–38) | 243 (160–1,061) | 31 (22–42) | 236 (151–321) | 34 (26–42) | 246 (157–335) | 31 (24–39) | 256 (143–369) | 24 (16–35) | 384 (211–556) | 31 (23–41) | 419 (250–588) | 28 (20–38) | |
| Sex | |||||||||||||||||||
| Male | 357 (250–464) | 61 (52–70) | 343 (233–453) | 56 (45–67) | 451 (287–1,621) | 61 (52–69) | 474 (303–1,989) | 61 (53–68) | 388 (264–512) | 56 (48–64) | 502 (351–653) | 63 (55–70) | 664 (404–924) | 63 (53–71) | 696 (449–943) | 56 (47–65) | 869 (576–1,162) | 59 (50–67) | 0.81 |
| Female | 224 (141–307) | 39 (30–48) | 270 (159–380) | 44 (33–55) | 289 (179–986) | 39 (31–48) | 303 (208–1,476) | 39 (32–47) | 308 (204–413) | 44 (36–52) | 296 (186–405) | 37 (30–45) | 398 (251–544) | 37 (29–47) | 537 (364–711) | 44 (35–53) | 612 (376–847) | 41 (33–50) | |
| Race/Ethnicity | |||||||||||||||||||
| Non-Hispanic white | 185 (108–261) | 32 (23–43) | 232 (144–321) | 38 (29–48) | 271 (163–770) | 37 (25–50) | 284 (187–1,051) | 37 (28–46) | 219 (129–310) | 31 (23–41) | 248 (137–359) | 31 (22–42) | 279 (160–398) | 26 (18–36) | 341 (178–504) | 28 (19–39) | 448 (268–628) | 30 (21–41) | 0.63 |
| Non-Hispanic Black | 103 (54–153) | 18 (11–27) | 131 (nc) | 21 (nc) | 115 (58–571) | 16 (9–25) | 131 (nc) | 17 (nc) | 220 (126–315) | 32 (23–42) | 179 (96–263) | 22 (15–32) | 175 (92–258) | 16 (10–26) | 330 (166–493) | 27 (17–39) | 298 (141455) | 20 (13–30) | |
| Hispanic | 133 (59–207) | 23 (14–35) | 150 (74–225) | 24 (16–36) | 205 (nc) | 28 (nc) | 211 (114–731) | 27 (21–35) | 152 (80–223) | 22 (14–32) | 259 (149–369) | 32 (23–43) | 208 (107–309) | 20 (14–27) | 245 (125–365) | 20 (13–30) | 276 (nc) | 19 (nc) | |
| Other | 21 (nc) | 4 (nc) | 22 (nc) | 4 (nc) | 5 (nc) | 1 (nc) | 13 (nc) | 2 (nc) | 40 (nc) | 6 (nc) | 31 (nc) | 4 (nc) | 12 (nc) | 1 (nc) | 50 (nc) | 4 (nc) | 82 (nc) | 6 (nc) | |
| Unknown | 139 (nc) | 24 (nc) | 78 (nc) | 13 (nc) | 144 (nc) | 20 (nc) | 138 (75–939) | 18 (11–28) | 65 (nc) | 9 (nc) | 80 (nc) | 10 (nc) | 388 (183–592) | 37 (26–48) | 267 (116–417) | 22 (13–34) | 376 (nc) | 25 (nc) | |
| Insurance Status | |||||||||||||||||||
| Private | 111 (65–158) | 19 (13–28) | 162 (88–236) | 26 (19–36) | 240 (147–544) | 32 (25–41) | 246 (169–792) | 32 (25–39) | 176 (110–243) | 25 (19–33) | 192 (112–271) | 24 (17–33) | 167 (79–255) | 16 (10–25) | 241 (104–378) | 20 (12–30) | 306 (nc) | 21 (nc) | 0.12 |
| Medicare/Medicaid/CHIP | 346 (221–471) | 60 (49–69) | 309 (207–411) | 50 (38–63) | 361 (225–1,758) | 49 (40–57) | 445 (275–2,072) | 57 (49–65) | 365 (238–491) | 52 (43–61) | 534 (351–717) | 67 (57–75) | 753 (459–1,046) | 71 (61–79) | 737 (496–977) | 60 (49–70) | 883 (582–1,184) | 60 (47–71) | |
| Other/self-pay | 115 (57–173) | 20 (13–30) | 116 (nc) | 19 (nc) | 108 (nc) | 15 (nc) | 57 (nc) | 7 (nc) | 117 (nc) | 17 (nc) | 43 (nc) | 5 (nc) | 112 (nc) | 11 (nc) | 80 (nc) | 6 (nc) | 57 (nc) | 4 (nc) | |
| Unknown | 8 (nc) | 1 (nc) | 26 (nc) | 4 (nc) | 31 (nc) | 4 (nc) | 29 (nc) | 4 (nc) | 39 (nc) | 6 (nc) | 29 (nc) | 4 (nc) | 30 (nc) | 3 (nc) | 176 (nc) | 14 (nc) | 234 (nc) | 16 (nc) | |
| Triage Level | |||||||||||||||||||
| Urgent | 292 (191–392) | 50 (40–60) | 329 (209–449) | 54 (42–65) | 301 (204–1,188) | 41 (28–54) | 381 (284–1,483) | 49 (36–62) | 400 (258–542) | 57 (47–67) | 327 (198–457) | 41 (30–53) | 494 (315–673) | 47 (36–57) | 533 (322–745) | 43 (34–54) | 610 (355–865) | 41 (31–53) | 0.59 |
| Non-urgent | 267 (176–359) | 46 (37–56) | 190 (102–277) | 31 (21–43) | 233 (nc) | 31 (nc) | 215 (nc) | 28 (nc) | 184 (116–252) | 26 (20–34) | 221 (122–320) | 28 (19–38) | 382 (225–539) | 36 (27–46) | 416 (251–581) | 34 (25–44) | 496 (265–728) | 34 (25–44) | |
| Unknown | 22 (nc) | 4 (nc) | 94 (41–147) | 15 (9–25) | 206 (nc) | 28 (nc) | 180 (75–914) | 23 (15–34) | 112 (57–167) | 16 (11–24) | 250 (136–363) | 31 (22–43) | 185 (nc) | 17 (nc) | 284 (144–423) | 23 (14–35) | 374 (200–549) | 25 (16–37) | |
| Season | |||||||||||||||||||
| Spring (Mar-May) | 152 (90–214) | 26 (18–37) | 118 (nc) | 19 (nc) | 178 (80–600) | 24 (14–37) | 218 (138–921) | 28 (18–40) | 127 (70–185) | 18 (12–28) | 204 (111–297) | 26 (17–36) | 218 (114–321) | 21 (14–29) | 311 (161–461) | 25 (17–36) | 377 (215–538) | 25 (18–35) | 0.81 |
| Summer (Jun-Aug) | 78 (nc) | 13 (nc) | 28 (nc) _ | 5 (nc) | 57 (nc) | 8 (nc) | 59 (nc) | 8 (nc) | 40 (nc) | 6 (nc) | 49 (nc) | 6 (nc) | 96 (nc) | 9 (nc) | 108 (nc) | 9 (nc) | 84 (nc) | 6 (nc) | |
| Fall (Sep-Nov) | 100 (nc) | 17 (nc) | 90 (nc) | 15 (nc) | 74 (nc) | 10 (nc) | 97 (55–668) | 12 (8–20) | 199 (107–292) | 29 (20–40) | 135 (63–208) | 17 (10–26) | 186 (nc) | 18 (nc) | 227 (108–346) | 18 (11–29) | 258 (119–397) | 17 (10–28) | |
| Winter (Dec-Feb) | 251 (143–359) | 43 (32–56) | 376 (223–529) | 61 (48–73) | 432 (240–1,393) | 58 (45–70) | 403 (187–1,805) | 52 (37–66) | 330 (195–465) | 47 (36–59) | 410 (254–566) | 51 (40–62) | 562 (317–806) | 53 (42–64) | 587 (349–825) | 48 (37–59) | 762 (420–1,103) | 51 (40–63) | |
| Metropolitan Statistical Areas | |||||||||||||||||||
| Urban | 448 (310–585) | 77 (62–87) | 513 (348–678) | 84 (70–92) | 601 (374–827) | 81 (65–91) | 681 (450–3,160) | 88 (76–94) | 645 (447–842) | 93 (83–97) | 696 (486–906) | 87 (69–96) | NA | 1,110 (763–1,456) | 90 (80–95) | 1,393 (934–1,851) | 94 (84–98) | NA | |
| Rural | 133 (nc) | 23 (nc) | 100 (nc) | 16 (nc) | 140 (nc) | 19 (nc) | 96 (nc) | 12 (nc) | 52 (nc) | 7 (nc) | 101 (nc) | 13 (nc) | 123 (nc) | 10 (nc) | 88 (nc) | 6 (nc) | |||
| Region | |||||||||||||||||||
| Northeast | 45 (nc) | 8 nc) | 63 (nc) | 10 (nc) | 85 (33–396) | 11 (nc) | 63 (31–501) | 8 (5–14) | 67 (35–99) | 10 (6–16) | 139 (44–233) | 17 (9–31) | 124 (60–187) | 12 (7–20) | 163 (nc) | 13 (nc) | 177 (nc) | 12 (nc) | 0.97 |
| Midwest | 178 (89–266) | 31 (20–44) | 183 (83–283) | 30 (18–45) | 238 (94–440) | 32 (nc) | 192 (110–1,074) | 25 (16–37) | 107 (45–169) | 15 (9–26) | 146 (68–225) | 18 (11–30) | 124 (nc) | 12 (nc) | 297 (133–462) | 24 (14–38) | 418 (nc) | 28 (nc) | |
| South | 208 (118–297) | 36 (24–49) | 278 (155–401) | 45 (32–60) | 338 (158–1,396) | 46 (30–62) | 371 (160–1,570) | 48 (33–63) | 337 (194–480) | 48 (35–62) | 353 (178–527) | 44 (30–59) | 552 (237–867) | 52 (36–68) | 508 (266–750) | 41 (28–56) | 607 (307–907) | 41 (27–57) | |
| West | 151 (nc) | 26 (nc) | 89 (nc) | 14 (nc) | 79 (35–671) | 11 (6–19) | 151 (83–823) | 19 (12–30) | 185 (nc) | 27 (nc) | 160 (73–247) | 20 (12–32) | 262 (132–392) | 25 (15–38) | 264 (nc) | 21 (nc) | 279 (124–434) | 19 (11–31) | |
| Patient Population Served * | |||||||||||||||||||
| Pediatric ED | 138 (nc) | 24 (nc) | 180 (nc) | 29 (nc) | 210 (nc) | 28 (nc) | 199 (nc) | 26 (nc) | 155 (nc) | 22 (nc) | 177 (nc) | 22 (nc) | 313 (nc) | 30 (nc) | 272 (nc) | 22 (nc) | 688 (305–1,071) | 46 (32–62) | 0.16 |
| General ED | 443 (311–575) | 76 (61–87) | 433 (308–557) | 71 (54–83) | 530 (372–833) | 72 (52–85) | 578 (439–1,399) | 74 (51–89) | 541 (386–696) | 78 (64–87) | 621 (430–812) | 78 (62–88) | 748 (537–959) | 70 (51–85) | 961 (648–1,274) | 78 (63–88) | 792 (544–1,040) | 54 (38–68) | |
| Proportion admitted to the hospital | 120 (59–181) | 21 (13–30) | 132 (nc) | 21 (nc) | 115 (nc) | 15 (nc) | 94 (41–592) | 12 (8–18) | 83 (37–129) | 12 (7–19) | 84 (nc) | 11 (nc) | 119 (nc) | 11 (nc) | 115 (nc) | 9 (nc) | 290 (132–448) | 20 (13–29) | 0.44 |
Abbreviation: CI, confidence interval; Nc = not calculated. Per NHAMCS, estimates based on fewer than 30 visits or with a relative standard error larger than 30% were considered unreliable.
Metropolitan Statistical Area is not available in NHAMCS 2012 dataset.
Children’s Hospital ED is defined as a hospital where ≥75% of patients evaluated in the ED were less than 18 years old.
After adjusting for patient and facility covariates, logistic regression results confirmed increasing bronchiolitis ED visit rate over time (aOR 1.03 per year, 95% CI 1.02–1.04; Table 2). The odds of ED visits for bronchiolitis were almost six times higher in the Winter (aOR 5.92, 95% CI 4.58–7.64) and 2–3 times higher in the Spring (aOR 2.86, 95% CI 2.19–3.75) and Fall (aOR 2.33, 95% CI 1.72–3.16), compared to the Summer season.
Table 2.
Odds Ratio of Factors Associated with ED Presentation for Bronchiolitis
| Variables | Unadjusted Results | Adjusted Results* | ||||
|---|---|---|---|---|---|---|
| Odds Ratio | 95% CI | P-value | Odds Ratio | 95% CI | P-value | |
| Year | 1.04 | (1.02–1.05) | <0.001 | 1.03 | (1.02–1.04) | <0.001 |
| Age | ||||||
| <1yr | 1.00 | Reference | 1.00 | Reference | ||
| 1–1.9yr | 0.48 | (0.41–0.56) | <0.001 | 0.50 | (0.43–0.58) | <0.001 |
| Sex | ||||||
| Male | 1.00 | Reference | ||||
| Female | 0.81 | (0.71–0.92) | 0.002 | 0.82 | (0.71–0.95) | 0.01 |
| Race/Ethnicity | ||||||
| Non-Hispanic white | 1.00 | Reference | 1.00 | Reference | ||
| Non-Hispanic Black | 1.23 | (0.996–1.52) | 0.06 | 1.10 | (0.88–1.37) | 0.41 |
| Hispanic | 1.30 | (1.07–1.57) | 0.01 | 1.14 | (0.93–1.40) | 0.22 |
| Other | 1.30 | (0.89–1.89) | 0.17 | 1.17 | (0.79–1.73) | 0.44 |
| Unknown | 1.25 | (0.995–1.57) | 0.06 | 1.06 | (0.87–1.29) | 0.58 |
| Insurance Status | ||||||
| Private | 1.00 | Reference | 1.00 | Reference | ||
| Medicare/Medicaid/CHIP | 1.20 | (1.01–1.43) | 0.03 | 1.07 | (0.90–1.27) | 0.46 |
| Other | 1.05 | (0.73–1.50) | 0.79 | 1.16 | (0.81–1.67) | 0.42 |
| Self-pay | 0.79 | (0.60–1.04) | 0.09 | 0.82 | (0.63–1.07) | 0.15 |
| Unknown | 1.31 | (0.86–2.00) | 0.21 | 1.16 | (0.79–1.70) | 0.45 |
| Triage Level | ||||||
| Non-urgent | 1.00 | Reference | 1.00 | Reference | ||
| Urgent | 1.54 | (1.30–1.81) | <0.001 | 1.61 | (1.37–1.89) | <0.001 |
| Unknown | 1.21 | (0.99–1.50) | 0.07 | 1.17 | (0.94–1.40) | 0.16 |
| Season | ||||||
| Spring (Mar-May) | 2.71 | (2.09–3.51) | <0.001 | 2.86 | (2.19–3.75) | <0.001 |
| Summer (Jun-Aug) | 1.00 | Reference | 1.00 | Reference | ||
| Fall (Sep-Nov) | 2.19 | (1.63–2.94) | <0.001 | 2.33 | (1.72–3.16) | <0.001 |
| Winter (Dec-Feb) | 5.61 | (4.37–7.21) | <0.001 | 5.92 | (4.58–7.64) | <0.001 |
| Metropolitan Statistical Areas | 1.29 | (1.02–1.63) | 0.03 | 1.06 | (0.83–1.30) | 0.64 |
| Region | ||||||
| Northeast | 1.00 | Reference | 1.00 | Reference | ||
| Midwest | 1.32 | (1.01–1.72) | 0.04 | 1.34 | (1.05–1.70) | 0.02 |
| South | 1.41 | (1.09–1.82) | 0.01 | 1.29 | (1.02–1.62) | 0.03 |
| West | 1.40 | (1.07–1.84) | 0.02 | 1.43 | (1.08–1.89) | 0.01 |
| Patient Population Served | ||||||
| General ED | 1.00 | Reference | 1.00 | Reference | ||
| Children’s ED ** | 1.59 | (1.26–2.00) | <0.001 | 1.42 | (1.14–1.76) | 0.002 |
Results adjusted for all other model covariates including: year, age, sex, race/ethnicity, insurance status, triage level, season, metropolitan statistical area, region and patient population served.
Children’s Hospital ED is defined as a hospital where ≥75% of patients evaluated in the ED were less than 18 years old.
Fourteen percent (95% CI 12%−17%) of children age < 2 years presenting to the ED for bronchiolitis were hospitalized, accounting for an estimated 1.2 million hospitalizations over the 27-year study period. When stratified by age, there were an estimated 873,000 hospitalizations for children age <1 year (16% hospitalized, 95% CI 13%−19%) and 277,000 hospitalizations for children age 1–1.9 years (12% hospitalized, 95% CI 8%−17%). Hospitalization rates appeared to decrease over the majority of the study period (from 21% in 1993–1995 to 9% in 2014–2016) followed by an increase (20%) in 2017–2019, despite no statistically significant trend identified over time (Table 1). We then conducted a sensitivity analysis to examine the trend with more recent years (2017–2019) excluded. P for trend was 0.01, indicating a significant decline in bronchiolitis hospitalization rates between 1993–2016.
Discussion
Our review of the NHAMCS survey database found that ED visits rates for bronchiolitis increased from 1993 to 2019, with rates almost doubling after 2010. This increase was not associated with a change in patient demographics, location of presentation, or seasonality. Hospitalization rates decreased across the majority of the study period (1993–2016) followed by an increase in proportion admitted (20%) and estimated volume of bronchiolitis hospitalizations in 2017–2019. These findings have important implications for future hospital operations and capacity planning.
Our results align with prior studies of the NHAMCS-ED and National Emergency Department Sample (NEDS) databases that demonstrated stable to slightly increasing ED visits rates for bronchiolitis from 1990–2010.2,3 Trends in bronchiolitis ED visits and hospitalizations over the past decade are less clear. Using the Kids’ Inpatient Database (KID), a nationally representative sample of inpatient pediatric hospitalizations, Fujiogi et al. found decreasing rates of bronchiolitis hospitalizations from 2000 to 2016 (17.9/1000 person-years to 13.5/1000 person-years), similar to our results.4 In contrast, Mahant et al., using a population-based cohort study design of pediatric encounters in Ontario Canada from a similar time period (i.e., 2004 to 2018), demonstrated stable bronchiolitis hospitalization rates, but a 130% increase in ICU usage. Finally, two analyses also from similar time periods (i.e., 2010–2019) but using the Pediatric Health Information System (PHIS), an administrative database of >45 US children’s hospitals, found increasing rates of bronchiolitis hospitalizations and ICU admissions .6,7 The variability in hospitalizations and ICU utilization trends over the last decade may be due to differences in data sources (nationally-representative samples vs. pediatric hospital administrative data) and/or changes in diagnostic coding practices.
Our results evaluating 27 years from a single nationally representative data source provide convincing evidence that national ED visit rates for bronchiolitis have increased significantly since 2010. There are several possible explanations for the observed changes in ED utilization patterns for bronchiolitis. First, there may have been an increase in the identification and diagnosis of bronchiolitis following the publication of the 2006 and 2014 American Academy of Pediatrics bronchiolitis guidelines.13,14 In addition, the threshold for referral to the Emergency Department from primary care offices may have decreased in the recent decade, potentially in response to increased use of pulse oximetry to detect hypoxemia.15,16 Increased ED visit utilization may also be due to caretaker preference for emergent evaluation over visits to their primary pediatrician, especially with increased availability of consumer home pulse oximeters.17 Finally, although we saw no increase in the triage severity level at ED presentation, it is possible that more virulent strains of respiratory syncytial virus (RSV), or other viruses associated with bronchiolitis, are circulating in the community each year resulting in a greater proportion of moderate or severe disease. Concurrent environmental changes (e.g., humidity and precipitation levels) may also promote easier viral transmission.18
A clear understanding of prior trends is critical for the interpretation of present and future bronchiolitis healthcare utilization needs. Several recent developments may affect future rates of bronchiolitis ED visits and hospitalizations. First, the onset of the COVID-19 pandemic in 2020 significantly altered pediatric hospital volumes, with a decrease in respiratory illnesses likely secondary to social distancing and masking practices.19,20 Second, although we found no significant changes in seasonality of bronchiolitis ED visits over the past 27 years, the removal of masking restrictions and re-opening of schools led to earlier bronchiolitis seasons in 2021 and 2022.21–23 Third, preliminary results from Pfizer’s maternal RSV vaccine trial are promising for preventing severe lower respiratory infections in infants for the first 6 months after delivery.24
This study has several limitations. First, our analysis is limited to the data available in the NHAMCS-ED database. NHAMCS is a visit-based survey and is not designed to provide population-based estimates.25 Our findings of ED visit trends are not meant to represent prevalence of bronchiolitis in the US, especially considering many children with bronchiolitis will never present to an ED for care. Although some clinical information is recorded in the survey collection forms, we were not able to confirm that visits for bronchiolitis were accurately coded which may result in misclassification bias. We chose to use a diagnosis of bronchiolitis in any diagnosis field to avoid any changes in coding practices over the study period. Finally, NHAMCS patient weights were applied to survey results to calculate national estimates. Due to limited volumes of pediatric ED visits, we chose to combine annual reports into 3-year time periods to increase statistical power.
Conclusion
Rates of bronchiolitis ED visits almost doubled from 2010 to 2019, with no associated changes in patient demographics, location of presentation, or seasonality. Our 27-year nationally representative trend analysis highlights the recent increase in hospital resource utilization for this common pediatric illness and provides important context for interpreting future bronchiolitis trends.
Funding Source:
This work was supported by grants R01 AI-137091, R01 AI-134940, and R01 AI-148338 from the National Institute of Allergy and Infectious Diseases and UG3/UH3 OD-023253 from the Office of the Director at the National Institutes of Health (Bethesda, MD). The content of this manuscript is solely the responsibility of the authors and does not necessarily represent the official views of the National Institutes of Health.
Abbreviations:
- ED
Emergency Department
- ICU
Intensive Care Unit
- NHAMCS
National Hospital Ambulatory Medical Care Survey
- CI
confidence interval
- OR
odds ratio
Footnotes
Conflict of Interest: All authors have indicated they have no potential conflicts of interest to disclose.
References
- 1.Silver AH, Nazif JM. Bronchiolitis. Pediatr Rev. 2019;40(11):568–576. doi: 10.1542/pir.2018-0260 [DOI] [PubMed] [Google Scholar]
- 2.Mansbach JM, Emond JA, Camargo CA. Bronchiolitis in US emergency departments 1992 to 2000: epidemiology and practice variation. Pediatr Emerg Care. 2005;21(4):242–247. doi: 10.1097/01.pec.0000161469.19841.86 [DOI] [PubMed] [Google Scholar]
- 3.Hasegawa K, Tsugawa Y, Brown DFM, Mansbach JM, Camargo CA. Temporal Trends in Emergency Department Visits for Bronchiolitis in the United States, 2006–2010. Pediatr Infect Dis J. 2014;33(1):11–18. doi: 10.1097/INF.0b013e3182a5f324 [DOI] [PMC free article] [PubMed] [Google Scholar]
- 4.Fujiogi M, Goto T, Yasunaga H, et al. Trends in Bronchiolitis Hospitalizations in the United States: 2000–2016. Pediatrics. 2019;144(6):e20192614. doi: 10.1542/peds.2019-2614 [DOI] [PMC free article] [PubMed] [Google Scholar]
- 5.Mahant S, Parkin PC, Thavam T, et al. Rates in Bronchiolitis Hospitalization, Intensive Care Unit Use, Mortality, and Costs From 2004 to 2018. JAMA Pediatr. 2022;176(3):270–279. doi: 10.1001/jamapediatrics.2021.5177 [DOI] [PMC free article] [PubMed] [Google Scholar]
- 6.Willer RJ, Coon ER, Harrison WN, Ralston SL. Trends in Hospital Costs and Levels of Services Provided for Children With Bronchiolitis Treated in Children’s Hospitals. JAMA Network Open. 2021;4(10):e2129920. doi: 10.1001/jamanetworkopen.2021.29920 [DOI] [PMC free article] [PubMed] [Google Scholar]
- 7.Pelletier JH, Au AK, Fuhrman D, Clark RSB, Horvat C. Trends in Bronchiolitis ICU Admissions and Ventilation Practices: 2010–2019. Pediatrics. 2021;147(6):e2020039115. doi: 10.1542/peds.2020-039115 [DOI] [PMC free article] [PubMed] [Google Scholar]
- 8.Gong C, Byczkowski T, McAneney C, Goyal MK, Florin TA. Emergency Department Management of Bronchiolitis in the United States. Pediatr Emerg Care. 2019;35(5):323–329. doi: 10.1097/PEC.0000000000001145 [DOI] [PMC free article] [PubMed] [Google Scholar]
- 9.NAMCS/NHAMCS - Ambulatory Health Care Data Homepage. Published January 23, 2023. Accessed February 13, 2023. https://www.cdc.gov/nchs/ahcd/index.htm
- 10.NAMCS/NHAMCS - Survey Instruments. Published June 29, 2022. Accessed July 17, 2023. https://www.cdc.gov/nchs/ahcd/ahcd_survey_instruments.htm
- 11.Mansbach JM, Espinola JA, Macias CG, Ruhlen ME, Sullivan AF, Camargo CA. Variability in the diagnostic labeling of nonbacterial lower respiratory tract infections: a multicenter study of children who presented to the emergency department. Pediatrics. 2009;123(4):e573–581. doi: 10.1542/peds.2008-1675 [DOI] [PubMed] [Google Scholar]
- 12.Bureau UC. Metropolitan and Micropolitan. Census.gov. Accessed February 13, 2023. https://www.census.gov/programs-surveys/metro-micro.html
- 13.Subcommittee on Diagnosis and Management of Bronchiolitis. Diagnosis and Management of Bronchiolitis. Pediatrics. 2006;118(4):1774–1793. doi: 10.1542/peds.2006-2223 [DOI] [PubMed] [Google Scholar]
- 14.Ralston SL, Lieberthal AS, Meissner HC, et al. Clinical practice guideline: the diagnosis, management, and prevention of bronchiolitis. Pediatrics. 2014;134(5):e1474–1502. doi: 10.1542/peds.2014-2742 [DOI] [PubMed] [Google Scholar]
- 15.Quinonez RA, Coon ER, Schroeder AR, Moyer VA. When technology creates uncertainty: pulse oximetry and overdiagnosis of hypoxaemia in bronchiolitis. BMJ. 2017;358:j3850. doi: 10.1136/bmj.j3850 [DOI] [PubMed] [Google Scholar]
- 16.Bonafide CP, Xiao R, Brady PW, et al. Prevalence of Continuous Pulse Oximetry Monitoring in Hospitalized Children With Bronchiolitis Not Requiring Supplemental Oxygen. JAMA. 2020;323(15):1467–1477. doi: 10.1001/jama.2020.2998 [DOI] [PMC free article] [PubMed] [Google Scholar]
- 17.Craig S, Rasooly IR, Kern-Goldberger AS, et al. Characteristics of Emergency Room and Hospital Encounters Resulting From Consumer Home Monitors. Hosp Pediatr. 2022;12(7):e239–e244. doi: 10.1542/hpeds.2021-006438 [DOI] [PMC free article] [PubMed] [Google Scholar]
- 18.Baker RE, Mahmud AS, Wagner CE, et al. Epidemic dynamics of respiratory syncytial virus in current and future climates. Nat Commun. 2019;10(1):5512. doi: 10.1038/s41467-019-13562-y [DOI] [PMC free article] [PubMed] [Google Scholar]
- 19.Jl W, Cr P, As G, Sl T, Jm M. Pediatric Hospitalizations During the COVID-19 Pandemic. Pediatrics. 2020;146(6). doi: 10.1542/peds.2020-005983 [DOI] [PubMed] [Google Scholar]
- 20.Gill PJ, Mahant S, Hall M, Berry JG. Reasons for Admissions to US Children’s Hospitals During the COVID-19 Pandemic. JAMA. 2021;325(16):1676–1679. doi: 10.1001/jama.2021.4382 [DOI] [PMC free article] [PubMed] [Google Scholar]
- 21.Agha R, Avner JR. Delayed Seasonal RSV Surge Observed During the COVID-19 Pandemic. Pediatrics. 2021;148(3):e2021052089. doi: 10.1542/peds.2021-052089 [DOI] [PubMed] [Google Scholar]
- 22.Radhakrishnan L Pediatric Emergency Department Visits Before and During the COVID-19 Pandemic — United States, January 2019–January 2022. MMWR Morb Mortal Wkly Rep. 2022;71. doi: 10.15585/mmwr.mm7108e1 [DOI] [PubMed] [Google Scholar]
- 23.Castagno E, Raffaldi I, Del Monte F, Garazzino S, Bondone C. New epidemiological trends of respiratory syncytial virus bronchiolitis during COVID-19 pandemic. World J Pediatr. Published online September 26, 2022:1–3. doi: 10.1007/s12519-022-00623-4 [DOI] [PMC free article] [PubMed] [Google Scholar]
- 24.Larkin H Investigational RSV Vaccine Given During Pregnancy Protects Newborns. JAMA. 2022;328(22):2201. doi: 10.1001/jama.2022.20032 [DOI] [PubMed] [Google Scholar]
- 25.McCaig LF, Burt CW. Understanding and interpreting the National Hospital Ambulatory Medical Care Survey: key questions and answers. Ann Emerg Med. 2012;60(6):716–721.e1. doi: 10.1016/j.annemergmed.2012.07.010 [DOI] [PubMed] [Google Scholar]