

Abstract
Membraneless organelles within cells have unique microenvironments that play a critical role in their functions. How microenvironments of biomolecular condensates affect their structure and function remains unknown. Herein, we investigated the micropolarity and microviscosity of model biomolecular condensates by fluorescence lifetime imaging coupling with environmentally sensitive fluorophores. Using both in vitro and in cellulo systems, we demonstrated that sufficient micropolarity difference is key to forming multilayered condensates, where the shells present more polar microenvironments than the cores. Furthermore, micropolarity changes were shown to be accompanied by conversions of the layered structures. Decreased micropolarities of the granular components (GC) accompanied with the increased micropolarities of the dense fibrillar components (DFC) result in the relocation of different nucleolus subcompartments in transcription-stalled conditions. Our results demonstrate the central role of the previously overlooked micropolarity in the regulation of structures and functions of membraneless organelles.
Biomolecular condensates are membraneless intracellular protein- and RNA-rich compartments that originated through a phase transition process termed liquid-liquid phase separation (LLPS)1–5. The microenvironments inside the biomolecular condensates were shown to be drastically different from the outside surroundings in multiple aspects, including pH6, biomacromolecule compactness7,8, hydration9,10, viscoelasticity11,12, drug recruitment13, interfacial properties14,15 and others. Till now, it remains elusive how microenvironments affect the structure and client partition of biomolecular condensate. This question becomes particularly intriguing for multiphasic biomolecular condensates that arrange in a “phase within phase” structure, represented by stress granules16,17, nucleoli18–20, and anisosomes21, amongst many others. While interfacial tension has been proposed to determine the arrangements of the layered structures19,20,22, new principles focusing on the microenvironments remain to be discovered. Changes in the structure of multiphasic biological condensates are ultimately driven by the change of homo- and hetero-typic interactions among biomacromolecules as well as interactions between biomacromolecules and solvents. We envisioned that the changes in the molecular interactions could be visualized and quantified by the variations of physiochemical determinants in the condensates’ microenvironment. Therefore, the changes of the microenvironments could be an untapped handle to understand the regulation of multiphasic biological condensates and bridge the promiscuous molecular interactions with the condensates’ structure.
Herein, we demonstrate that the micropolarity of the condensates’ microenvironment governs the structural arrangements of multiphasic ELP condensates. As an in-vitro model system, protein-rich condensates formed by elastin-like polypeptides (ELPs) were used for the investigation of condensates’ microenvironments. The coacervation of two ELPs resulted in the formation of dual-component ELP condensates with diverse structures and partition results. We found that the micropolarity of the droplets’ microenvironment governs the structural arrangements of multiphasic ELP condensates. The outer shell layer demonstrated a higher micropolarity than the inner core layer. The micropolarity differences between cores and shells mark the interaction favorability of homotypic interactions of one ELP sequence over heterotypic interactions among two ELP sequences, representing an important readout representing the free energy change during ELP condensates mixing. The influx of biomacromolecules into existing condensate could drive its further segregation by changing the micropolarity of individual components to form the more polar layer surrounding the less polar layer. Finally, using the multiphasic nucleolus as an in-cellulo system, we found that the outermost granular component (GC) layer showed a higher micropolarity than the inner dense fibrillar component (DFC) layer. However, inhibition of transcription using actinomycin D led to a decreased micropolarity of the GC and an increased micropolarity of the DFC. Such micropolarity changes in opposite directions overturned their micropolarity ranking between the GC and the DFC, which is accompanied by the dislocation of the DFC to reside outside of the GC layer, forming nucleolar caps. Collectively, these results demonstrated that micropolarity plays a central role in the organization and substrate partition of multiphasic biomolecular condensates. Spatiotemporal modulation of the multiphasic membraneless organelles in live cells is potentially achieved by tuning their microenvironment upon specific cell signalling, enabled by the influx and outflux of biomacromolecules and small molecule substrates.
Results:
ELP mixtures phase separate into diverse condensates
ELPs are bioengineered low-complexity peptide polymers that encode multiple pentameric repeats of VPGXG, in which the guest residue, X, could be any amino acid residue but proline23. Previous work showed that the coacervation of multiple ELPs with different guest residues could form “phase within phase” condensates24 (Fig. 1a). In this study, we generated purified ELPs bearing different guest residues and chain lengths (Fig. 1b). The naming of ELP constructs is determined by the type and number of guest residuals, as well as the total number of pentameric repeats. For example, XaYbZc-N denotes an ELP construct with a total length of N pentameric repeats, in which X, Y, Z were found on the guest residual position of the repetitive pentamers at a ratio of a, b, c, respectively. V2I7E-40 contains 40 pentameric repeats separated into 4 identical subgroups of 10 pentamers. For each subgroup, the pentamers bearing the guest residue of valine, isoleucine and glutamic acid were found at a ratio of 2:7:1. Likewise, KV6-112 and QV6-112 consist of 112 pentameric repeats that split evenly into 16 subgroups, with each subgroup made up of 1 pentamer bearing lysine or glutamine and 6 pentamers bearing valine. V-120, V5A5-120 and V5A2G3-120 are ELPs consisting of only aliphatic residues and glycine. V-120 is solely made up of pentamers bearing valine guest residue. V5A5-120 and V5A2G3-120 replaced half the number of valines with alanine and/or glycine residues.
Figure 1. ELP binary mixtures phase separate into dual-component condensates with diverse phase behaviour.
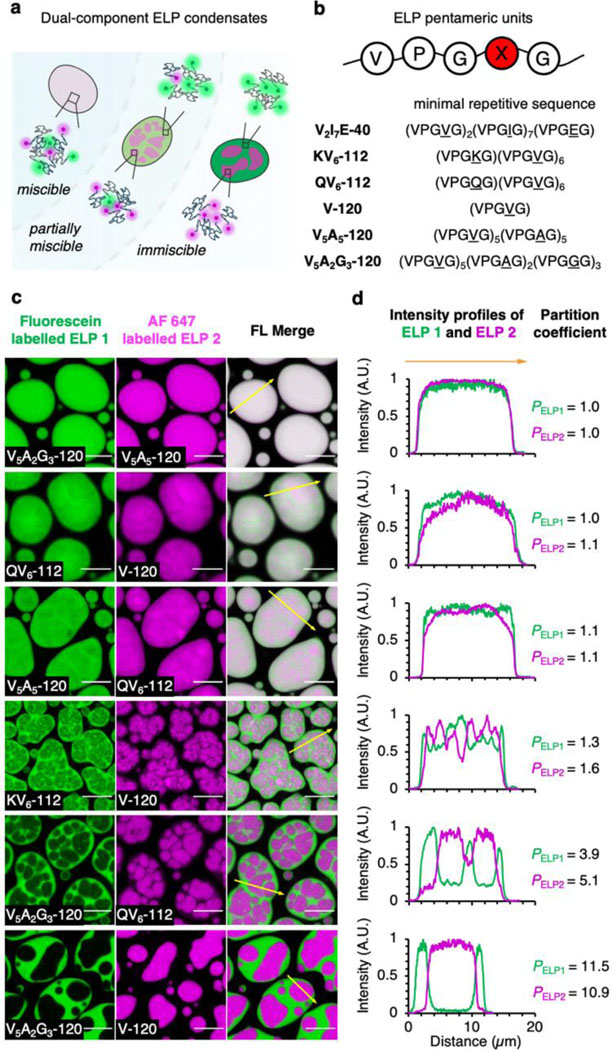
a, Schematic of the dual-component ELP condensates with diverse organization and miscibility. b, The pentameric repetitive unit and the minimal repetitive sequence of ELP used in this work. c, Dual-colour confocal images of phase-separated dual-component ELP condensates. Co-phase separation of fluorescein-labelled ELP 1 (green) and AF 647-labelled ELP 2 (magenta) resulted in both miscible ELP condensates and dual-layer ELP droplets with various miscibility. Scale bars, 10 µm. d, Fluorescence intensity profile along the yellow arrows from (c). Partition coefficient values were calculated as the averaged fluorescence intensity ratio of ELPs between their rich and poor subcompartments in dual-component ELP droplets.
All purified ELPs display lower critical solution temperature phase behaviour in aqueous solutions25–27. ELPs undergo LLPS above phase transition temperatures (Tph) (Extended Data Fig. 1), forming liquid droplets with merging and wetting properties (Supplementary Fig. 1). Next, we examined the coacervates of binary ELPs combinations by labelling the N-terminus of ELPs with either green-fluorescence fluorescein NHS-ester or red-fluorescence AF 647 NHS-ester in 2 M NaCl buffer (see Methods section for LLPS condition). Interestingly, we observed different phase behaviours (Fig. 1c and Supplementary Fig. 2). Some binary combinations of ELPs appeared to be fully miscible with each other, represented by V5A2G3-120/V5A5-120. Others showed fluorescence heterogeneities, such as QV6-112/V-120 and V5A5-120/QV6-112. Such heterogeneity became more pronounced in KV6-112/V-120 coacervates, where KV6-112 and V-120 were enriched in two subcompartments with clear boundaries. Finally, the V5A2G3-120/QV6-112 and V5A2G3-120/V-120 droplets presented phase-separated core-shell structures, where each ELP reside predominantly in either the core or the shell layer. Intensity profile analysis along the indicated lines from fluorescence images corroborated the findings of diverse phase behaviour from dual-component ELP droplets (Fig. 1d). The partition coefficient (PELP) of fluorescein-labelled ELP (indicated as ELP1) and AF 647 labelled ELP (ELP2) also increased from 1 for miscible V5A2G3-120/V5A5-120 droplets to over 10 for immiscible V5A2G3-120/V-120 droplets.
Experimental evidence suggests that the above observations were autonomous demixing of dual-component ELP solution into biomolecular condensates with varying partition coefficients. First, in the LLPS process of dual-component ELP mixtures, as the solution temperature increases, ELP with lower Tph initiates LLPS, followed by the demixing of another ELP with higher Tph (Movie S1). In addition, we swapped the fluorophore labels on ELPs and titrated labelled ELPs into non-labelled ELPs at different ratios (Extended Data Fig. 2). The identical organization was observed in both control experiments, suggesting that the fluorophore labelling does not alter the organization nor the partition of the multi-component ELP condensates. These findings supported that the partially miscible and immiscible ELP condensates adopted a “phase within phase” architecture, resembling multiphasic membraneless organelles in cells.
Micropolarity governs the organization of ELP condensates
Notably, we observed unexpected miscibility that contradicts previous understanding. For instance, the hydrophobic V-120 is almost fully miscible with polar QV6-112, however partially miscible with positively charged KV6-112, yet most surprisingly immiscible with non-charged, aliphatic V5A2G3-120. In addition to allowing LLPS of ELP in 2 M NaCl buffer, we repeated the dual-color imaging experiments in 500 mM NaCl buffer with a reduced charge shielding effect (Supplementary Fig. 3). The organization and miscibility of the ELP dual-component droplets in 500 mM NaCl buffer resemble the result in the 2 M NaCl solution. Furthermore, we discovered that dual-component ELP condensates prepared by mixing two already phase-separated ELP samples resulted in identical condensate structures compared to the ones from the co-phase separation of binary ELP solution (Extended Data Fig. 3). Collectively, these results suggested that the core-shell structures of ELP condensates with unexpected miscibility are not solely determined by the nature of their side chain hydrophobicity or charges, nor as transient kinetically stable states due to one ELP condensate caught into the other one. Instead, the structural arrangements and partition of these dual-component condensates are thermodynamically stable, suggesting that innate physiochemical determinants in condensates’ microenvironment would be responsible for the structural arrangements and partition of multiphasic condensates.
To interrogate the biophysical properties of ELP condensates’ microenvironment, we integrated the environmentally sensitive fluorophores with fluorescence lifetime imaging microscopy (FLIM) to quantify the microenvironment of the condensates (Fig. 2a). The 7-sulfonamide benzoxadiazole fluorophore (hereinafter, SBD) was used to report micropolarity in condensates’ interior owing to its increasing fluorescence lifetime with decreasing polarity28,29. A molecular rotor-based boron dipyrromethene (BODIPY) fluorophore was used to measure microviscosity, as its fluorescence lifetime elongates with increasing viscosity30. Micropolarity and microviscosity measured by SBD and BODIPY represent the averaged properties from the ensemble of functional groups, peptide backbones, salts and solvent molecules in the close proximity of the fluorophores, revealing important physiochemical information in the condensates’ interior. In the process of phase separation, the interactions among biomacromolecules are more favoured than the interactions between biomacromolecule and solvent (often water), causing the recruitment of biomacromolecules and the elimination of water molecules. As a result, the microenvironment of biomolecular condensates is less polar and more compared to the surrounding dilute solution.
Figure 2. Quantitative measurement of the biophysical properties of ELP condensates via FLIM imaging method enabled by environmentally sensitive fluorescent probes.

a, The chemical structure of SBD and BODIPY fluorophores for FLIM imaging. b-c, Pseudo colour fast FLIM images of SBD (b) or BODIPY (c) labelled ELP condensates. The colour bars represent the range of the average fluorescence lifetime of SBD or BODIPY, respectively. Scale bars, 10 μm.
We first measured the micropolarity and the microviscosity of individual ELP droplets, using SBD NHS-ester or BODIPY NHS ester labelled on the N-terminus of ELP via amine-NHS chemistry. To avoid potential artifacts introduced by fluorescent labelling, only 0.5% of ELP chains were labelled in the in vitro imaging experiments. Additional experiments were conducted to rule out the possibility of fluorophore scaffold interference (Extended Data Fig. 3) and aggregation-caused quenching (ACQ) effects (Supplementary Fig. 4), thereby supporting the reliability of the imaging data.
For SBD-labelled ELP droplets, the fluorescence lifetime spans from 5.7 ns for V5A2G3-120 to 10.9 ns for V2I7E-40 (Fig. 2b and Supplementary Figs. 5-6). The intensity-weighted mean fluorescence lifetime (τAvInt) of SBD is an indication of the scale of micropolarity in the condensates’ microenvironment. Here, we referenced the τAvInt to the dielectric constant (ε) values, the most accepted polarity scale, by calibrating SBD lifetime in pure solvents with known dielectric constants (Extended Data Fig. 4)31. The V2I7E-40 and V-120 droplets demonstrated surprisingly non-polar microenvironments (ε = 7.4 and 7.7), despite that V2I7E-40 contained the charged residue of glutamic acid. QV6-112 (ε = 11.3) and KV6-112 (ε = 11.8) droplets showed moderately polar microenvironments. While no charged or polar residues were found within V5A5-120 and V5A2G3-120, they formed the most polar condensates correlating to ε around 18.9 and 22.4, respectively. ELP condensates were stable over the time course of 12 hours, with minimal changes in the shapes and micropolarities (Supplementary Fig. 7). Hydrophobic interaction is one of the major driving forces for intracellular protein LLPS and the main determinant for ELP LLPS. The hydrophobicity of the ELP condensate interiors was evaluated by Nile Red and bis-ANS using lambda scanning microscopy and fluorescence emission analysis, respectively. As expected, hydrophobicity of the ELP condensates was determined to be inversely correlated to their micropolarity (Extended Data Fig. 5). At the reduced NaCl concentration (500 mM), ELPs form more polar droplets corresponding to dielectric constant values ranging from 17.3 to 45.2 in the 500 mM NaCl solution (Supplementary Fig. 8). The micropolarity ranking among different ELP condensates, however, remains unchanged in the reduced NaCl solution.
Similarly, the microviscosity of the ELP condensates was also measured using BODIPY (Fig. 2c and Supplementary Fig. 9), whose fluorescence lifetime was correlated to viscosity values via a standard curve (Extended Data Fig. 6). V5A2G3-120 and V5A5-120 showed the least viscous microenvironment with the microviscosity (η) calculated to be 1.6 Pa·s and 2.3 Pa·s, respectively. Whereas V-120 exhibited the most viscous microenvironment, with its microviscosity calculated to be 15.8 Pa·s. The observed microviscosity values are in good agreement with the diffusion rankings of ELP chains from FRAP experiments (Supplementary Fig. 10), suggesting that the microviscosity is dictated by the enhanced interactions of the dense phase networks.
We then focused on the multicomponent ELP condensates and quantified the micropolarity and microviscosity of the outer shell and the inner core. When representative biphasic ELP condensates were prepared by mixing V-120 with QV6-112, KV6-112, V5A5-120 and V5A2G3-120 individually, we found a wide distribution of miscibility (Fig. 3a). The pseudo-colour fast FLIM image of QV6-112/V-120 droplets demonstrated a uniform micropolarity (ε = 8.2). By contrast, the KV6-112/V-120 droplets formed partially miscible layers, exhibiting a less polar core (ε = 8.2) surrounded by a polar shell (ε = 10.2). The V5A5-120/V-120 and V5A2G3-120/V-120 droplets further increased the micropolarity gap between the core and the shell, wherein the dielectric constant values of the shell and the core were determined to be 21.0 (shell) and 8.2 (core) for the V5A2G3-120/V-120 droplets. Furthermore, microviscosity measurements using the BODIPY probe also revealed a more viscous core than the shell (Extended Data Fig. 7), indicating that the microenvironment of the biphasic ELP droplets has a profound impact on their organization and partition. Furthermore, to investigate whether the abrupt transition between core-shell interfaces could modulate their electric potential, we quantified the electric potential differences between cores and shells using potentiometric dye Di-4-ANEPPS15 (Extended Data Fig. 8). Minimal spectra shift was observed between cores and shells of ELP biphasic condensates. This result suggests that different ELP condensates have similar ion selectivity, therefore incapable of mediating large electric potentials across the core-shell interfaces. In addition, charged residuals of ELP, such as the Lys in KV6-112, are likely in their charge-neutral form.
Figure 3. Micropolarity governs the organization and partition of the multi-component protein condensates.

a, FLIM images and histogram plots of dual SBD-labelled binary ELP condensates. Scale bars, 10 μm. b, Relationship between the partition coefficient and the dielectric constant differences of binary ELP condensates. c, Schematics showing the relationship between miscibility and polarity differences between two subcompartments of ELP condensates. d, Schematics showing the polarity differences between the inner and the outer layer of multiphasic ELP droplets. e, Multi-scale simulations used to simulate the surface tension and dielectric constant of ELP condensates. Surface tension is calculated using the MARTINI model, and the dielectric constant is calculated using all-atom simulations. f, Comparison between the experimental dielectric constant (εexp) and the simulated dielectric constant (εsim). g, Comparison between εsim and the simulated surface tension (𝛄). h, Comparison between the εexp and 𝛄. In (f-h): figure legends, dots, V2I7E0; squares, V10; triangles, QV6QV2; diamonds, K0V6K0V2; crosses, V5A2G3. The superscript 0 indicates non-protonated K and protonated E (Table S1). ρ, Pearson correlation coefficient. Error bars, standard deviations from 5 independent time windows (τ) or from 3 different starting configurations (ε).
We also evaluated whether micropolarity or microviscosity is more important to the partition of biphasic ELP droplets. To this end, we calculated the partition coefficient (P) of the component ELPs from dual-colour confocal images. The P values were plotted against the difference in micropolarity (Δε) or microviscosity (Δη) of the individually formed ELP droplets under identical conditions and fitted with exponential curves. For micropolarity, we observed a positive correlation between the P values and Δε (Fig. 3b, R2 = 0.75), suggesting that the miscibility of the biphasic ELP condensates is negatively correlated with the micropolarity differences between the two components. By contrast, Δη exhibited a poor correlation with the P values (Extended Data Fig. 7, R2 = 0.52). Taken together, micropolarity demonstrated a more determinant role to control the organization and partition of the multiphasic protein condensates (Fig. 3c-d). In addition to the micropolarity differences, chain length also played a significant role to determine the miscibility. By comparing the partition coefficient of V-60/V5A2G3-60 and V-120/V5A2G3-120, we found a reduced partition coefficient (favoured miscibility) for V-60/V5A2G3-60 amid similar micropolarity difference, suggesting a reduced entropic penalty during mixing (Supplementary Fig. 11).
Interfacial tension was previously reported to play an important role in the structural organization of multiphasic condensates, albeit the correlation between interfacial tension and the physiochemical property remains elusive19,20,22. To examine the interfacial tension of ELP condensates, we measured their contact angles on hydrophilic surfaces (Extended Data Fig. 9). Non-polar V-120 droplet exhibited greater interfacial tension, reflected by its larger contact angles of 122° ± 8° on hydrophilic glass surfaces, than polar ELP condensates (contact angles between 110° - 114°). To explore this relationship further, we employed a multiscale simulation approach. Utilising an all-atom representation, we calculated the dielectric constant (εsim) of droplets formed by simplified 10 amino-acid ELP fragments (Fig. 3e and Supplementary Fig. 12), resulting in similar values compared with experimental dielectric constants (εexp) acquired under the same condition with simulation (Fig. 3f and Supplementary Fig. 13). Our simulations further suggest that the charged residues may adopt neutral states as a result of the more hydrophobic condensate interior, resulting in non-protonated K and E. From our multiscale model, we also calculated the surface tension (γsim) of ELP droplets (Supplementary Table 1), revealing negative correlations between γsim and dielectric constant, either εsim (Fig. 3g) or εexp (Fig. 3h). Taken together, these results suggest that the micropolarity of ELP droplets dictates their water-condensates interfacial tension, thus controlling the structural organization and partition of multiphasic ELP condensates.
Changes in micropolarity alter multiphasic structures
Our results marked the importance of micropolarity in governing the structure and partition of multiphasic protein condensates. If this principle holds, then the perturbation of micropolarity should change the organization of the multiphasic condensates (Fig. 4a). To test this notion, we assembled coacervates of AF 647-labelled V2I7E-40 and fluorescein-labelled QV6-112, which formed fully miscible droplets with a homogenous micropolarity (τ = 3.9 ns and ε = 32.9; Fig. 4b-c, left panel). A 12-residue arginine repeat polyR was used to modulate the QV6-112/V2I7E-40 condensate. PolyR undergoes strong electrostatic interaction with V2I7E-40, yet minimally interacts with charge-neutral QV6-112 (Supplementary Fig. 14). When coumarin-labelled polyR was introduced to the V2I7E-40/QV6-112 droplet, we observed the miscible condensates segregate into punctuated V2I7E-40/polyR enriched cores and QV6-112 enriched shell (Fig. 4b, right panel). Subsequential FLIM imaging (Fig. 4c) and fluorescence lifetime histogram analysis (Fig. 4d) showed the emergence of less polar V2I7E-40/polyR-enriched cores (longer SBD lifetime indicated by the black arrow on Fig. 4d) surrounded by QV6-112-enriched shell. These results demonstrated a “push-in” model, wherein micropolarity reduction of the newly formed phase could drive its segregation from miscible condensates, forming more hydrophobic cores inside the shells (Fig. 4a, “push-in” model).
Figure 4. Modulating the structural organization of multi-component protein condensates through tuning micropolarity.

a, Illustration of the de-mixing of miscible protein condensates into multi-subcompartment protein condensates by the addition of a third interaction-enabling component. b, Triple-colour confocal images of protein condensates formed by AF 647-labelled V2I7E-40 and fluorescein-labelled QV6-112 in the absence or presence of coumarin-labelled polyR. c, FLIM images of protein condensates formed by SBD-labelled V2I7E-40 and SBD-labelled QV6-112 in the absence or presence of polyR. d, Fluorescence lifetime histogram plot for images in (c). e, Dual-colour confocal images of protein condensates formed by fluorescein-labelled tau187 and AF 647-labelled V2I7E-40 in the absence or presence of different concentrations of polyU. f, FLIM images of protein condensates formed by SBD-labelled tau187 and SBD-labelled V2I7E-40 in the absence or presence of different concentration of polyU. g, Fluorescence lifetime histogram plot for images in (f). Scale bars for images in (b-c) and (e-f), 5 μm.
We next examined whether micropolarity elevation would lead to the formation of shells from miscible droplets. To this end, we generated coacervates of V2I7E-40 and the 187 amino-acid C-terminal half of the longest isoform of tau 2N4R proteins (hereinafter named tau187). The tau187/V2I7E-40 droplet was found to be fully miscible, with a homogeneous micropolarity corresponding to a dielectric constant around 24.9 (τ = 5.2 ns, Fig. 4e-f, left panel). It has been reported that tau187 interacts with RNA to form tau/RNA coacervates (Supplementary Fig. 15)32,33. When we added 15 µg/mL polyU to the tau187/V2I7E-40 droplet, tau187 formed coacervation with polyU and was enriched on the outer rim of the V2I7E-40 condensates (Fig. 4e, middle panel). Higher polyU concentration led to the expansion of the outer tau187 enriched layer to a greater extent (Fig. 4e, right panel). Accordingly, FLIM experiments revealed an increasing micropolarity of the tau187-enriched phase with accumulating polyU, corresponding to a dielectric constant gain from 24.9 to 35.8 (Fig. 4f-g). Thus, the influx of polyU drives the segregation of single-phase tau187/V2I7E-40 condensates into dual-layered condensates, wherein tau187 forms new phases with polyU. Tau187/polyU-enriched phases were located adjacent, and on the peripheral of the V2I7E-40 condensates due to the increased micropolarity (Fig. 4a, “pull-out” model).
Micropolarity shapes the multiphasic structure of nucleolus
To verify whether micropolarity could dictate the structure of the cellular multiphasic membraneless organelles, we investigated the microenvironment of the multilayered nucleolus in eukaryotic cells. The nucleolus consists of three distinct phases: fibrillar center (FC), dense fibrillar component (DFC), and granular component (GC)18–20. Structurally, the FC is embedded inside the DFC, and the FC-DFC assembly is further encapsulated by the GC layer (Fig. 5a-b). First, we confirmed the hierarchical structure of nucleolus in HEK293T cells by co-expression of the GC component nucleophosmin (EGFP-NPM1) and the DFC component fibrillarin (FBL-Halo), the latter was labelled with the HaloTag® TMR ligand for multi-colour confocal imaging (Fig. 5a, left panel). When transcription was inhibited by the RNA polymerase I inhibitor, actinomycin D (ActD), the FC and DFC layers were found to be spatiotemporally translocated to the outside and juxtaposed on the peripheral of the GC layer, forming nucleolar caps (Fig. 5a-b)34,35.
Figure 5. Micropolarity measurements in healthy and transcriptional-arrested nucleolus revealed a micropolarity inversion between DFC and GC subcompartments accompanied with organization change.

a, Triple-colour imaging of HEK293T cells co-expressing EGFP-NPM1 and FBL-Halo in the presence or absence of actinomycin D (Act D). b, Multiphasic structures of the nucleolar subcompartments. c, Chemical structure of S-SBD-Halo fluorophore. d-e, Representative FLIM images and fluorescence lifetime (τAvInt) statistics of cells expressing NPM1-Halo or FBL-Halo labelled by S-SBD-Halo in the absence of Act D. n = 19 for NPM1 and n = 13 for FBL in (e). f-g, Representative FLIM images and τAvInt statistics of HEK 293T cells expressing NPM1-Halo or FBL-Halo labelled by S-SBD-Halo probes in the presence of Act D. n = 17 for NPM1, n = 30 for FBL in the entire nucleolus, n = 30 for FBL in the nucleolar body and n = 27 for FBL in the nucleolar caps in (g). h, FLIM images of HEK 293T cells expressing Halo-Nop56 IDR or Halo-NOPP 130 labelled by S-SBD-Halo probes in the presence of 0.2 μM Act D. Scale bars, 2 μm for zoom-in figures and 5 μm for others. Data represent mean and standard deviations from 3 distinct samples. Statistical significance was calculated using two-tailed t-test. **0.01<P<0.001, ****P<0.0001.
To capture the nucleolus micropolarity changes associated with this structural relocation, we synthesized the sulfur-substituted SBD-Halo ligand (S-SBD-Halo) to enable the live-cell FLIM experiment (Fig. 5c and Extended Data Fig. 10). First, we measured the micropolarity value surrounding NPM1 and FBL as representations of the overall micropolarity profiles for GC and DFC layers. To this end, we expressed NPM1-Halo or FBL-Halo in HEK293T cells in the presence of S-SBD-Halo to determine the micropolarity of the GC and DFC regions (Fig. 5d-e). The micropolarity of the GC and DFC regions were correlated to dielectric constant values of 7.1 (τ = 7.6 ns; n = 19) and 6.5 (τ = 8.1 ns; n = 13), respectively. These data reflected that the GC layer harboured a slightly more polar microenvironment compared to the DFC layer. Upon the treatment of Act D for 2 hours, the GC demonstrated a reduced micropolarity (τ = 8.7 ns, corresponding to ε = 6.0), whereas the DFC showed an increased micropolarity (τ = 8.0 ns, corresponding to ε = 6.7) (Fig. 5f-g). These opposing changes in micropolarity between the GC and the DFC overturned the original micropolarity ranking between the two layers, which is found to be associated with nucleolar cap formation. This notion was further evidenced by the FLIM images (Fig. 5f, zoom-in) and statistical analysis (Fig. 5g) of micropolarity data from FBL protein in the transcription-stalled condition, in which the micropolarity determined in the nucleolar caps (τ = 7.6 ns, ε = 7.2) is higher than in the rest of the nucleolar bodies (τ = 8.1 ns, ε = 6.5). In addition to NPM1 and FBL, we observed a similar trend using the DFC-enriched NOP56 protein (C-terminal intrinsically-disordered region, fused with HaloTag)36, as well as the nucleolar phosphoprotein p130 (NOPP 130, encoded by NOLC1 gene). In both cases, the nucleolar cap regions demonstrated a shorter S-SBD lifetime (hence a higher micropolarity) compared to the rest of the nucleolar bodies (Fig. 5h). These findings provide direct evidence to demonstrate that the structural variation of the nucleolus is directly associated with the micropolarity changes among different layers.
Discussion
We have uncovered a new physiochemical principle that micropolarity governs the layered structure formation and substance partition of multiphasic condensates. We found that mixing biomolecular condensates with similar micropolarity nature, either both hydrophilic or hydrophobic, resulted in condensates with fully miscible components. Whereas, mixing condensates displaying different micropolarities led to multiphasic condensates. Micropolarity is an innate biophysical physiochemical parameter that originated from the relative scale of interactions between biopolymer-biopolymer and biopolymer-solvent. From the perspective of Flory-Huggins mean field theory, a greater micropolarity difference between the subcompartments of multiphasic condensates indicates disfavoured heterotypic interactions in reference to homotypic interactions. Previous research demonstrated that the condensates-water interfacial tension, which is an indicator of condensates’ hydrophobicity, is the key determinant for multiphasic LLPS structures. Our data agreed well with the previous findings and delivers new perspectives with a focus on the microenvironments of condensates.
Several lines of evidence from this work support micropolarity as the key factor to determine the miscibility of multiphasic condensates. First, the exterior subcompartment is always more polar than the interior subcompartment. Second, the inversion of the micropolarity ranking is accompanied with the inversion of the multiphasic structure. Third, the micropolarity of condensates is inversely related to the water-condensates interfacial tension. While the miscibility of condensates is determined by the free energy of mixing, measuring the free energy of mixing in all condensates is impractical, in particular for living systems. Furthermore, neither the differences in contact angles nor polarities are changed proportionally with the free energy of mixing. Entropic penalty of mixing could be affected by the length of biomacromolecules, as evidenced by the lower partition coefficient value of V-60/V5A2G3-60 compared with V-120/V5A2G3-120, amid similar micropolarity differences (Supplementary Fig. 11). Thus, future efforts call for all-inclusive mathematical equations comprising both enthalpic and entropic determinants are of great interest to the understanding of multiphasic membraneless organelles.
Our results demonstrated the delicate control of the organization and partition of the multiphasic condensates by tuning the micropolarity of individual components. The dynamic interplay between the micropolarity and layered structures offers a new insight regarding multiphase organelle regulation in live cells. The multi-valent interaction between droplets’ component proteins with other proteins/RNAs influx into the droplets upon specific signals could change the overall micropolarity of the newly formed complexes, which destabilize the droplets by changing the free energy of mixing and cause the organization and partition change. Our discovery provides a novel perspective regarding how multi-component biomolecular condensates are organized in vitro and in live cells. The understanding of condensates’ micropolarity, in combination with other physical properties such as microviscosity and recently proposed capillary forces, could collectively help us to probe the complex biophysical states of membraneless organelles, and ultimately deepen our understanding of their regulation and cellular functions.
Methods:
Construction of ELP plasmids.
The desired ELP sequences were constructed in pET-28a (+) vector using the previously reported Recursive Directional Ligation by Plasmids Reconstruction (Pre-RDL) method37. All restriction enzymes were purchased from New England Biolabs® unless otherwise specified. The original pET-28a(+) vector (Novagen®) was first modified to insert BseRI and AcuI enzyme recognition sequences to allow Pre-RDL cloning. 1.5 µg pET-28a(+) plasmids were digested with XbaI and BamHI at 37°C for 4 hrs, followed by dephosphorylation with rSAP at 37°C for 2 hrs. The reaction mixture was purified with a PCR clean-up kit (Omega E.Z.N.A.® Cycle Pure Kit) to acquire the linearized vector. Two 5’-phosphorylated DNA oligos (oligo 1 and oligo 2, Supplementary Table 2) were synthesized and annealed at 2 µM concentration in T4 DNA ligation buffer by heating the reaction to 95°C for 3 minutes, followed by stepwise cooling down at 0.25°C/min rate to room temperature to resolve the insertion part. The vector and the insertion were mixed at a 1:3 molar ratio and incubated with T4 DNA ligase at room temperature for 2 hrs. The ligation product was transformed into Stbl3 chemically competent cells (Invitrogen™, C737303), allowed to recover for 1 hr in SOC at 37°C. The cells were plated on LB agar plated supplied with 50 µg/mL of kanamycin sulfate. A single E. coli colony was picked, amplified and sequenced to resolve the correct plasmid, hereinafter named the modified pET 28a(+).
Two 75 bp 5’-phosphoralated DNA oligos encoding the ELP sequence (GXGVP-5, oligo 3 to oligo 20, Supplementary Table 2) were synthesized and annealed at 2 µM concentration in T4 DNA ligation buffer by heating the reaction to 95°C and cooling slowly as described above. 1.5 µg of modified pET 28a(+) plasmid was digested with BseRI at 37°C for 4 hrs, followed by dephosphorylation with rSAP at 37°C for 2 hrs. The linearized modified pET 28a(+) vector was purified with a PCR clean-up kit, and ligated with DNA oligos with T4 DNA ligase at room temperature for 2 hrs. The cells were plated on LB agar plated supplied with 50 µg/mL of kanamycin sulfate. Single E. coli colonies were picked, amplified and sequenced to resolve the correct plasmid. Multiple rounds of Pre-RDL cloning were conducted until the gene-of-interest reaches the desired length. In brief, 2 parallel reactions were set up: 4 µg of plasmids encoding ELP genes were either digested by 10 U BseRI and 10 U BglI for 3h, or by 10 U AcuI and 10 U BglI for 3h. Both digestions were separated by low melting point agarose gel, and the correct bands were excised from agarose gel and purified (Omega E.Z.N.A.® Gel Extraction Kit). An equal molar of the parallel reaction products was mixed, and incubated with T4 DNA ligase at room temperature for 1h. The ligation product was transformed into Stbl3 chemically competent cells, amplified and sequenced to resolve ELP constructs with desired lengths. Finally, a short leader sequence (MSKGP) and a short trailer sequence (GWP*) (oligo 21 to oligo 24, Supplementary Table 2) were introduced to the ELP gene through the Pre-RDL method to resolve desired ELP constructs.
Construction of other plasmids.
The gene encoding tau 2N4R, NPM1 and FBL was acquired from the human cDNA library at the Biomedical Research Core Facility at Westlake University. The positively charged C-terminal half of Tau 2N4R between residual 255–441, referred to as tau187, was subcloned into a pET-29b(+) vector using the polymerase incomplete primer extension (PIPE) cloning method38. The NPM1 and FBL were subcloned into the pHTC mammalian expression vector (Promega, G7711) to generate NPM1-Halo and FBL-Halo plasmids, respectively. The correctness of the insertion for each plasmid was examined by DNA Sanger sequencing.
Expression and purification of ELP and tau187 proteins.
ELP purification method was adapted from a previous publication25. Plasmids were transformed into E. coli BL21 DE3* strain (Invitrogen™, C600003). A single colony was picked and inoculated into 5 mL of Terrific Broth (TB) containing corresponding antibiotics and cultured at 37 °C with shaking at 220 rpm. When the OD600 reached 0.6–0.8, the starting culture was transferred into large culturing flasks containing 1 L TB to allow further growth. When the OD600 reached 0.6–0.8, isopropyl ß-D-1-thiogalactopyranoside (Sangon Biotech®, A100487) was introduced to a final concentration of 0.5 mM to induce the expression of ELP. Cultures were allowed to shake at 37°C for another 16–20 h, harvested and stored at −80°C freezer. The ELP purification was carried out using the inverse transition cycling (ITC) method39. In brief, the E. coli cells were thawed and lysed by sonication in phosphate buffer saline (PBS) in the presence of 1 mM phenylmethyl sulfonyl fluoride (Sangon Biotech®, A610425). The lysate was cleared out by centrifuging at 16,000 g for 60 min at 4 °C. To the supernatant, polyethyleneimine (branched, M.W. 1,800, Alfa Aesar) was added to a 0.5 w/v% final concentration to precipitate DNA and RNA, followed by another centrifuging at 16,000 g for 20 min at 4 °C to remove DNA and RNA. To the newly obtained supernatant, solid NaCl powder was directly added (12 g NaCl for every 50 mL supernatant, approximately ~4 M NaCl) to precipitate ELP. Once all NaCl was dissolved, the solution was centrifuged at 16,000g for 20 min at 30°C. The pellet was saved and re-dissolved in ice-cold PBS. A further centrifuge at 16,000g for 20 min at 4°C was conducted to remove undesired precipitation. Such precipitation-solvation cycle was repeated for another 2 times to improve the purity of ELP. Finally, the ELP was dialyzed against ddH2O to remove any residual salt. The resulting protein was analyzed by SDS-PAGE to have >95% purity before being concentrated and flash-freeze. The expression and purification of tau187 were conducted in accordance with the previously published protocols40,41.
In-vitro protein labelling of fluorescent probes using N-Hydroxysuccinimide (NHS) esters and maleimides.
Coumarin-NHS (Sigma-Aldrich®, 36801), fluorescein-NHS (Thermo Scientific™, 46409), fluorescein maleimide (Thermo Scientific™, 62245) and Alexa Fluor™ 647-NHS (Invitrogen™, A37573) were acquired from commercial sources. SBD-NHS, BODIPY-NHS and SBD-maleimide were synthesized in-house and characterized via NMR and mass spectrometry. All fluorophores’ stocks were prepared in dry DMSO at 10 mM concentration. For the labelling of NHS ester, ELP (final concentration at ~ 20 mg/mL) and dyes (20% molar ratio of ELP) were mixed in sodium bicarbonate buffer (100 mM NaHCO3, pH 8.4) and allowed to react overnight on ice. The separation of labelled ELP with unreacted dyes was achieved using the PD MidiTrap™ G-25 desalting column (Cytiva®). Tau187 was labelled with fluorescein-maleimide and SBD-maleimide to allow fluorescence intensity and lifetime imaging. For maleimide labelling, tau187 was first exchanged in labelling buffer (20 mM HEPES, pH 7.5, 100 mM NaCl) by dialysis, followed by treatment with 2 mM tris(2-carboxyethyl)phosphine (TCEP) for 1h at room temperature. The labelling reaction was further carried out by adding 100% molar ratio equivalent of dye-maleimide into the reaction mixture, allowed to react for 2h on ice. Unreacted dye and TCEP were removed by PD MidiTrap™ G-25 desalting column. NHS-labelled ELPs and maleimide-labelled tau187 were further mixed with unlabelled ELP or tau187 in liquid-liquid phase separation assay, resulting in approximately 0.5% of labelled biomacromolecules in biomolecular condensates.
Liquid-Liquid Phase Separation (LLPS) assays of ELP.
ELPs belong to artificial polypeptides which display lower critical solution temperature (LCST) behaviour. The LLPS of ELP could be triggered by the sudden increase of either ionic strength or the environment temperature. Two LLPS conditions were therefore used to initiate ELP LLPS. The first condition is to dilute the concentrated ELPs (originally in ddH2O) into a high-salt (HS) buffer, which results in the final LLPS condition being 70 µM ELP (or 140 µM ELP for the dual-component scenario) in 50 mM HEPES pH 7.0 and 2 M NaCl. Upon mixing thoroughly on ice, the solution was brought to room temperature to trigger the LLPS of ELP in HS condition. Finally, 10 µL of aliquot was transferred onto a glass slide (Sangon Biotech®, F518102) containing a 0.5 mm depth silicon spacer (Grace Bio-Labs, GBL664507). A cover glass (Sangon Biotech®, F518115) was placed on top of the spacer. The entire “sandwich-like” cover glass assembly was flipped over to allow examinations using an inverted confocal microscope. Another LLPS condition was used to examine the phase behaviour of ELP in buffers with reduced ionic strength. In this regard, the final LLPS condition was set to be 70 µM ELP (or 140 µM ELP for the dual-component scenario) in 50 mM HEPES pH 7.0 and 500 mM NaCl. Similarly, 10 µL aliquot was transferred into the “sandwich-like” cover glass assembly. The cover glass assembly was heated to 40 °C for 10 min on the microscope to initiate LLPS using a built-on heat plate (Instec Inc.).
LLPS assays of V2I7E-40 and QV6-112 in the presence or absence of polyR.
Poly-L-arginine hydrochloride (polyR) consisting of 12 arginines was acquired from a commercial source (Bankpeptide Biological Technology Inc.) and labelled by coumarin-NHS allow fluorescence imaging. 70 µM V2I7E-40 and 70 µM QV6–112 were mixed in 50 mM HEPES pH 7.0 and 150 mM NaCl in the presence or absence of 50 µM polyR on ice. A low-salt condition was used to avoid the shielding of electrostatic interaction between negative-charged V2I7E-40 and positive-charged polyR. 10 µL of aliquot was transferred onto a glass slide. A 0.5 mm depth silicon spacer and a cover glass were installed to allow observation under the confocal microscope. The cover glass was heated to 40°C to initiate LLPS using a built-on heat plate.
LLPS assays of tau187 and V2I7E-40 in the presence or absence of polyU.
Tau187 was first purified and concentrated in the storage buffer containing 20 mM HEPES pH 7.0 and 500 mM NaCl. In the absence of RNA, tau187 remained soluble up to multi-millimolar concentration in this buffer condition. Tau187 was mixed with V2I7E-40 to result in the final LLPS condition to be 70 µM tau187 and 70 µM V2I7E-40 in 20 mM HEPES pH 7.0 and 150 mM NaCl in the absence or presence of 15 µg/mL or 30 µg/mL polyuridylic acid (polyU, 800–1000 kDa, Sigma-Aldrich®, P9528). 10 µL aliquot was transferred to glass slides to allow microscope examination under 40°C LLPS using a built-on heat plate.
Synthetic procedures of SBD- and BODIPY-based fluorophores.
All reagents were acquired from commercial sources unless otherwise stated. Reactions were carried out in round bottom flasks (Synthware®) under nitrogen protection and monitored by thin layer chromatography (Synthware®). Products were purified using either flash column chromatography (General-Reagent®) or preparative-scale high-performance liquid chromatography (Waters™ LC Prep 150 System) equipped with reverse phase C18 column (XBridge® Perp C18 5µm OBD™). 1H and 13C NMR were performed on a Bruker AVANCE NEO 600 MHz spectrometer in d6-dimethylsulfoxide or chloroform-d (Cambridge Isotope Laboratories). High-resolution mass spectra were acquired on Waters SYNAPT-G2-Si ultra-high performance liquid chromatography time-of-flight mass spectrometer. Chemical shifts were reported in reference to the residual solvent peaks of DMSO-d6 or CDCl3. The synthetic route for SBD-NHS ester, SBD-maleimide, SBD-methyl ester and BODIPY-NHS ester could be found in Supplementary Notes 1-2, whereas the synthetic method for S-SBD-Halo and BODIPY-Halo ligand could be found elsewhere28,30.
Confocal and fluorescence lifetime imaging (FLIM) imaging procedures for in-vitro samples.
The phase-separated samples were first allowed to settle on the glass coverslip for 10 minutes before imaging. Both fluorescence intensity and lifetime images were acquired by a Leica STELLARIS 8 FALCON confocal microscope equipped with a 405 nm laser and a pulsed White Light Laser (WLL) using 63x magnification. For Coumarin, fluorescein and Alexa Fluor™ 647 fluorophores were excited by 405 nm, 504 nm and 653 nm laser lines, respectively. Coumarin and Alexa Fluor™ 647 were excited simultaneously, whereas the excitation of fluorescein was performed using a separate track to avoid crosstalk. Image analysis was achieved using Leica Application Suite X (LAS X) and Fiji software42. FLIM images of SBD and BODIPY labelled in-vitro samples were imaged using pulsed laser lines of 448 nm and 488 nm with a repetition rate of 10 and 20 MHz, respectively. Region-of-interest (ROI) was selected using the LAS X FLIM/FCS software to give fluorescence lifetime histograms and the fluorescence lifetime decay curves. Finally, the fluorescence lifetime decay was fitted using a multi-exponential reconvolution model to give intensity-weighted mean fluorescence lifetime (τAvInt).
Fluorescence emission spectral scan (Lambda scan) of ELP condensates.
Lambda scan images were acquired on a Zeiss LSM 980 confocal microscope equipped with a 63x/1.4 oil immersion objective lens and 32-channel circularly arranged Airyscan2 detectors. Phase-separated ELP samples with the addition of 5 µM Nile Red were first allowed to settle on the glass coverslip for 10 minutes before imaging. Excitation of the ELP samples was achieved by a 561 nm laser, and a total of 14 images representing the emission from 570 nm to 694 nm with an 8.9 nm interval were collected simultaneously. Further analysis of the lambda scan images was accomplished using Zeiss Zen (blue edition) and Fiji software.
Mammalian cell culture, confocal and fluorescence lifetime imaging (FLIM) procedures for cell samples.
HEK293T cells were seeded at 30% confluency in 35 mm glass bottom culture dishes (Cellvis, D35–20-1.5H) treated with poly-L-lysine (Sigma-Aldrich®, P4707) 24 hrs prior to the transfection. Dulbecco’s Modified Eagle’s Medium (DMEM, Gibco™, 11995–065) was used as the primary culture medium supplemented with 10% Fetal Bovine Serum (FBS, Cellmax, SA211.02, LOT#20210715) and 1x penicillin-streptomycin-glutamine (PSQ, Gibco™, 10378–016). The cells were allowed to grow at 37°C under 5% CO2 in a Heracell Vios 160i CO2 incubator (Thermo Fisher Scientific).
For FLIM experiments, when cells reach 40% confluency, half of the old DMEM was replaced with fresh DMEM containing 2 µM (2x) S-SBD-Halo. Hence a final 1 µM S-SBD-Halo fluorophore was used to allow FLIM imaging. Additionally, 1 µg mammalian expression plasmid containing gene-of-interest with HaloTag was transiently transfected into HEK293T cells using 3 µL X-tremeGENE 9 DNA transfection reagent (Roche) diluted in 100 µL 1x OPTI-MEM® I reduced serum medium (Gibco™, 31985–062). The cells were put back into the incubator at 37°C under 5% CO2 to allow protein expression and labelling for 24 hrs. After 24 hrs, the cells were washed with fresh, colourless DMEM/F12 (1:1) medium (Gibco™, 21041–025) containing 10% FBS to remove unbounded HaloTag substrate and phenol red. Live cell FLIM experiments were achieved inside a controlled environmental chamber (37°C, 5% CO2, Okolab) built on a Leica STELLARIS 8 FALCON confocal microscope equipped with a pulsed WLL setting at 448 nm with a 10 MHz repetition rate. For the demonstration of the nucleolar cap, additional cell samples were treated with actinomycin D (Act D, Gibco™, 11805–017) with a final concentration of 0.2 µM 2 hrs prior to the FLIM imaging. FLIM data analysis was achieved using the LAS X FLIM/FCS software.
For dual-colour confocal imaging experiments, half of the DMEM was replaced with fresh DMEM when cells reach 40% confluency in 35 mm glass bottom dishes. A final 0.5 µM TMR HaloTag® ligand (Promega, G8251) was added to the medium to specific labelling with FBL-Halo to allow confocal imaging. 1 µg plasmid encoding EGFP-NPM1 and 1 µg plasmid encoding FBL-Halo were co-transfected into HEK293T cells using 6 µL X-tremeGENE 9 DNA transfection reagent diluted in 200 µL 1x OPTI-MEM® I reduced serum medium. After 24 hrs of expression, Hoechst 33342 (Invitrogen™, H1399) was added to the cell culture with a final concentration of 5 µg/mL. The cells were further incubated for 10 minutes at a 37°C incubator before a quick PBS wash to remove excess fluorophores. The cells were fixed with 4% formaldehyde solution (Thermo Scientific™, 28908) for 10 minutes and washed with PBS. The coverslip was mounted with sterile 50% glycerol. Hoechst 33342, EGFP and TMR were excited by 405 nm, 488 nm and 550 nm laser lines, respectively.
Simulation details for ELP dielectric constant and surface tension.
To investigate the relationship between surface tension and dielectric constant in biological condensates, we performed multiscale simulations on ELP condensates. Specifically, we examined ten ELP repeat versions for five of the sequences studied experimentally, namely V10, V5A2G3, QV6QV2, V2I7E, and KV6KV2. For charged amino acids K and E, both charged (V2I7E− and K+V6K+V2) and uncharged (V2I7E0 and K0V6K0V2) versions were simulated. All simulations were performed in 1 M NaCl. Our simulation methodology began with homopolymer and MOFF simulations43–45 to generate initial structures. Then, we utilized simulations in MARTINI346 to report on condensate surface tension. Finally, we probed the dielectric constant of condensates with all-atom simulations in CHARMM36m with shifted water interactions to correct for disordered proteins47.
To ensure the protein density was the same for each condensate, we began with homopolymer simulations. Our homopolymer force field was based on the MOFF force field, with random coil secondary structure and non-bonded interactions identical to MOFF’s valine-valine interaction. In this force field, we placed 40 homopolymers of 50 residues in length inside a 75 nm by 75 nm by 75 nm simulation box. After the steepest decent energy minimization, we performed an NPT simulation for 0.1 μs at 150 K and 1 bar, resulting in a dense polymer phase.
To optimize specific protein interactions within this phase, we performed MOFF simulations43–45. As ELPs are known to have minimal secondary structures in both the dense and dilute state48,49, we assumed the secondary structure to be similar to that of a random coil and set the equilibrium angle between residues to 127° in all cases. In this force field, we conducted energy minimization, followed by a 0.1 μs NVT simulation, with a timestep of 10 fs. During the simulation, we linearly increased the temperature from 150 K to 300 K. Nonbonded parameters for neutral K and E were identical to the charged versions, but with the charge changed to 0.
The final snapshots from MOFF were used as a starting point for explicit solvent coarse-grained simulations in MARTINI. MOFF is a one-bead per amino acid representation, so we converted this simplified snapshot to an all-atom representation using tleap, which is part of AMBER tools 202050. We then converted the all-atom configuration to a MARTINI3 configuration using martinize244. We enforced neutral termini of the peptide chains and used random coil secondary structure throughout the entire peptide. Next, we expanded the Z- dimension of the simulation box to 40 nm and centered the protein in the simulation box. Thus, all simulations started with box dimensions of 6.3782 nm by 6.3782 nm by 40.0000 nm, which allowed for slab simulations to measure the coexistence between the dense phase and the dilute phase51. After solvating with MARTINI water and 1 M NaCl, we performed the steepest decent energy minimization. Then, we performed NVT equilibration at 313.15 K for 5 ns with a timestep of 10 fs. Next, we performed NPT equilibration at 1 bar and 313.15 K for 10 ns with a timestep of 20 fs. We then used semi-isotropic pressure coupling, sometimes called the NPNAT ensemble, to perform production simulations for 100 μs and used a timestep of 20 fs. The initial 25 μs was discarded for equilibration, leaving 75 μs for analysis. The temperature of these simulations was held at 313.15 K, while the pressure normal to the surface was fixed at 1 bar. This setup allowed for the calculation of surface tension, as discussed below52.
Dielectric constant calculations were based on the fluctuations of partial charges, and thus required all-atom simulations. These simulations were performed in the CHARMM36m force field. Proteins were capped using an acetylated N-terminus and an amidated C-terminus. TIP3P water was used, and the water-hydrogen Lennard-Jones well depth was scaled to −0.10 kcal/mol to better describe IDPs, as has been done previously47. To ensure the reproducibility of our results, we converted 3 different MARTINI configurations for each protein into starting configurations for all-atom simulations. To begin these all-atom simulations, MARTINI simulations at 50 µs, 75 µs, and 100 µs were converted into the CHARMM36m representation using the backward script53. From the output of the backward calculation, we performed energy minimization, followed by an NVT simulation at 313.15 K for 100 ps with a timestep of 1 fs and with position restraints on both the protein backbone and side chain. Next, we performed NPT equilibration at 313.15 K and 1 bar for 5 ns with a timestep of 2 fs. We then conducted NPNAT at 313.15 K and 1 bar in the Z-dimension for 5 ns with a timestep of 2 fs. Finally, we performed NPNAT production runs for 250 ns with a timestep of 2 fs at 313.15 K and 1 bar in the Z-dimension. The first 50 ns was discarded for equilibration, leaving 200ns for analysis.
Finally, not every coarse-grained configuration can be stably converted into higher resolution. When the final snapshot from MOFF simulations failed to result in stable MARTINI representations or the final snapshot from MARTINI simulations failed to result in stable all-atom representations, we iteratively moved back one snapshot and repeated the conversion procedure until a stable configuration was found.
Simulation analysis for ELP dielectric constant and surface tension.
All simulations were analyzed to determine the number of protein clusters. Our code first computed a center of mass contact matrix between peptide molecules with a distance cutoff of 4 nm. Then, using a depth-first search algorithm54, we identified the size of each cluster. Our code was implemented in MDanalysis55.
Our simulation layout placed a dense slab in the x-y plane, and the solvent created a coexisting phase in the z-dimension. In this configuration, we controlled the pressure normal to the protein-solvent interface by performing simulations in the NPNAT ensemble. These assumptions allowed us to calculate the surface tension (τ) as
where is the length of the Z-dimension, is the Z-component of the component of the pressure tensor, is the X-component of the component of the pressure tensor, and is the Y-component of the component of the pressure tensor. We extracted the number of droplets by using our clustering algorithm described above, and is the number of clusters containing 10 or more peptides. Error bars represent the standard deviation over five independent time windows.
To compute the dielectric constant of each condensate, we first centered our simulation on the center of mass for proteins that remained in the largest cluster for over 99% of the simulation time. Next, we computed the dielectric in 20 slabs across the simulation box as
where is the dielectric constant, is the average volume, is Boltzmann’s constant, is temperature, and is the dipole moment of the slab. For each slab, we extracted the dielectric constant at the final timepoint, and constructed a plot of the dielectric constant as a function of Z-axis of the simulation box. We then reported the final dielectric constant by sorting the dielectric profile from the lowest to the highest dielectric, and reporting the histogram bin with the lowest dielectric constant, which corresponds to the region of the simulation with the highest protein density and thus is likely the best approximation for the interior of the condensate.
Statistics and reproducibility.
The partition coefficient values are represented as mean ± s.d. originated from n > 3 dual-color fluorescence images with individually prepared samples. Fluorescence intensity and lifetime images for in-vitro experiments are representative images from n > 3 individually prepared samples, and reproducible using proteins purified from different batch. For live cell experiments, the representative images were selected from 17 – 30 cells examined over 3 independently transfected cell cultures. Two-sided t-test was used to compare fluorescence lifetime in the different subcompartments in healthy and transcriptional-arrested nucleolus. A p < 0.05 was considered significant. For the fluorescence lifetime measured in standardized solvent mixtures, n > 3 imaging areas were examined using fast live mode before taking fluorescence lifetime images. Fluorescence lifetimes are highly reproducible due to the homogeneity of the solvents.
Extended Data
Extended Data Fig. 1. Analyzation of the phase transition temperature and purity of ELP.

a-f, Phase transition processes of ELP were captured by the rapid increase of absorbance signal using a UV-Vis-NIR spectrometer. ELPs were mixed in buffers (50 mM HEPES, pH 7.0) with different molarity of NaCl (0.15 M, 0.5 M, 1.0 M, 1.5 M, 2.0 M) at a final peptide concentration of 70 µM on ice. An assay was designed to gradually increase the sample temperature from 1 °C to 50 °C at 0.5 °C/min rate, while the absorbance at 395 nm was recorded for every 0.5°C of temperature increment. g, Summary of the phase transition temperature of ELPs at different NaCl concentrations. h, SDS-PAGE analysis of the purity of the ELP. The polyacrylamide gel was stained in 0.5 M CuCl2 solution to develop protein bands.
Extended Data Fig. 2. Fluorophore labelling does not alter the organization and partition of dual-component ELP condensates.
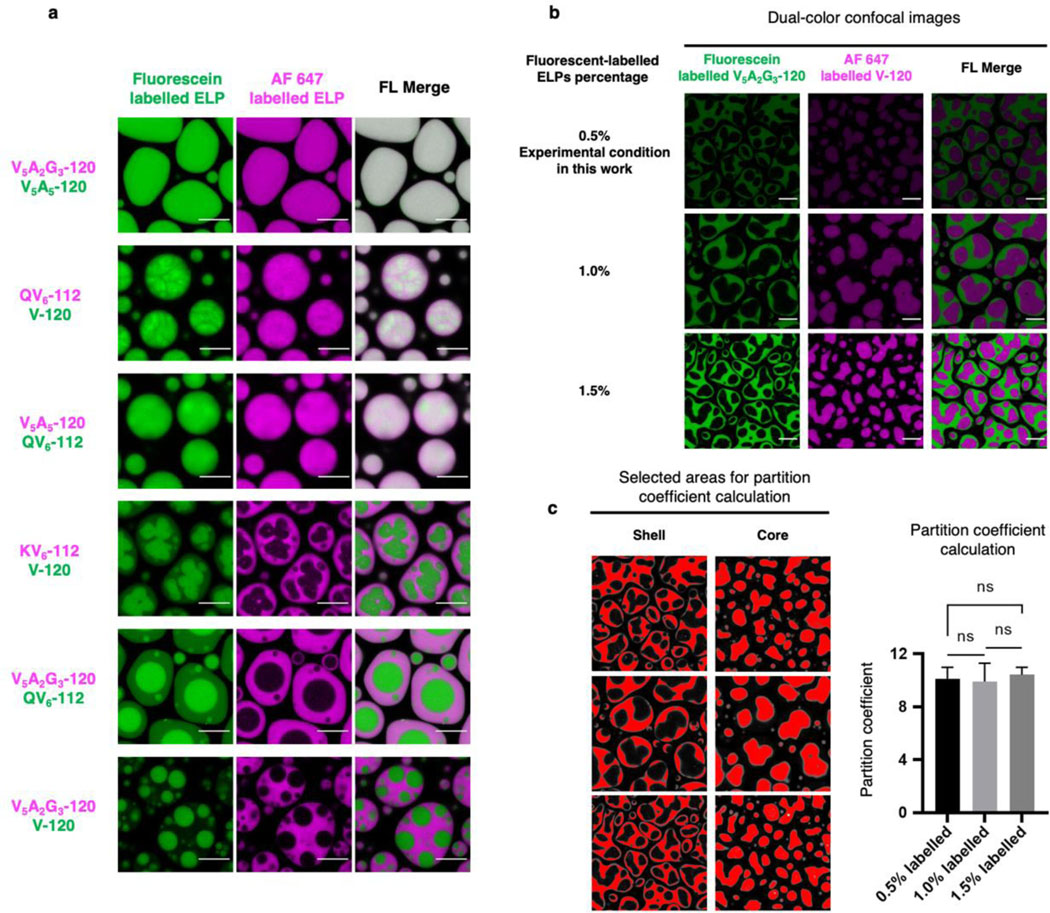
a, Swapping fluorophores on ELP preserved the organization of dual-component ELP condensates. Repeating dual colour imaging from Fig. 1c with swapped labelling fluorophores yields the dual component ELP condensates with identical organizations but inverted colours. b-c, Dual colour confocal images with varying concentrations of labelled ELPs yield similar core-shell structures with identical partition coefficients. b, Dual-color confocal images of V5A2G3-120/V-120 condensates with 0.5% (experimental condition), 1% and 1.5% fluorescent labels. c, Selected areas and values of partition coefficient calculated from the images in (b). Data represent mean and standard deviations from 3 distinct samples. Statistical significance was calculated using two-tailed t-tests. ns, non-significant. Experimental condition: 70 µM V5A2G3-120 and 70 µM of V-120 labelled with different percentages of fluorescein-NHS and AF 647-NHS were mixed in phase separation buffer (50 mM HEPES, pH 7.0, 2 M NaCl) and incubated at RT. Scale bar, 10 µm.
Extended Data Fig. 3. Dual component ELP droplets prepared by mixing two already phase-separated ELP samples resulted in identical core-shell structures compared to the co-phase separation of binary ELP solution mixtures.

Two different ELPs (labelled with fluorescein or AF 647) were allowed to phase separate individually in phase separation buffer (50 mM HEPES, pH 7.0, 2 M NaCl) at a final concentration of 140 µM at room temperature. The two phase-separated samples were then mixed with an equal amount and allowed to settle for 15 min on glass coverslips for confocal imaging. Scale bars, 10 µm.
Extended Data Fig. 4. Chemical structure and photophysical property of SBD.

a, The chemical structure of free SBD-NHS probe and labelled SBD structure on the N-terminus or lysine residuals of ELP. b, The chemical structure of SBD-methyl ester. SBD-methyl ester resembled the chemical structure of labelled SBD on proteins, hence was used for photophysical property measurements. c, Fast FLIM images of SBD-methyl ester in solvent mixtures of methanol and 1,4-dioxane. Scale bars, 10 µm. d, SBD lifetime-dielectric constant calibration curve calculated from measured SBD fluorescence lifetime in methanol and 1,4-dioxane solvent mixtures with known dielectric constant. The dielectric constant values of methanol-1,4-dioxane mixtures were calculated by the weighted average of the mixture components by assuming a simple additive effect. e, Fluorescence lifetime decay curves of SBD in samples described in (c-d). f, Fluorescence lifetime decay curves of SBD in ethylene glycol-glycerol solvent mixtures demonstrated minimal fluorescence lifetime changes in comparison with SBD in methanol-1,4-dioxane mixtures. Ethylene glycol-glycerol mixtures are commonly used solvent standards bearing similar polarity but contrasting viscosities. Therefore, SBD fluorescence lifetime is insensitive to viscosity changes. g, Excitation and emission spectra of SBD-NHS in pure methanol. h, Excitation and emission spectra of SBD-NHS in 1,4-dioxane. The dielectric constant values of methanol-1,4-dioxane mixtures and the viscosity values of ethylene glycol-glycerol mixtures were available in Table S3 and S4, respectively.
Extended Data Fig. 5. Hydrophobicity of the ELP condensates microenvironment is inversely correlated with the micropolarity.

a, Chemical structure of solvatochromic fluorophore, Nile Red. b, Lambda scan imaging to quantify the hydrophobicity of the Nile Red-stained ELP condensates. The false colour of the images is the weighted average from 14 individual images within a wavelength range from 570 nm to 694 nm, with each image measuring the emission intensity of an 8.9 nm interval. c, Fluorescence emission spectra of Nile Red calculated from the lambda scan images. d, Summary of the Nile Red emission maximum wavelength from c as a reflection of the hydrophobicity in ELP condensates. e, Chemical structure of bis-ANS. f. Fluorescence emission spectra of bis-ANS in phase-separated ELP condensates. g. Summary of the bis-ANS peak emission wavelength and fluorescence intensity at peak wavelength in f. 70 μM ELP were mixed in phase separation buffer (50 mM HEPES, pH 7.0, 2 M NaCl) to allow LLPS with the presence of 5 µM Nile Red or bis-ANS.
Extended Data Fig. 6. Chemical structure and photophysical property of BODIPY.

a, The structure of BODIPY-NHS probe and labelled BODIPY structure on the N-terminus or lysine residuals of ELP. b, Chemical structure of BODIPY-Halo. The chromophore core part of BODIPY-Halo resembles the chemical structure of labelled BODIPY, whereas the HaloTag reactive warhead does not affect the photophysical property of BODIPY. BODIPY-Halo was used for photophysical property measurements. c, Fast FLIM images of BODIPY-Halo in glycerol at different temperatures. The viscosity of glycerol is known to change dramatically in response to temperature changes, hence was used for the calibration of the BODIPY viscosity response. Scale bars, 10 µm. d, BODIPY lifetime-viscosity calibration curve calculated from measured BODIPY fluorescence lifetime in glycerol at different temperatures. e, Fluorescence lifetime decay curve of BODIPY-Halo in samples described in (c-d). f, Fluorescence lifetime decay curve of BODIPY-Halo in non-viscous solvents with different polarity. BODIPY displayed minimal fluorescence lifetime changes in response to different polarities. g, Excitation and emission spectra of BODIPY-NHS in pure methanol. h, Excitation and emission spectra of BODIPY-NHS in pure glycerol. The viscosity values of glycerol at different temperatures were available in Table S4.
Extended Data Fig. 7. The impact of microviscosity on the organization and partition of the multi-component ELP protein condensates.

a, Pseudo-colour fast FLIM images and histogram plots of dual BODIPY labelled binary ELP condensates. Scale bars, 10 µm. b, Relationship between the partition coefficient of binary ELP condensates and the viscosity differences between individually formed component ELP condensates. Data were fitted to an exponential mathematical model.
Extended Data Fig. 8. Ratiometric imaging using Di-4-ANEPPS revealed minimal electric potential across the core-shell interfaces in multilayer condensates.

a, Fluorescence intensity images of Di-4-ANEPPS stained multilayer condensates in the channel of 535–545 nm, 610–640 nm and bright field images generated from KV6-112/V-120, V5A5-120/V120 and V5A2G3-120/V120 condensates, respectively. b, Selected areas for fluorescence intensity ratio calculation from the images in (a). c, Di-4-ANEPPS intensity integration ratio of shells and cores in a. Experimental condition: 70 µM of each ELP were mixed in phase separation buffer (50 mM HEPES, pH 7.0, 2 M NaCl) in the presence of 1 µM Di-4-ANEPPS. Scale bar, 10 µm.
Extended Data Fig. 9. Interfacial tensions of ELP condensates are reversely correlated with their micropolarity.

a, Schematic and example of the contact angle measurements of ELP condensates on glass surfaces. Scale bar, 5 µm. b, Measured contact angles of ELP condensates. 70 µM ELP labelled with AF 647 were mixed in phase separation buffer (50 mM HEPES, pH 7.0, 2 M NaCl) to allow contact angle measurements. Data points and labels represent mean and SD for n = 10 for V2I7E-40; n = 6 for V-120; n = 8 for QV6-112, n = 7 for KV6-112, n = 6 for V5A5-120 and n = 7 for V5A2G3-120.
Extended Data Fig. 10. Photophysical property of S-SBD-Halo.

a, Fast FLIM images of S-SBD-Halo in solvent mixtures of methanol and 1,4-dioxane. b, SBD lifetime-dielectric constant calibration curve calculated from measured SBD fluorescence lifetime in methanol and 1,4-dioxane solvent mixtures with known dielectric constant. The dielectric constant values of methanol-1,4-dioxane mixtures were calculated by the weighted average of the mixture components by assuming a simple additive effect. The dielectric constant values of methanol-1,4-dioxane mixtures was available in Table S3.
Supplementary Material
Acknowledgements:
The authors thank Instrumentation and Service Center for Molecular Sciences at Westlake University for the assistance on fluorescence lifetime imaging microscopy (FLIM). We thank Paul S. Cremer for providing part of the ELP plasmids used in this work. X.Z. thanks support from the PEW Biomedical Scholars Program (00033066), and the Research Center for Industries of the Future (RCIF) at Westlake University. Y.L. thanks support from the National Natural Science Foundation of China (22222410). B.Z. and A.L. were supported by the National Institutes of Health (Grant R35GM133580). A.L. acknowledges support from the National Science Foundation Graduate Research Fellowship Program (Grant number 1745302).
Footnotes
Competing Interest Statement:
The authors declare that they have no competing interest.
Additional Information:
Supplementary Information is available for this paper. Correspondence and requests for materials should be addressed to X.Z. (zhangxin@westlake.edu.cn).
Data Availability:
All data are available in the main text, supplementary materials, and source data.
Code Availability:
The computer code used in this study is available at https://github.com/ZhangGroup-MITChemistry.
References:
- 1.Brangwynne CP et al. Germline P granules are liquid droplets that localize by controlled dissolution/condensation. Science 324, 1729–1732 (2009). [DOI] [PubMed] [Google Scholar]
- 2.Hyman AA, Weber CA & Jülicher F. Liquid-liquid phase separation in biology. Annu. Rev. Cell Dev. Biol. 30, 39–58 (2014). [DOI] [PubMed] [Google Scholar]
- 3.Gomes E & Shorter J. The molecular language of membraneless organelles. J. Biol. Chem. 294, 7115–7127 (2019). [DOI] [PMC free article] [PubMed] [Google Scholar]
- 4.Banani SF, Lee HO, Hyman AA & Rosen MK. Biomolecular condensates: organizers of cellular biochemistry. Nat. Rev. Mol. Cell Biol. 18, 285–298 (2017). [DOI] [PMC free article] [PubMed] [Google Scholar]
- 5.Shin Y & Brangwynne CP. Liquid phase condensation in cell physiology and disease. Science 357, eaaf4382 (2017). [DOI] [PubMed] [Google Scholar]
- 6.Dogra P, Joshi A, Majumdar A & Mukhopadhyay S. Intermolecular charge-transfer modulates liquid–liquid phase separation and liquid-to-solid maturation of an intrinsically disordered pH-responsive domain. J. Am. Chem. Soc. 141, 20380–20389 (2019). [DOI] [PubMed] [Google Scholar]
- 7.Abyzov A, Blackledge M & Zweckstetter M. Conformational dynamics of intrinsically disordered proteins regulate biomolecular condensate chemistry. Chem. Rev. 122, 6719–6748 (2022). [DOI] [PMC free article] [PubMed] [Google Scholar]
- 8.Boeynaems S et al. Spontaneous driving forces give rise to protein−RNA condensates with coexisting phases and complex material properties. Proc. Natl. Acad. Sci. U.S.A. 116, 7889–7898 (2019). [DOI] [PMC free article] [PubMed] [Google Scholar]
- 9.Ahlers J et al. The key role of solvent in condensation: Mapping water in liquid-liquid phase-separated FUS. Biophys. J. 120, 1266–1275 (2021). [DOI] [PMC free article] [PubMed] [Google Scholar]
- 10.Latham AP & Zhang B. Molecular determinants for the layering and coarsening of biological condensates. Aggregate, e306 (2022). [DOI] [PMC free article] [PubMed] [Google Scholar]
- 11.Jawerth L et al. Protein condensates as aging Maxwell fluids. Science 370, 1317–1323 (2020). [DOI] [PubMed] [Google Scholar]
- 12.Alshareedah I, Moosa MM, Pham M, Potoyan DA & Banerjee PR. Programmable viscoelasticity in protein-RNA condensates with disordered sticker-spacer polypeptides. Nat. Commun. 12, 6620 (2021). [DOI] [PMC free article] [PubMed] [Google Scholar]
- 13.Klein IA et al. Partitioning of cancer therapeutics in nuclear condensates. Science 368, 1386–1392 (2020). [DOI] [PMC free article] [PubMed] [Google Scholar]
- 14.Folkmann AW, Putnam A, Lee CF & Seydoux G. Regulation of biomolecular condensates by interfacial protein clusters. Science 373, 1218–1224 (2021). [DOI] [PMC free article] [PubMed] [Google Scholar]
- 15.Dai Y et al. Interface of biomolecular condensates modulates redox reactions. Chem 9, 1594–1609 (2023). [DOI] [PMC free article] [PubMed] [Google Scholar]
- 16.Jain S et al. ATPase-modulated stress granules contain a diverse proteome and substructure. Cell 164, 487–498 (2016). [DOI] [PMC free article] [PubMed] [Google Scholar]
- 17.Protter DS & Parker R. Principles and properties of stress granules. Trends Cell Biol. 26, 668–679 (2016). [DOI] [PMC free article] [PubMed] [Google Scholar]
- 18.Boisvert F-M, van Koningsbruggen S, Navascués J & Lamond AI. The multifunctional nucleolus. Nat. Rev. Mol. Cell Biol. 8, 574–585 (2007). [DOI] [PubMed] [Google Scholar]
- 19.Feric M et al. Coexisting liquid phases underlie nucleolar subcompartments. Cell 165, 1686–1697 (2016). [DOI] [PMC free article] [PubMed] [Google Scholar]
- 20.Lafontaine DL, Riback JA, Bascetin R & Brangwynne CP. The nucleolus as a multiphase liquid condensate. Nat. Rev. Mol. Cell Biol. 22, 165–182 (2021). [DOI] [PubMed] [Google Scholar]
- 21.Yu H et al. HSP70 chaperones RNA-free TDP-43 into anisotropic intranuclear liquid spherical shells. Science 371, eabb4309 (2021). [DOI] [PMC free article] [PubMed] [Google Scholar]
- 22.Gouveia B et al. Capillary forces generated by biomolecular condensates. Nature 609, 255–264 (2022). [DOI] [PubMed] [Google Scholar]
- 23.MacEwan SR & Chilkoti A. Elastin-like polypeptides: biomedical applications of tunable biopolymers. Peptide Sci. 94, 60–77 (2010). [DOI] [PubMed] [Google Scholar]
- 24.Simon JR, Carroll NJ, Rubinstein M, Chilkoti A & López GP. Programming molecular self-assembly of intrinsically disordered proteins containing sequences of low complexity. Nat. Chem. 9, 509–515 (2017). [DOI] [PMC free article] [PubMed] [Google Scholar]
- 25.Cho Y et al. Effects of Hofmeister Anions on the Phase Transition Temperature of Elastin-like Polypeptides. J. Phys. Chem. B 112, 13765–13771 (2008). [DOI] [PMC free article] [PubMed] [Google Scholar]
- 26.Li NK, Quiroz FG, Hall CK, Chilkoti A & Yingling YG. Molecular description of the LCST behavior of an elastin-like polypeptide. Biomacromolecules 15, 3522–3530 (2014). [DOI] [PubMed] [Google Scholar]
- 27.Urry DW. Physical chemistry of biological free energy transduction as demonstrated by elastic protein-based polymers. J. Phys. Chem. B 101, 11007–11028 (1997). [Google Scholar]
- 28.Jung KH, Kim SF, Liu Y & Zhang X. A fluorogenic AggTag method based on Halo-and SNAP-tags to simultaneously detect aggregation of two proteins in live cells. ChemBioChem 20, 1078–1087 (2019). [DOI] [PubMed] [Google Scholar]
- 29.Liu Y et al. The cation-π interaction enables a Halo-Tag fluorogenic probe for fast no-wash live cell imaging and gel-free protein quantification. Biochem. 56, 1585–1595 (2017). [DOI] [PMC free article] [PubMed] [Google Scholar]
- 30.Shen B et al. A dual-functional BODIPY-based molecular rotor probe reveals different viscosity of protein aggregates in live cells. Aggregate, e301 (2022). [Google Scholar]
- 31.Fišerová E & Kubala M. Mean fluorescence lifetime and its error. J. Lumin. 132, 2059–2064 (2012). [Google Scholar]
- 32.Lin Y et al. Liquid-liquid phase separation of tau driven by hydrophobic interaction facilitates fibrillization of tau. J. Mol. Biol. 433, 166731 (2021). [DOI] [PMC free article] [PubMed] [Google Scholar]
- 33.Lin Y et al. Narrow equilibrium window for complex coacervation of tau and RNA under cellular conditions. Elife 8, e42571 (2019). [DOI] [PMC free article] [PubMed] [Google Scholar]
- 34.Reynolds RC, Montgomery POB & Hughes B. Nucleolar “caps” produced by actinomycin D. Cancer Res. 24, 1269–1277 (1964). [PubMed] [Google Scholar]
- 35.Shav-Tal Y et al. Dynamic sorting of nuclear components into distinct nucleolar caps during transcriptional inhibition. Mol. Biol. Cell 16, 2395–2413 (2005). [DOI] [PMC free article] [PubMed] [Google Scholar]
- 36.Gautier T, Bergès T, Tollervey D & Hurt E. Nucleolar KKE/D repeat proteins Nop56p and Nop58p interact with Nop1p and are required for ribosome biogenesis. Mol. Cell Biol. 17, 7088–7098 (1997). [DOI] [PMC free article] [PubMed] [Google Scholar]
Methods-only References:
- 37.McDaniel JR, MacKay JA, Quiroz FG & Chilkoti A. Recursive directional ligation by plasmid reconstruction allows rapid and seamless cloning of oligomeric genes. Biomacromolecules 11, 944–952 (2010). [DOI] [PMC free article] [PubMed] [Google Scholar]
- 38.Klock HE, Koesema EJ, Knuth MW & Lesley SA. Combining the polymerase incomplete primer extension method for cloning and mutagenesis with microscreening to accelerate structural genomics efforts. Proteins 71, 982–994 (2008). [DOI] [PubMed] [Google Scholar]
- 39.Hassouneh W, Christensen T & Chilkoti A. Elastin-like polypeptides as a purification tag for recombinant proteins. Curr. Protoc. Protein Sci. 61, 06.11.01–06.11.06 (2010). [DOI] [PMC free article] [PubMed] [Google Scholar]
- 40.Peterson DW, Zhou H, Dahlquist FW & Lew J. A soluble oligomer of tau associated with fiber formation analyzed by NMR. Biochem. 47, 7393–7404 (2008). [DOI] [PubMed] [Google Scholar]
- 41.Pavlova A et al. Site-specific dynamic nuclear polarization of hydration water as a generally applicable approach to monitor protein aggregation. Phys. Chem. Chem. Phys. 11, 6833–6839 (2009). [DOI] [PMC free article] [PubMed] [Google Scholar]
- 42.Schindelin J et al. Fiji: an open-source platform for biological-image analysis. Nat. Methods 9, 676–682 (2012). [DOI] [PMC free article] [PubMed] [Google Scholar]
- 43.Latham AP & Zhang B. Maximum entropy optimized force field for intrinsically disordered proteins. J. Chem. Theory Comput. 16, 773–781 (2019). [DOI] [PMC free article] [PubMed] [Google Scholar]
- 44.Latham AP & Zhang B. Consistent force field captures homologue-resolved hp1 phase separation. J. Chem. Theory Comput. 17, 3134–3144 (2021). [DOI] [PMC free article] [PubMed] [Google Scholar]
- 45.Latham AP & Zhang B. Unifying coarse-grained force fields for folded and disordered proteins. Curr. Opin. Struct. Biol. 72, 63–70 (2022). [DOI] [PMC free article] [PubMed] [Google Scholar]
- 46.Souza PC et al. Martini 3: a general purpose force field for coarse-grained molecular dynamics. Nat. Methods 18, 382–388 (2021). [DOI] [PMC free article] [PubMed] [Google Scholar]
- 47.Huang J et al. CHARMM36m: an improved force field for folded and intrinsically disordered proteins. Nat. Methods 14, 71–73 (2017). [DOI] [PMC free article] [PubMed] [Google Scholar]
- 48.Rauscher S & Pomès R. The liquid structure of elastin. Elife 6, e26526 (2017). [DOI] [PMC free article] [PubMed] [Google Scholar]
- 49.Reichheld SE, Muiznieks LD, Keeley FW & Sharpe S. Direct observation of structure and dynamics during phase separation of an elastomeric protein. Proc. Natl. Acad. Sci. U.S.A. 114, E4408–E4415 (2017). [DOI] [PMC free article] [PubMed] [Google Scholar]
- 50.Case DA et al. Amber 2021. (University of California, San Francisco, 2021). [Google Scholar]
- 51.Dignon GL, Zheng W, Kim YC, Best RB & Mittal J. Sequence determinants of protein phase behavior from a coarse-grained model. PLoS Comput. Biol. 14, e1005941 (2018). [DOI] [PMC free article] [PubMed] [Google Scholar]
- 52.Zhang Y, Feller SE, Brooks BR & Pastor RW. Computer simulation of liquid/liquid interfaces. I. Theory and application to octane/water. J. Chem. Phys. 103, 10252–10266 (1995). [Google Scholar]
- 53.Wassenaar TA, Pluhackova K, Böckmann RA, Marrink SJ & Tieleman DP. Going backward: a flexible geometric approach to reverse transformation from coarse grained to atomistic models. J. Chem. Theory Comput. 10, 676–690 (2014). [DOI] [PubMed] [Google Scholar]
- 54.Tribello GA, Giberti F, Sosso GC, Salvalaglio M & Parrinello M. Analyzing and driving cluster formation in atomistic simulations. J. Chem. Theory Comput. 13, 1317–1327 (2017). [DOI] [PubMed] [Google Scholar]
- 55.Gowers RJ et al. in Proceedings of the 15th python in science conference. 98–105 (SciPy; Austin, TX). [Google Scholar]
Associated Data
This section collects any data citations, data availability statements, or supplementary materials included in this article.
Supplementary Materials
Data Availability Statement
All data are available in the main text, supplementary materials, and source data.
The computer code used in this study is available at https://github.com/ZhangGroup-MITChemistry.