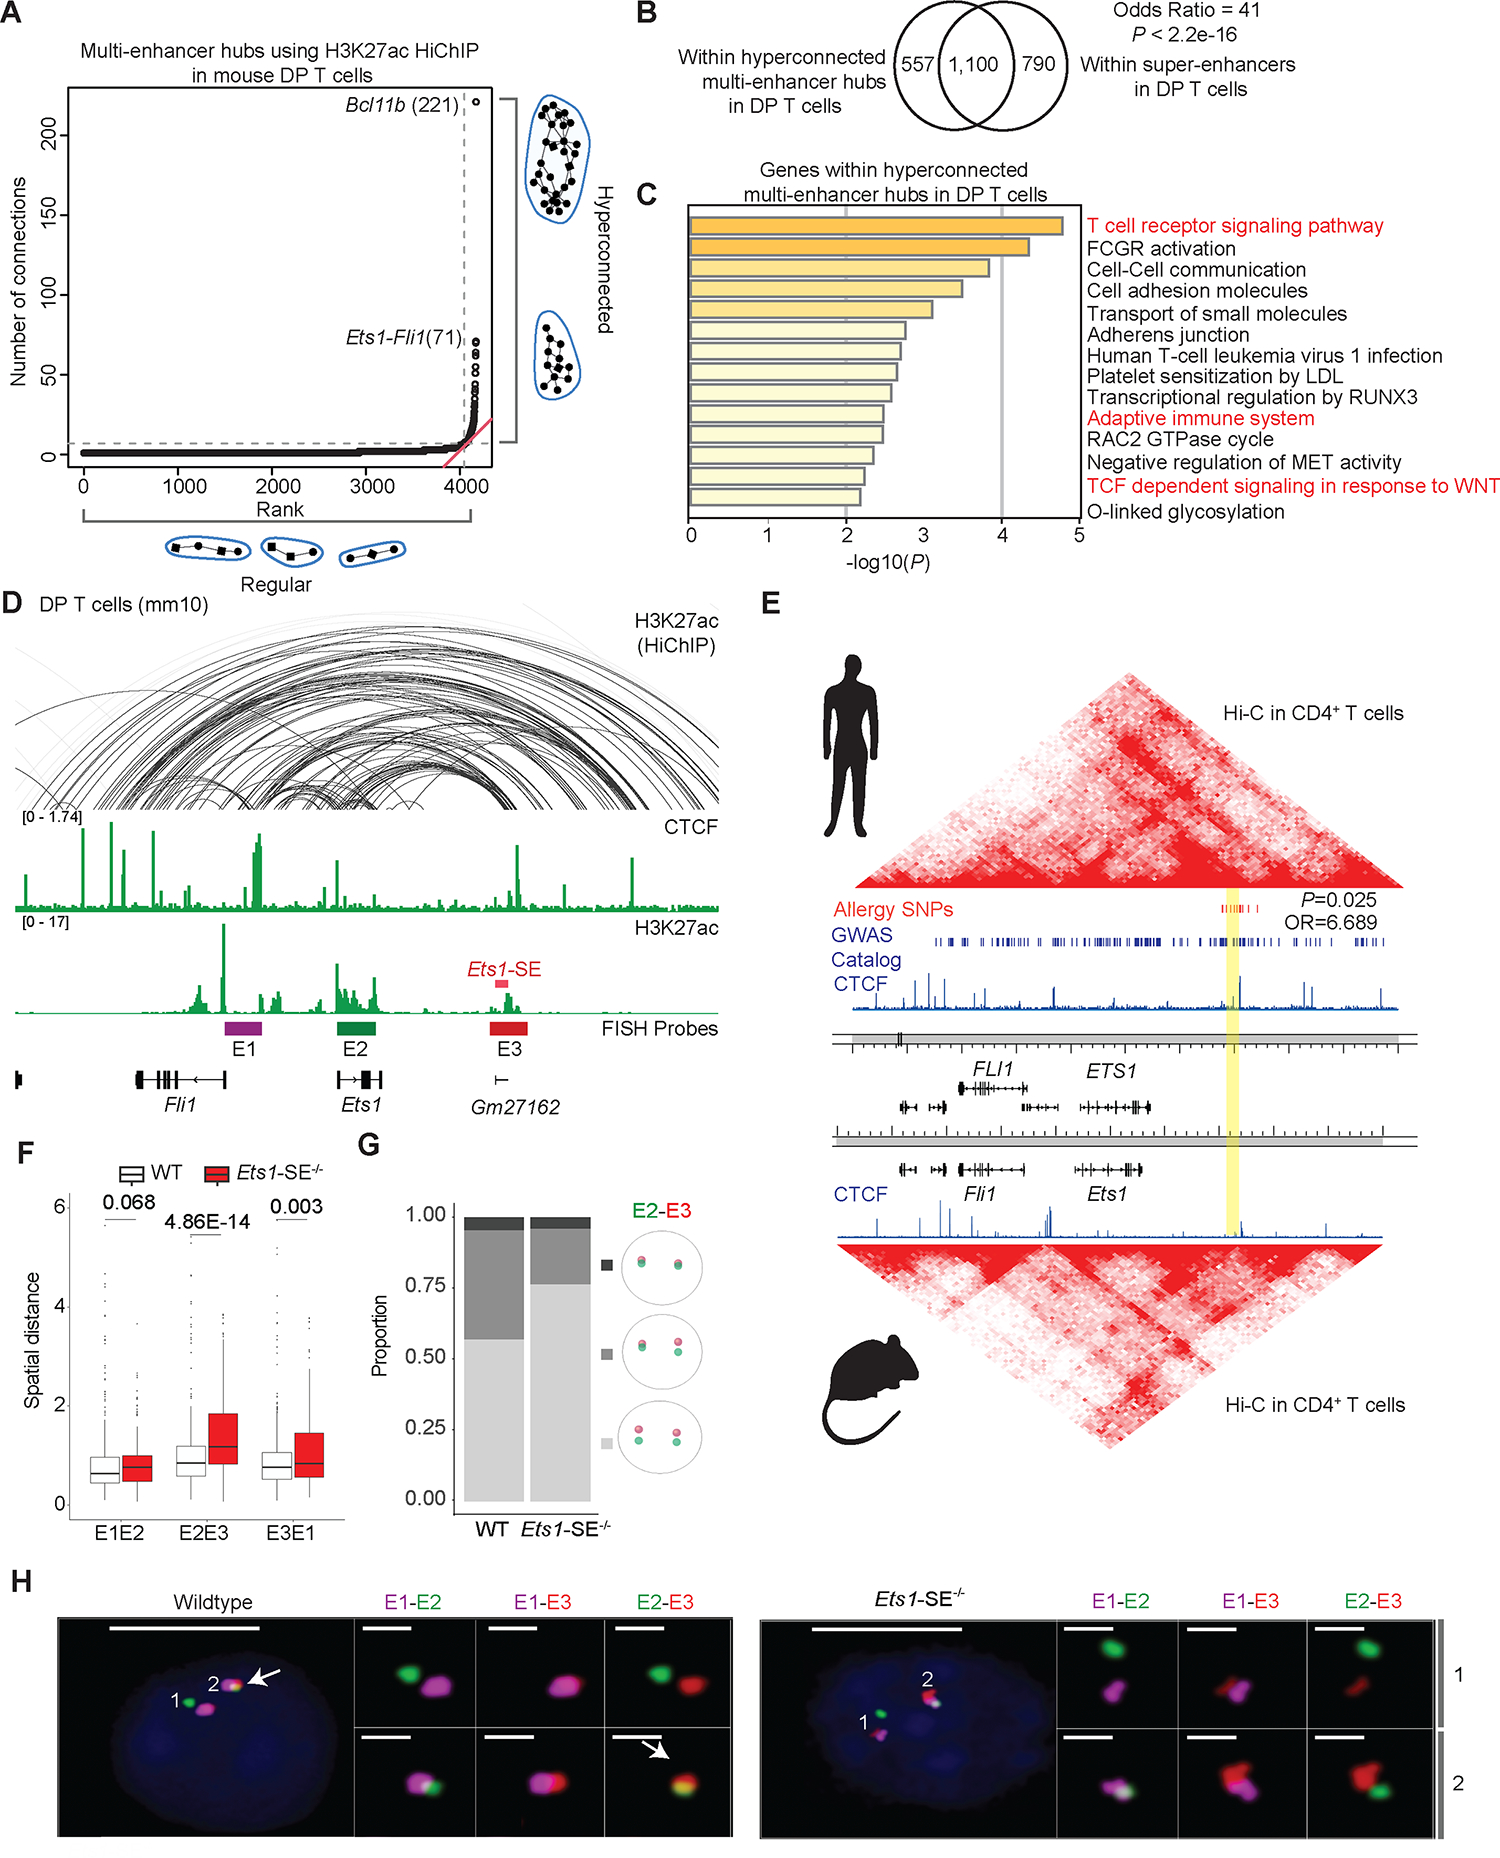
Figure 1: Exceptional enhancer connectivity at the Ets1-Fli1 locus.

A, Plot depicts ranking versus number of connections in multi-enhancer hubs also referred to as 3D cliques9,10 detected in double-positive (DP) T cells using H3K27ac HiChIP measurements generated in our previous study10. Hyperconnected multi-enhancer hubs are defined as the ones above the elbow of the total connectivity ranking. Top two hyperconnected multi-enhancer hubs Bcl11b and Ets1-Fli1 are labeled. Number of interactions in each hub is provided in parenthesis.
B, Venn-diagram depicts the overlaps of genomic regions within hyperconnected multi-enhancer hubs detected using H3K27ac HiChIP when compared to super-enhancers defined by H3K27ac ChIP-seq in DP T cells. Super-enhancers were defined based on H3K27ac ChIP-seq in DP T cells as described before36. Odds ratio and Fisher’s exact test were used for statistical analysis.
C, Bar-plot demonstrates the significance of gene-ontology terms enriched in genes encompassing multi-enhancer hubs. Metascape56 was used for gene-ontology analysis. Terms relating to immune response pathways are marked in red.
D, The genome browser view demonstrates H3K27ac and CTCF ChIP-seq, as well as H3K27ac HiChIP 3D interactions at the Ets1-Fli1 locus in DP T cells, and the exact genomic location of E1-E3 probes used for “Oligopaint” DNA-FISH. The 25kbp super-enhancer which is the focus of this study is called Ets1-SE and is marked in red. FISH probes depicted in the browser view include E1 (enhancer upstream of Ets1 and proximal to Fli1 promoter, magenta), E2 (Ets1 promoter and gene-body, green) and E3 (Ets1-SE and a 25kbp enhancer downstream of Ets1-SE, red), representing the three independent 50kbp genomic regions for which Oligopaint probes were designed.
E, Heatmaps demonstrate contact-frequency maps measured by Hi-C in CD4+ T cells in humans and mice. ChIP-seq tracks demonstrate CTCF binding in human CD4+ T cells and mouse DP T cells. SNPs associated with asthma and allergic diseases highlighted in red were curated from the GWAS catalog and meta-analysis studies for allergy, asthma, and atopic dermatitis29,30. Blue bars demonstrate statistically significant GWAS SNPs associated with diverse traits. The orthologous human coordinate of Gm27162 is highlighted in yellow (chr11:128,303,536–128,330,986). P-value and odds ratio were estimated by Fisher’s exact test.
F, Box plots depict the pairwise spatial distance formed between E1, E2 and E3 probes (Mann-Whitney U test). Oligopaint 3D FISH40,57 in 428 and 460 thymocytes were imaged using widefield microscopy from one wildtype and one Ets1-SE−/− mouse, respectively. Spots for each probe in Oligopaint 3D FISH data were analyzed in a semi-manual manner (Methods).
G, Divided bar-plots demonstrating the proportion of mono vs. biallelic spatial contacts for E2 and E3 probes, in wildtype and Ets1-SE−/− cells. Only cells in which both alleles of both probes were detected, were used (112 wildtype cells and 53 Ets1-SE−/− cells). The distance cutoff used for E2 and E3 spatial contact was 0.7 μm. Pale gray represents no allele showing spatial contact, gray represents mono-allelic and dark gray represents bi-allelic contacts.
H, Representative images of the Oligopaint FISH probes hybridization in one wildtype and one Ets1-SE−/− thymocytes, with magnification of pairwise contacts for each allele. DAPI: blue, E1: magenta, E2: green, E3: red. Scale-bar in whole cell: 5μm and scale-bar in magnification of allele: 1μm. White arrow represents the spatial overlap between E2 and E3.
