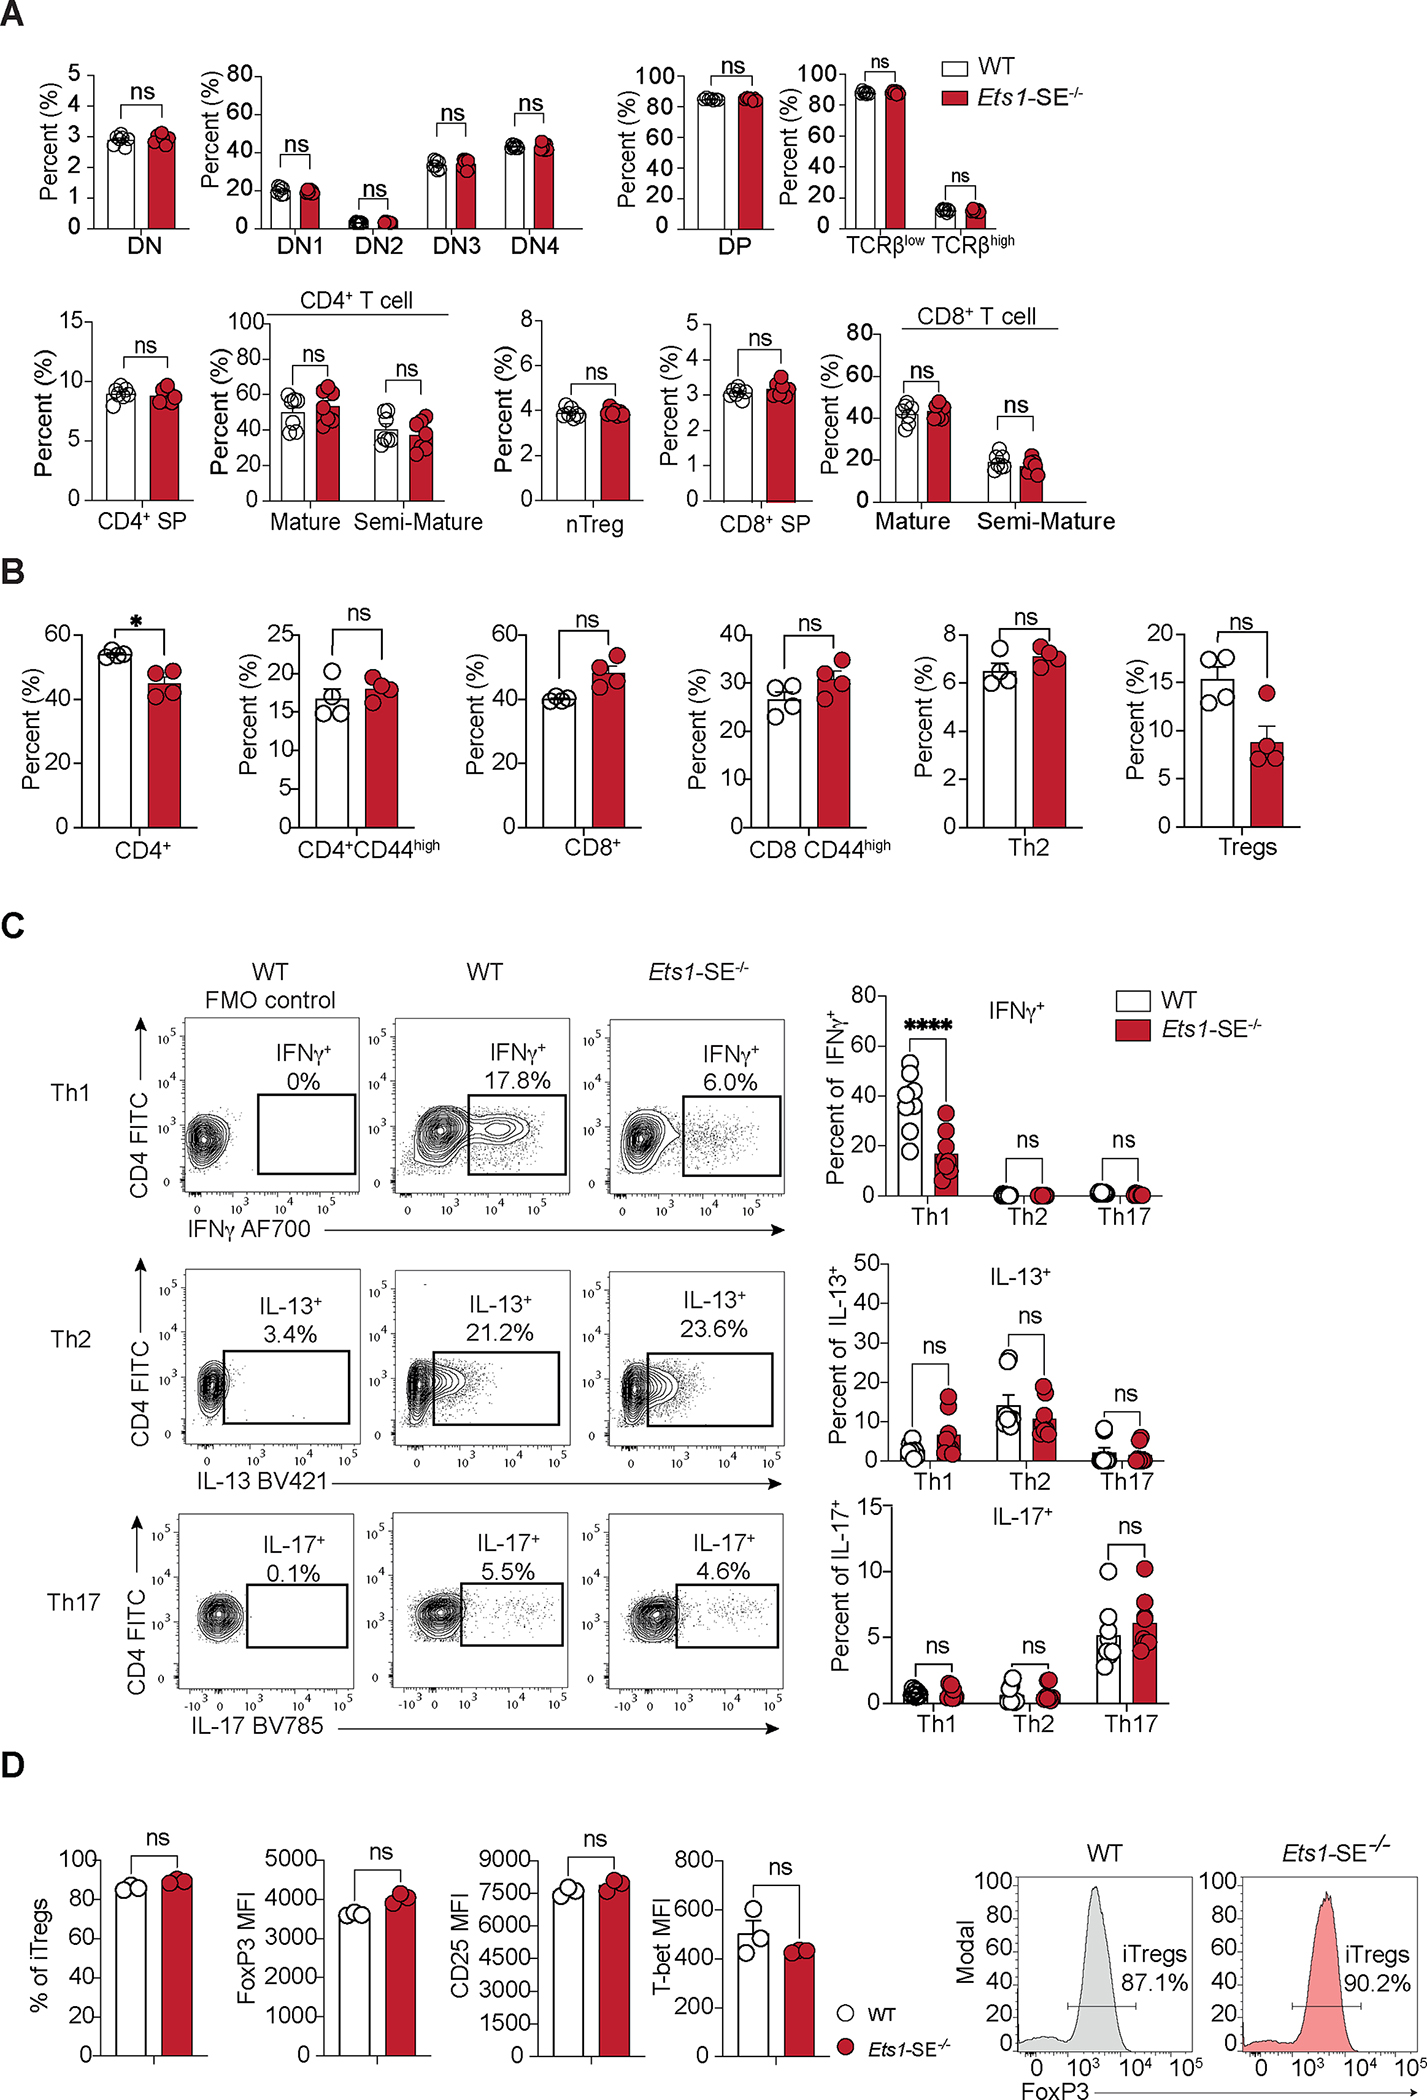
Figure 2: Ets1-SE is dispensable for thymic T cell generation but is required for CD4+ Th1 differentiation.

A, Plots demonstrate percentage of cells defined by flow cytometry analysis in the thymus from age matched wildtype and Ets1-SE−/− female mice. Data are representative of three independent experiments. Each dot represents an individual mouse (wildtype; n=7 - Ets1-SE−/−; n=7). Error bars = SEM; and P: ns = not significant, (DN, DP, nTregs, CD4+/CD8+ SP: Mann-Whitney U test; DN1-DN4, TCRβlow/high, Semi-Mature/Mature CD4+/CD8+: Two-way ANOVA with multiple comparisons and Bonferroni correction).
B, Plots demonstrate percentages of cells defined by flow cytometry analysis in the lung Frequencies at steady state of lungs parenchyma CD4+ T cells (TCRβ+, CD4+), activated CD4+ T cells (TCRβ+, CD4+, CD44+), CD8+ T cells (TCRβ+, CD8+), activated CD8+ T cells (TCRβ+, CD8+, CD44+), CD4+ Th2 cells (TCRβ+, CD4+, GATA-3+) from age-matched wildtype and Ets1-SE−/− male mice. Data are representative of two independent experiments. Each dot represents an individual mouse (wildtype; n=4 - Ets1-SE−/−; n=4). Error bars = SEM; and P: ns = not significant, * =P≤0.05 (Mann-Whitney U test).
C, (left) Representative flow cytometry contour plot of naive CD4+ T cells from wildtype or Ets1-SE−/− mice cultured under Th1, Th2 or Th17 polarizing conditions for 6 days. Unstained wildtype cells are shown for each polarizing condition as a negative control (wildtype FMO Control). (right) Frequencies of Th1 (IFNγ+), Th2 (IL-13+) or Th17 (IL-17+) cytokines producing CD4+ T cells cultured under Th1, Th2 or Th17 polarizing conditions for 6 days. All populations were pre-gated on SSC-A/FSC-A, Singlets and Viability− (Live), TCRβ+ and CD4+ cells. Two independent experiments were pooled and were repeated five times. Each dot represents an individual mouse (wildtype; n=8 - Ets1-SE−/−; n=8). Error bars = SEM; and P: ns = not significant, * = P ≤0.05, ** = P ≤0.01, *** = P ≤0.0005, **** = P ≤0.0001 (Two-way ANOVA with multiple comparisons and Bonferroni correction).
D, (left) Frequencies of induced Tregs (iTregs, FoxP3+ CD4+ cells) and mean fluorescence intensity (MFI) of FoxP3, CD25 and T-bet from naïve CD4+ T cells cultured under iTreg polarizing conditions for 3 days. (right) Representative histogram of the proportion of FoxP3+ CD4+ T cells 3 days after culturing in iTregs polarizing conditions. Data are representatives of two independent experiments. Each dot represents an individual mouse (wildtype; n=3 - Ets1-SE−/−; n=3). Error bars = SEM; and P: ns = not significant, * = P ≤0.05, ** = P ≤0.01, *** = P ≤0.0005, **** = P ≤0.0001 (Mann and Whitney).
