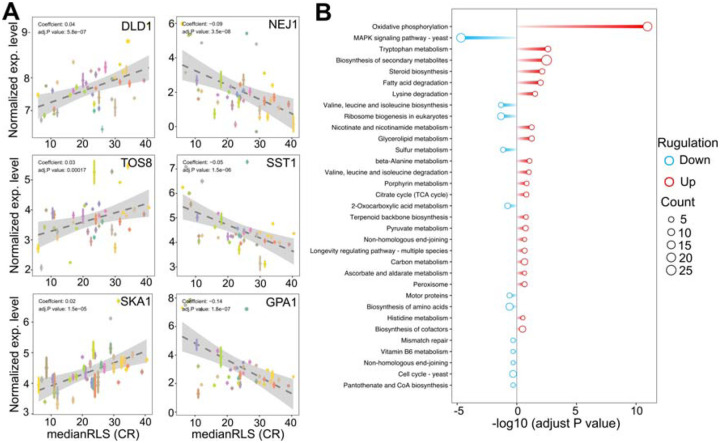
Figure 6: Selected genes whose expression under high glucose condition correlates with median replicative lifespan (RLS) under CR condition.
(A) DLD1, TOS8, and SKA1 gene expression levels, determined under high glucose condition correlate positively, and NEJ1, SST1, and GPA1 correlate negatively with median RLS under CR conditions. The Y-axis denotes the expression level, and the X-axis represents the lifespan. Each color point represents an individual strain. Error bars represent standard error (SE). The gray area represents a 95% confidence interval. The regression coefficient and adjusted P values are included in the figure. The complete list of significantly correlating genes, regression slopes, and p values can be found in. Supplementary File 2. (B) Bar plot depicting gene enrichment analysis of lifespan-correlated genes. The Y-axis shows each significantly enriched pathway of the KEGG database while the X-axis denotes −log10 (adjusted P value). Red bars represent pathways expressed at higher levels in higher lifespan strains, while blue bars represent pathways with higher expression levels in lower lifespan strains. Point size represents the number of genes in this pathway. The complete list of genes with regression slopes, and p values can be found in Supplementary File 2.

