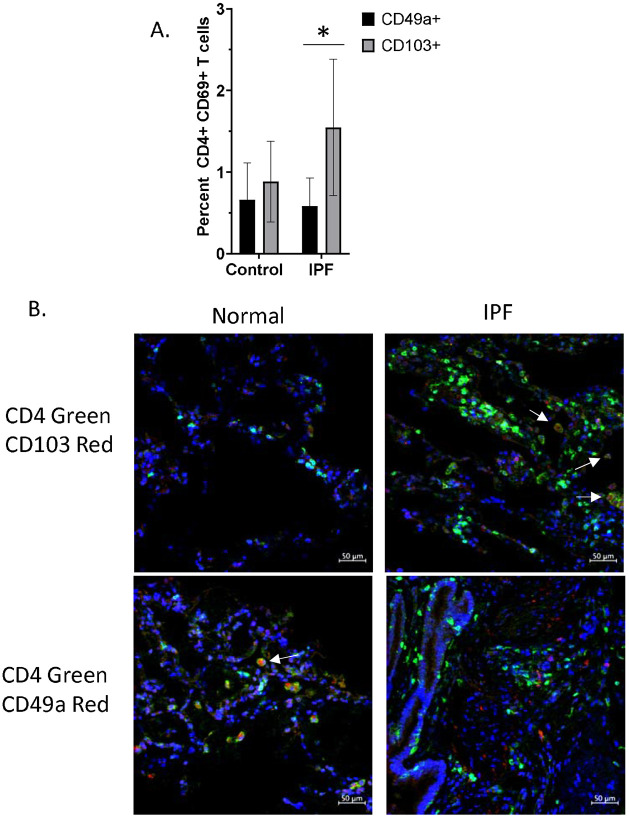
Figure 5. Imbalanced CD49a+/CD103+ CD4+ T cells in human IPF lungs.
A. Percentage of CD49a+ and CD103+ CD4+ T cells in control and IPF lungs as determined by analysis of single cell RNA-seq dataset from Adams et al (2020). Error bars represent standard deviation, * = p value of 0.0001. B. Immunohistochemistry was performed on biopsies of normal and IPF human lungs in order to determine densities of CD49a+ and CD103+ CD4+ T cells. Images were taken at 40X.

