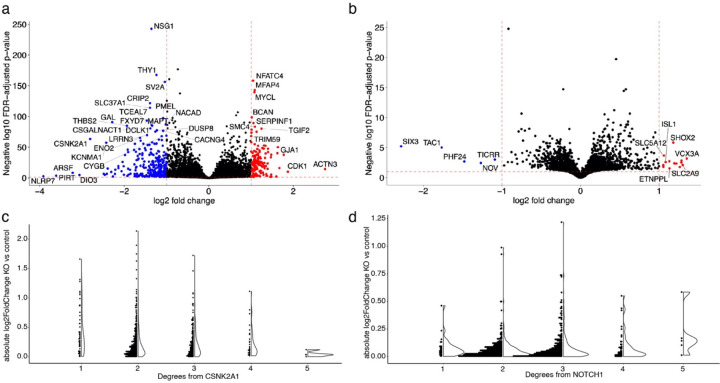
Extended Data Fig. 7.
related to Fig. 6: RNA-seq analysis after knockdown of NOTCH1 and CSNK2A1. Volcano plot depicts differential expression analysis by DeSeq2 of bulk RNA-seq after a) CSNK2A1 CRISPRi knockdown and b) NOTCH1 CRISPRi knockdown in NGN2 iPSC-derived neural progenitor cells. Each dot represents a single gene. The horizontal dashed line indicates the negative log10 Benjamini-Hochberg FDR-adjusted p-value cut-off of 0.1 and the vertical dashed lines indicate the log2 fold change cut-offs of 1 and −1. Red dots indicate significantly upregulated genes (log2 fold change greater than 1) and blue dots indicate significantly downregulated genes (log2 fold change less than −1). c) Dot and volcano plots show the absolute value of the log2 fold change of nodes in the network after CSNK2A1 knockout compared to controls relative to the degree of separation from CSNK2A1. d) Dot and volcano plots show the absolute value of the log2 fold change of nodes in the network after NOTCH1 knockout compared to controls relative to the degree of separation from NOTCH1.

