Fig. 5:
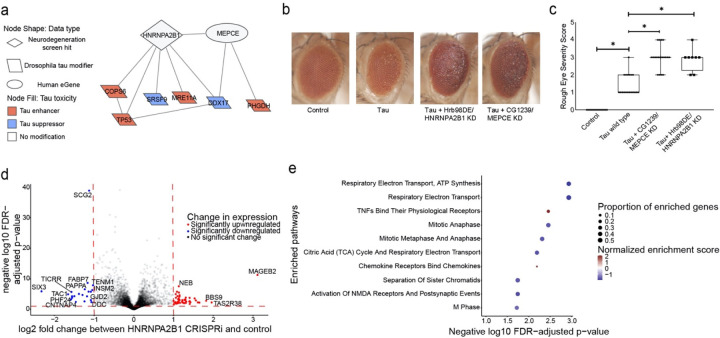
Network integration of Alzheimer’s disease multi-omics and novel genetic screening data reveals biological processes associated with tau-mediated neurotoxicity. a) The neurodegeneration modifier HNRNPA2B1 and the eGene MEPCE interact with each other and have protein-protein interactions with modifiers of tau neurotoxicity. The interaction between HNRNPA2B1 and MEPCE is found in the subnetwork in Figure 4 that is enriched for insulin signaling. b) Knockdown of the Drosophila orthologs of HNRNPA2B1 (Hrb98DE) and MEPCE (CG1293) shows enhancement of the rough eye phenotype in flies expressing wild type human tau. c) Quantification of rough eye severity. The scale reflects the extent of morphological disruption after human tau retinal expression (Methods). Statistical significance was measured using a one-way ANOVA with Tukey’s post-hoc correction and is indicated with an asterisk. Error bars are the standard error of the mean. Two independent RNAi constructs were used to knock down each gene. n=8. Control is GMR-GAL4/+. Flies are one day old. d) Volcano plot depicting differential expression analysis by DeSeq2 of bulk RNA-seq after HNRNPA2B1 CRISPRi knockdown in NGN2 neural progenitor cells (Benjamini-Hochberg FDR<0.1, absolute log2 fold change > 1). Each dot represents a single gene. The horizontal dashed line indicates the negative log10 FDR-adjusted p-value significance cut-off of 0.1 and the vertical dashed lines indicate the log2 fold change cut-offs of 1 and −1. Red dots indicate genes that are significantly upregulated and blue dots indicate genes that are significantly downregulated. e) Dot plot of the enriched pathways identified by gene set enrichment analysis of the RNA-seq data. The 10 pathways with the highest negative log10 FDR-adjusted p-value are plotted. The size of the dot indicates the proportion of genes that are part of the enriched pathway. The color of the dot represents the normalized enrichment score (NES), where blue indicates downregulation and red indicates upregulation. The x-position of the dot indicates the negative log10 FDR-adjusted p-value and the y-position is the corresponding, enriched pathway.

