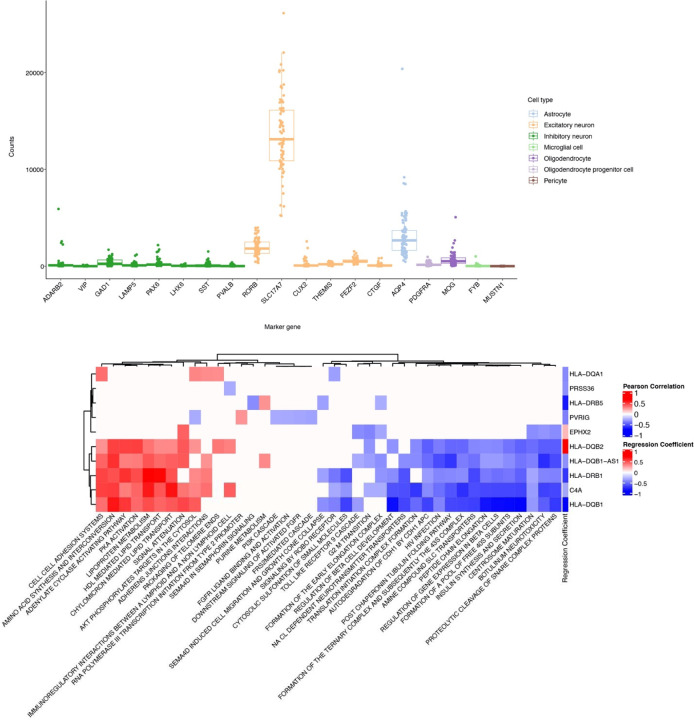
Extended Data Fig. 3.
related to Fig. 3. a) Boxplots depict the normalized counts of cell type marker genes in the brain in the temporal cortex laser capture microdissected neurons. Boxes are colored by the general cell type represented by the marker gene. Each point represents one bulk RNA-seq sample. b) Heatmap showing significant Pearson correlations between the RNA-seq expression of temporal cortex pyramidal neuron eGenes and Gene Set Variation Analysis signatures for REACTOME pathways. The gene names on the rows are annotated for the regression coefficient representing the association between gene expression and the presence of the associated Alzheimer’s disease eQTL. The legend for these regression coefficients is labeled as “Regression Coefficient”. Columns are clustered with hierarchical clustering.

