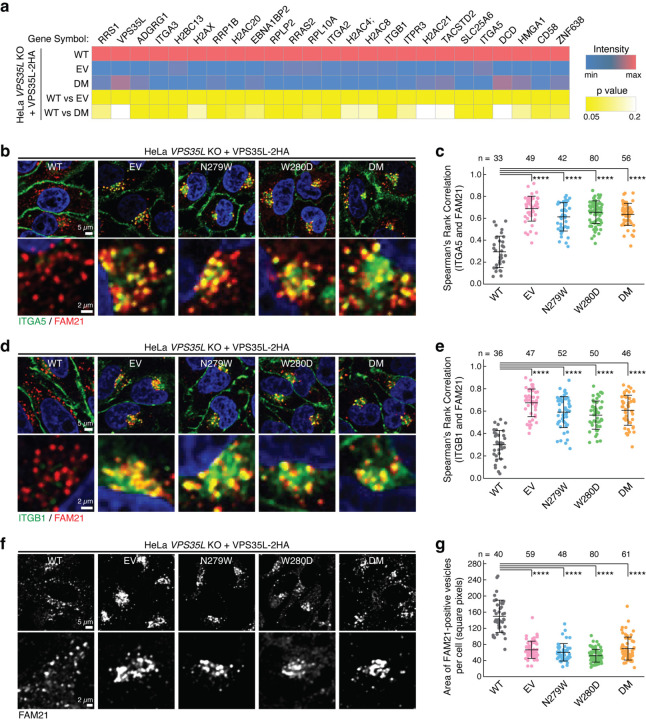
Fig. 4. Disrupting the SNX17-Retriever interaction impairs PM homeostasis.
a. Heat map of PM protein abundance quantified by TMT-based proteomics after surface biotinylation and streptavidin purification, using indicated HeLa stable cell lines (shown in Fig. 3d). Only proteins whose abundance was significantly different between WT and EV lines (p value <0.05) are displayed. b-c. Representative confocal images (b) and quantification of colocalization (c) derived from concurrent immunofluorescence staining for the cargo protein ITGA5 (green) and the endosomal marker FAM21 (red) in the indicated cell lines. d-e. Similar to (b-c) but focusing on the cargo protein ITGB1 (green). f-g. Representative confocal images (f) and quantification of the area of FAM21-positive endosomes (g) derived from immunofluorescence staining of FAM21 in the indicated HeLa stable cell lines. In all quantifications, each dot represents an individual cell, with number of cells in each group indicated above the graph. Mean and standard deviation are shown. One-way ANOVA with Dunnett’s correction was used. ****, p < 0.0001.

