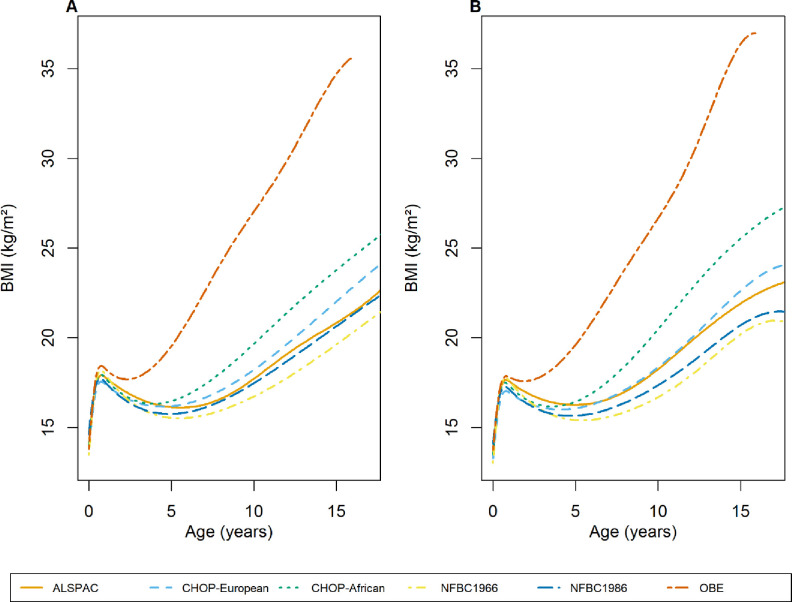
Figure 1: Population average BMI trajectories predicted by our final chosen model (cubic spline function in the fixed effects with cubic slope function in the random effects) for each of the six cohorts for males (A) and females (B).
BMI trajectories were predicted from 2 weeks to 17 years, which corresponds to the age range that the slopes and AUCs were predicted from, in all cohorts except OBE where they were predicted from 2 weeks to 16 years due to the lack of data after age 16. The year(s) of recruitment for each cohort are as follows: ALSPAC: 1991–1993, CHOP: 1988-present, NFBC1966: 1966, NFBC1986: 1985–1986, OBE: 1981–2001

