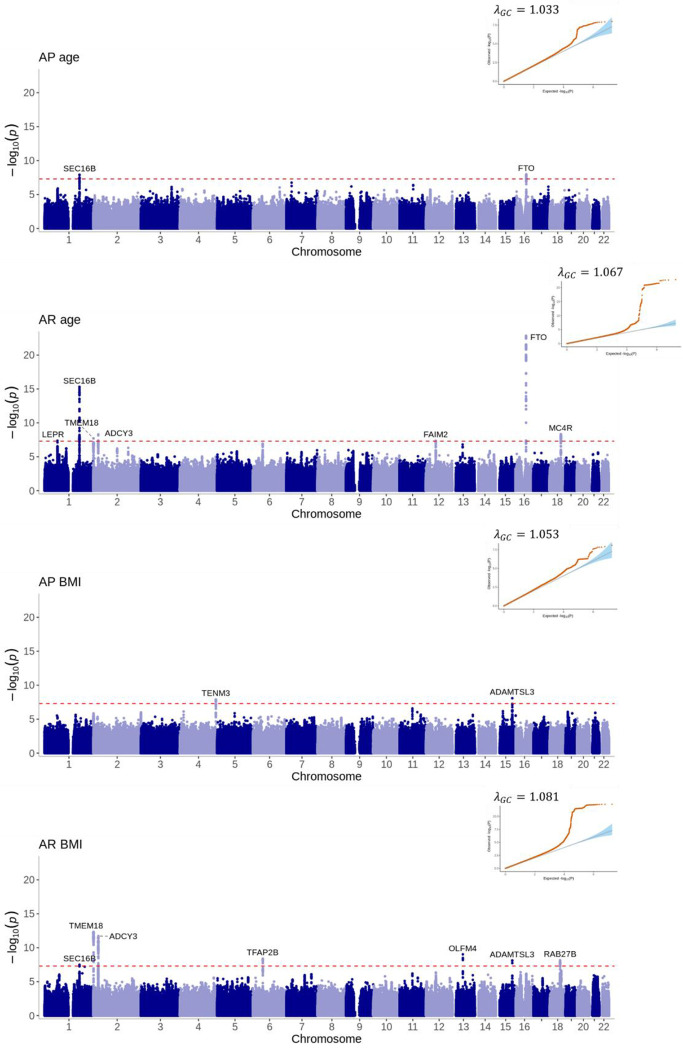
Figure 6: Manhattan plots and quantile-quantile (QQ) plots of the meta-analyses for the age and BMI at adiposity peak and adiposity rebound estimated phenotypes.
Loci are labelled with their nearest gene annotated by LocusZoom. The red dotted line corresponds to the genome-wide significance level of P<5×10⁻⁸.

