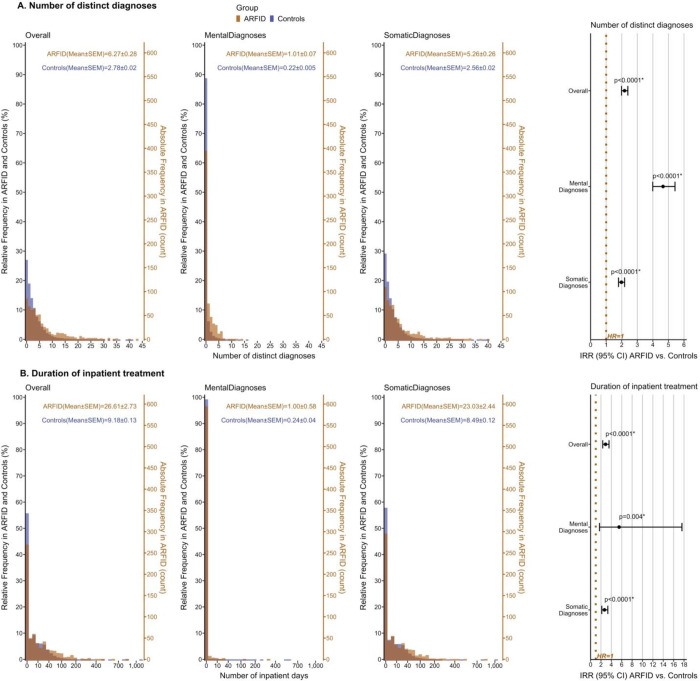
Figure 5. A. Number of all distinct, distinct mental, and distinct somatic ICD-diagnoses in ARFID vs. controls. B. Duration of hospitalization/inpatient treatment due to any, any mental, and any somatic ICD-diagnosis in ARFID vs. controls.
Histograms display absolute frequency (count) and relative frequency (%) of A. the number of distinct diagnoses (i.e., unique ICD-codes) and B. the number of inpatient days per individual twin in ARFID vs. controls (x-axis in B. logarithmically scaled). Mean and standard error of the mean (SEM) are provided as descriptive statistics. Poisson regression models (predictor: group [ARFID vs. controls]; covariates: sex [female/male], birth year [1992–2008, factorized]; robust sandwich estimates given clustered twin data; offset term to account for exposure time) were applied to estimate incidence rate ratios (IRRs) in ARFID vs. controls in A. and B., their cluster-robust 95% confidence intervals (95% CI), and p-values (x-axis logarithmically scaled). Significantly different (i.e., increased) incidence rates in ARFID compared with controls at the false discovery rate-adjusted threshold αFDR=0.0343 are marked by an asterisk (*). Abbreviation: ARFID, avoidant restrictive food intake disorder.

