Abstract
Background.
A recently developed obstetric comorbidity scoring system enables comparisons of severe maternal morbidity rates independent of health status at the time of birth hospitalization. However, the scoring system has not been evaluated in racial-ethnic and socioeconomic groups or used to assess disparities in severe maternal morbidity.
Objective.
To evaluate the performance of applying an obstetric comorbidity scoring system across racial-ethnic and socioeconomic groups and to determine the effect of comorbidity score risk adjustment on disparities in severe maternal morbidity.
Study Design.
We analyzed a population-based cohort of live births in California during 2011–2017 with linked birth certificate and birth hospitalization discharge data (n = 3,308,554). We updated a previously developed comorbidity scoring system to include ICD-9-CM and ICD-10-CM diagnosis codes, and applied the scoring system in subpopulations (groups) defined by race-ethnicity, nativity, payment method, and educational attainment. We then calculated risk-adjusted rates of severe maternal morbidity (including and excluding blood transfusion-only cases) in each group and estimated disparities for these outcomes before and after adjustment for the comorbidity score using logistic regression.
Results.
The obstetric comorbidity scores performed consistently across groups (C-statistics ranged from 0.68–0.76; calibration curves demonstrated overall excellent prediction of absolute risk). All non-White groups had significantly elevated rates of severe maternal morbidity before and after risk adjustment for comorbidities compared to the White group (1.3% before, 1.3% after): American Indian-Alaska Native (2.1% before, 1.8% after), Asian (1.5% before, 1.7% after), Black (2.5% before, 2.0% after), Latinx (1.6% before, 1.7% after), Pacific Islander (2.2% before, 1.9% after), and Multi-race groups (1.7% before, 1.6% after). Risk adjustment also modestly increased disparities for the foreign-born group and non-commercial insurance groups. Increasing educational attainment was associated with decreasing severe maternal morbidity rates, which was largely unaffected by comorbidity risk adjustment. The pattern of results was the same whether or not transfusion-only cases were included as severe maternal morbidity.
Conclusion.
These results support the use of an updated comorbidity scoring system to assess disparities in severe maternal morbidity. Disparities in severe maternal morbidity decreased in magnitude for some racial-ethnic and socioeconomic groups and increased in magnitude for others after adjustment for the comorbidity score.
Keywords: Pregnancy complications, health disparities, comorbidities, severe maternal morbidity, maternal mortality, risk adjustment, ethnic groups, socioeconomic groups, machine learning, International Classification of Diseases, patient discharge, obstetrics, maternal health, quality improvement
Condensation:
Robust standardization for comorbidities at delivery revealed insights into racial-ethnic and socioeconomic disparities in severe maternal morbidity, using a validated approach.
Introduction
Severe maternal morbidity is an increasingly common indicator of birth-related complications that can be life-threatening and have long-term health effects.1,2 The U.S. Centers for Disease Control and Prevention (CDC) led the development of an index that provides a consistent method to identify severe maternal morbidity cases in any administrative dataset, using diagnosis and procedure codes.1 The index is promising for maternal health surveillance, quality improvement, and research;1–3 however, it is difficult to compare severe maternal morbidity rates between patient populations because of differences in preexisting comorbidities, which strongly affect the risk of severe maternal morbidity occurring.4–7 Confounding by comorbidities presents a major challenge in determining the role of intrapartum care on severe maternal morbidity and its disparities.
Comorbidity scores are a well-established approach to dealing with case-mix adjustment in health studies, and we recently developed and validated an obstetric comorbidity scoring system that expanded on prior work.7,8 We used a targeted causal inference approach integrated with machine learning to rank 26 comorbidities based on their importance in predicting severe maternal morbidity. 8 We then used those results to assign scores to each comorbidity, which sum to a single score. The scoring system was validated in California all-payer data and in national commercial claims data. The comorbidities include medical comorbidities (e.g., chronic hypertension), comorbidities related to the current pregnancy (e.g., placenta previa), prior cesarean birth, high body mass index (BMI), and advanced maternal age.
Race-ethnicity and socioeconomic factors were purposefully excluded from the development of the comorbidity scoring system to prevent embedding these social factors in risk assessment and decision making, and to enable the evaluation of disparities in severe maternal morbidity independent of differences in comorbidities – a critical need to gain insights into disparities in intrapartum care.8,9 Given that socially marginalized groups, especially racial-ethnic minoritized groups, bear the largest burden of severe maternal morbidity, and addressing maternal health inequities is a national priority,10–14 it is essential to ensure that the validity of the comorbidity scoring system is robust across these important disparity subpopulations. Thus, the goals of this study were: (1) to evaluate the performance of applying the obstetric comorbidity scoring system across racial-ethnic and socioeconomic groups and (2) to determine the effect of risk adjustment for the obstetric comorbidity score on disparities in severe maternal morbidity. We additionally aimed to update the comorbidity scoring system, including the addition of International Classification of Diseases Clinical Modification (ICD-CM) 9th revision diagnosis codes.
Materials and Methods
We conducted a cohort study using California statewide data for live births during 2011–2017. Birth certificates were previously linked to birth hospitalization discharge data by the California Maternal Quality Care Collaborative Data Center, with a successful linkage rate of 98.2%. Ethics approval was obtained from the State of California Committee for the Protection of Human Subjects and the Stanford University Research Compliance Office. We followed the STROBE (Strengthening the Reporting of Observational Studies in Epidemiology) and TRIPOD (Transparent Reporting of a Multivariable Prediction Model for Individual Prognosis) statements in the reporting of our study.
Severe maternal morbidity was the outcome of interest and defined in two ways. We used ICD-CM diagnosis and procedures codes during hospitalization for birth to identify indicators of severe maternal morbidity.15 The CDC and others now commonly report severe maternal morbidity both including and excluding blood transfusion-only cases;1,15,16 we refer to the latter as non-transfusion severe maternal morbidity. Blood transfusion is the only indicator of severe maternal morbidity in approximately half of cases, some of which may represent less severe complications.17
We initially identified 26 comorbidities following our previously published obstetric comorbidity scoring system for predicting severe maternal morbidity using ICD-10-CM diagnosis codes.8 The scoring system weights comorbidities based on their relative importance in predicting the occurrence of severe maternal morbidity. We then updated the scoring system in the original dataset of ICD-10-CM data years (2016–2017) based on findings since the original publication (Table 1). In brief, we used an updated set of codes for severe maternal morbidity released by the CDC and its partners, added uterine fibroids as a potential risk factor,18 restricted bleeding disorders to codes indicated as present on admission for birth hospitalization, and revised codes used for bleeding disorders, high BMI, gastrointestinal disease, major mental health disorder, neuromuscular disease, and placenta accreta spectrum. After conducting these analyses and calculating scores for each comorbidity, we converted all diagnosis codes to ICD-9-CM to include data prior to the national implementation of ICD-10-CM in this study. We assessed consistency of the codes across the ICD-CM transition by calculating the annual prevalence of each comorbidity. Because our dataset for this study included linked birth certificates, we used those data to extract gestational age and BMI at delivery. We made recommendations for ICD-CM codes if birth certificates are not available in other datasets. Further details are provided in Appendix 1. We have also made the comorbidity scoring system publicly available on the CMQCC website.19
Table 1.
Comorbidities included in the scoring system with revised weighted scores for severe maternal morbidity and nontransfusion severe maternal morbidity.
| Comorbidity | Score for SMM | Score for non-transfusion SMM |
|---|---|---|
| Placenta accreta spectrum | 27 | 43 |
| Pulmonary hypertension | 20 | 33 |
| Chronic renal disease | 17 | 30 |
| Cardiac disease, preexisting | 14 | 25 |
| HIV/AIDS | 13 | 13 |
| Preeclampsia with severe features | 12 | 18 |
| Placental abruption | 9 | 13 |
| Bleeding disorder, preexisting | 9 | 11 |
| Anemia, preexisting | 9 | 6 |
| Twin/multiple pregnancy | 9 | 5 |
| Preterm birth (< 37 weeks) | 8 | 13 |
| Placenta previa, complete or partial | 8 | 3 |
| Neuromuscular disease | 6 | 13 |
| Asthma, acute or moderate/severe | 5 | 12 |
| Preeclampsia without severe features or gestational hypertension | 5 | 7 |
| Connective tissue or autoimmune disease | 4 | 8 |
| Uterine fibroids | 4 | 7 |
| Substance use disorder | 4 | 4 |
| Gastrointestinal disease | 3 | 7 |
| Chronic hypertension | 3 | 6 |
| Major mental health disorder | 3 | 4 |
| Preexisting diabetes mellitus | 2 | 6 |
| Thyrotoxicosis | 2 | 2 |
| Previous cesarean birth | 2 | 0 |
| Gestational diabetes mellitus | 1 | 1 |
| Delivery BMI ≥ 40 | 1 | 0 |
| Maternal age ≥ 35 years | 0 | 1 |
We focused our analyses on subpopulations defined by race-ethnicity, nativity, expected payment method for birth hospitalization, and educational attainment. These sociodemographic factors are collected on the birth certificate, and health inequities among these subpopulations are well known.13,14,20 Maternal race, ethnicity, place of birth, and educational attainment are self-reported during the birth hospitalization. The California Office of Statewide Health Planning and Development categorizes free-form responses for these variables. Latinx included individuals who reported being of Spanish or Hispanic origin. If an individual reported more than one racial group, we categorized them as multi-race. The most common multi-race combinations were Black-White (9%), White-American Indian/Alaska Native (8%), and White-Asian (8%). Individuals classified as “Other-Specified” by the state who were not Latinx were categorized as “other race-ethnicity.” For payment method, we grouped uncommon payment methods for birth hospitalization as “other” (5%), which included self-pay (67%), CHAMPUS/TRICARE (21%), medically unattended births (2%), and others not specified (10%). For all analyses, we excluded subjects missing the given sociodemographic factor of interest. We did not exclude subjects with any missing sociodemographic factor from all analyses to maximize sample size as the factors were not included together in any analysis. All analyses described below were conducted for severe maternal morbidity both including and excluding transfusion-only cases.
We first evaluated performance of the comorbidity scoring system to predict severe maternal morbidity overall and across the sociodemographic groups. We assessed discrimination by plotting receiver operating characteristic (ROC) curves and precision-recall curves, then calculating the respective areas under the curve. Discrimination measures how well a model differentiates people at higher risk of having an outcome from people at lower risk. The precision-recall curve is informative when an outcome is very rare or very common because the area under the ROC curve can appear misleadingly positive about the discrimination of the model.21 We further assessed performance of the scoring system by plotting lowess-smoothed calibration curves. Calibration measures the goodness of fit; that is, the extent to which a model correctly estimates the absolute risk of an outcome.22 We also calculated the median comorbidity score with an interquartile range for the full population and each subpopulation.
After evaluating score performance, we assessed disparities in the rate of severe maternal morbidity before and after risk adjustment for the comorbidity score. The observed incidence of severe maternal morbidity was calculated overall and within each sociodemographic group. In the full study population, we conducted a logistic regression model for severe maternal morbidity using comorbidity score as the predictor. We used this regression model to predict the expected severe maternal morbidity rate within each subpopulation. We then calculated the risk-adjusted rate in each subpopulation as: . Next, we estimated crude relative risks (RR) with 95% confidence intervals (CI) for potential disparities by conducting a series of logistic regression models with each sociodemographic indicator modeled separately. Odds ratios approximated relative risks (RR) because of the rarity of the outcome (<2%). We selected the lowest-risk group as the reference group in each model. Lastly, we adjusted each of these four regression models for the comorbidity score to estimate risk-adjusted RR with 95% CI. The dataset was generated in SAS 9.4 and analyses were conducted in R 3.6.1.
Results
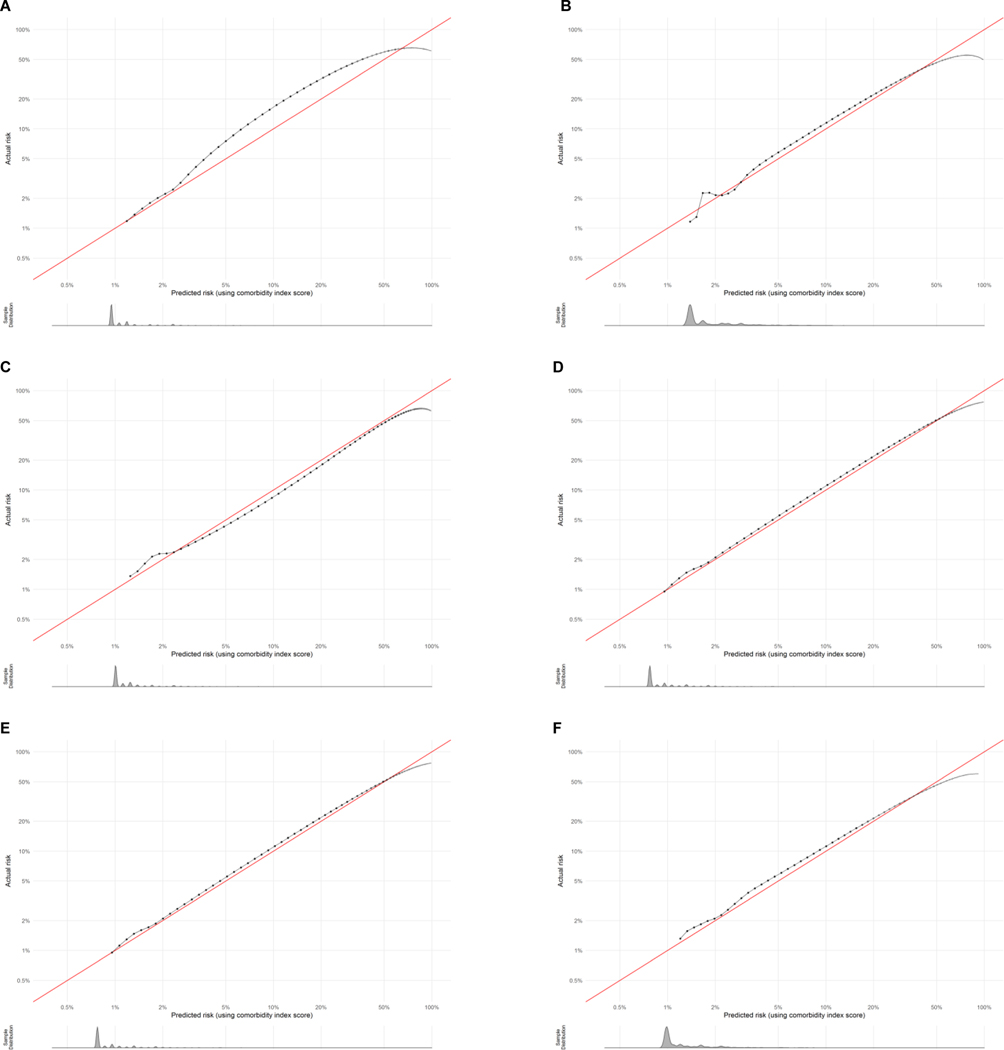
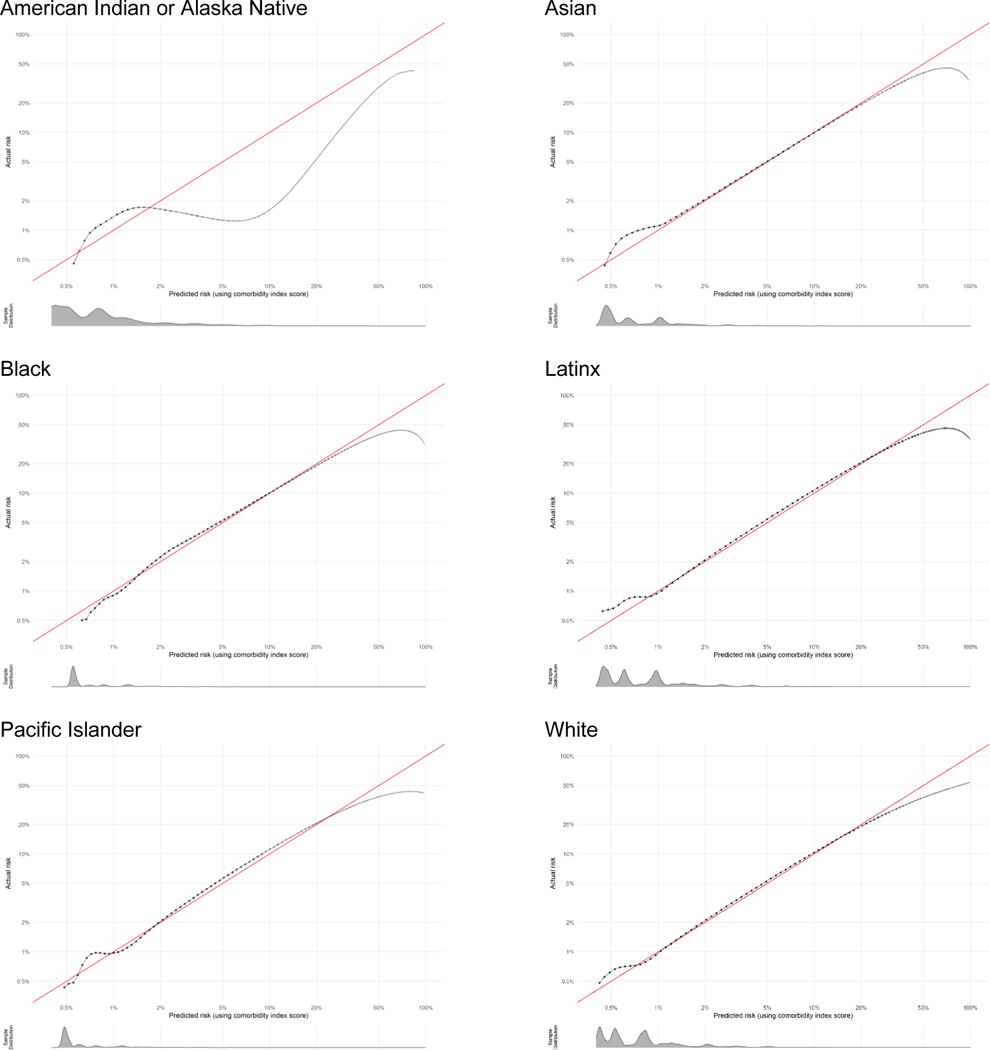
The full study population included 3,308,554 live births, of which 53,296 (1.61%) experienced severe maternal morbidity. In the full study population, the largest racial-ethnic group was Latinx (48%), most individuals were born in the U.S. (63%), nearly half paid for their birth hospitalization with commercial insurance (48%), and the majority (57%) had completed education beyond high school (Table 2). Among the sociodemographic groups, the median comorbidity score was highest for the Black, American Indian-Alaska Native, and multi-race groups. The area under the ROC curve varied between 0.68 and 0.71 among all groups and the area under the precision-recall curve varied between 0.08 and 0.12, indicating minimal variation across groups in differentiating lower- and higher-risk individuals. Calibration plots overall showed excellent concordance between predicted and actual severe maternal morbidity risk across groups. Plots are shown in Figure 1 for each racial-ethnic group representing ≥1% of the California birthing population. Histograms of the predicted risk distributions are shown beneath each calibration plot. For example, the score slightly under predicted risk in higher-risk individuals in the Asian group (actual risk was approximately 7% when predicted risk was 5%). The goodness of fit was difficult to assess in the very small subpopulations and decreased at very high risk levels. All calibration plots are provided with additional detail in Appendix 2.
Table 2.
Discrimination of comorbidity scoring systems for severe maternal morbidity in California birth data, 2011–2017 (N = 3,308,554)
| N (column %) | Mean SMM comorbidity score (SD) | Area under ROC curve | Area under PR curve | |
|---|---|---|---|---|
| All | 3,308,554 (100) | 2.6 (5.0) | 0.69 | 0.10 |
| Race-Ethnicity (n = 3,225,224) | ||||
| American Indian-Alaska Native | 10,920 (<1) | 3.6 (5.8) | 0.71 | 0.12 |
| Asian | 386,864 (12) | 2.1 (4.4) | 0.68 | 0.09 |
| Black | 164,943 (5) | 4.0 (6.3) | 0.71 | 0.12 |
| Latinx | 1,545,628 (48) | 2.5 (4.8) | 0.68 | 0.10 |
| Pacific Islander | 97,288 (3) | 3.4 (5.8) | 0.68 | 0.11 |
| White | 888,017 (28) | 2.7 (5.0) | 0.69 | 0.08 |
| Multi-race | 127,540 (4) | 3.3 (5.5) | 0.70 | 0.09 |
| Other | 4,024 (<1) | 2.6 (5.0) | 0.68 | 0.12 |
| Nativity (n = 3,308,355) | ||||
| Born in U.S. | 2,074,588 (63) | 2.9 (5.2) | 0.69 | 0.09 |
| Not born in U.S. | 1,233,767 (37) | 2.4 (4.7) | 0.69 | 0.11 |
| Payment method (n = 3,304,448) | ||||
| Commercial insurance | 1,588,867 (48) | 2.8 (5.1) | 0.69 | 0.09 |
| Government programs | 1,560,790 (47) | 2.6 (5.0) | 0.69 | 0.11 |
| Other | 154,791 (5) | 2.1 (4.3) | 0.70 | 0.10 |
| Educational Attainment (n = 3,165,563) | ||||
| Less than high school graduate | 567,248 (18) | 2.6 (4.9) | 0.69 | 0.10 |
| High school graduate or equivalent | 808,836 (26) | 2.6 (5.0) | 0.69 | 0.10 |
| Some college | 845,156 (27) | 2.8 (5.2) | 0.69 | 0.09 |
| College graduate or higher | 944,323 (30) | 2.5 (4.9) | 0.69 | 0.08 |
SMM, severe maternal morbidity; IQR, interquartile range; ROC, receiver operating characteristic
Figure 1.
Calibration plots for assessment of how well the comorbidity score predicts the absolute risk of severe maternal morbidity across racial-ethnic groups. A: Asian; B: Black; C: Latinx; D: Pacific Islander; E: White; F: Multi-race. Data have been log-transformed and histograms show distributions of predicted risk.
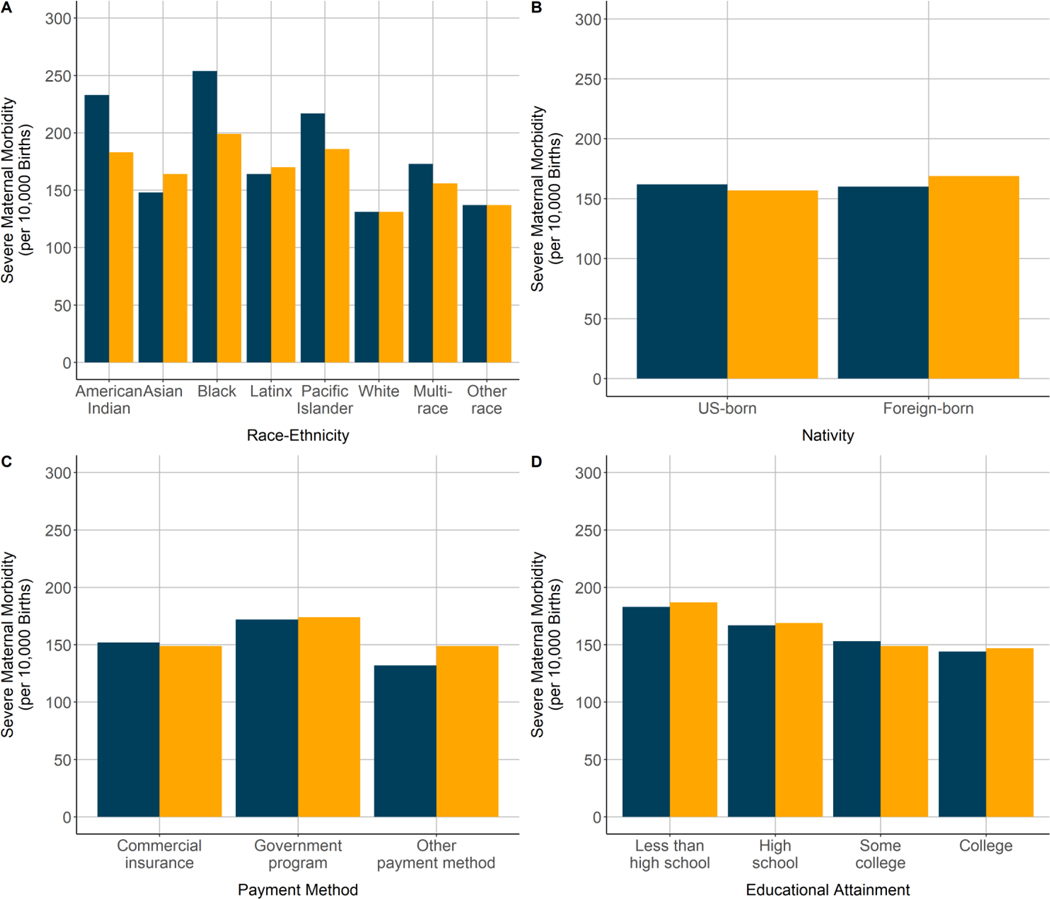
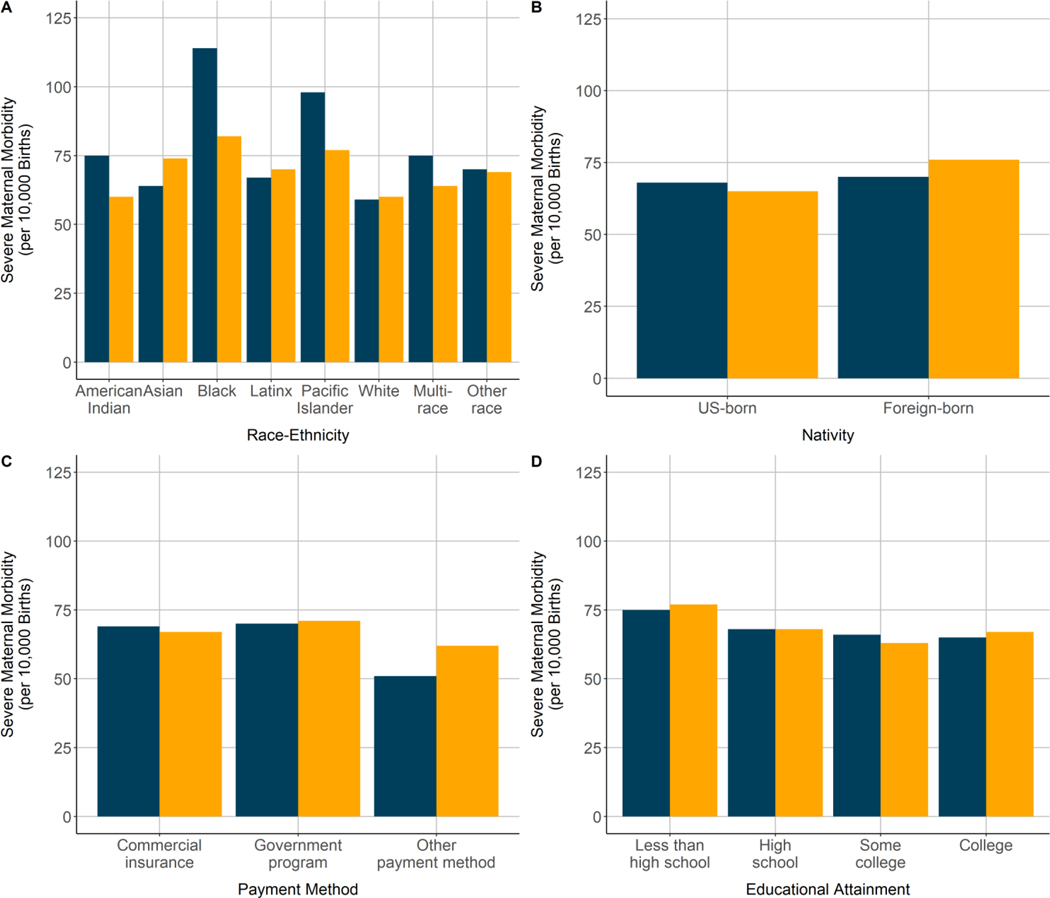
Racial-ethnic disparities existed in severe maternal morbidity rates, but decreased in magnitude for some groups and increased in magnitude for others after adjustment for the comorbidity score. Among racial-ethnic groups, observed severe maternal morbidity rates were highest in the Black (2.54%), Pacific Islander (2.17%), and American Indian-Alaska Native (2.33%) groups and lowest in the White (1.31%) and Asian (1.48%) groups (Figure 1). Standardization for the comorbidity scores attenuated the severe maternal morbidity rates in the Pacific Islander (1.88%), Black (2.00%), and American Indian-Alaska Native (1.82%) groups; however, rates in these groups remained the highest, and standardization increased the severe maternal morbidity rates in the Asian (1.48% before, 1.65% after) and Latinx (1.64% before, 1.69% after) groups.
The observed severe maternal morbidity rate did not differ by nativity status, but the foreign-born group had a significantly higher severe maternal morbidity rate than the U.S.-born group after risk adjustment (aRR: 1.08; 95% CI: 1.06–1.10) (Table 3). Similarly, the disparity in severe maternal morbidity for the government-sponsored insurance group was higher after risk adjustment (aRR: 1.18; 95% CI: 1.16–1.20, compared with commercial insurance). Risk adjustment had a minimal effect on differences in severe maternal morbidity rates by educational attainment. The severe maternal morbidity rate decreased with increasing educational attainment both before and after risk adjustment (aRR: 1.29; 95% CI: 1.26–1.32 for less than high school compared with college degree; aRR: 1.16; 95% CI: 1.13–1.19 for high school degree), although no difference remained between women with some college and women with college or advanced degrees after risk adjustment.
Table 3.
Disparities in severe maternal morbidity rates before and after adjustment for comorbidity score, California birth data, 2011–2017
| Subpopulations | Crude RR (95% CI) | Adjusted RR (95% CI) |
|---|---|---|
| Race-Ethnicity (n = 3,225,224)* | ||
| American Indian-Alaska Native | 1.64 (1.44, 1.87) | 1.42 (1.24, 1.63) |
| Asian | 1.13 (1.10, 1.17) | 1.27 (1.23, 1.31) |
| Black | 1.97 (1.90, 2.04) | 1.58 (1.52, 1.64) |
| Latinx | 1.25 (1.23, 1.28) | 1.31 (1.28, 1.34) |
| Pacific Islander | 1.67 (1.60, 1.75) | 1.47 (1.40, 1.54) |
| White | Reference | Reference |
| Multi-race | 1.33 (1.27, 1.39) | 1.21 (1.15, 1.26) |
| Other | 1.04 (0.80, 1.36) | 1.04 (0.79, 1.37) |
| Nativity (n = 3,308,355)* | ||
| Born in U.S. | Reference | Reference |
| Not born in U.S. | 0.99 (0.97, 1.01) | 1.08 (1.06, 1.10) |
| Payment method (n = 3,304,448)* | ||
| Commercial insurance | Reference | Reference |
| Government programs | 1.13 (1.11, 1.15) | 1.17 (1.15, 1.19) |
| Other | 0.86 (0.82, 0.90) | 0.99 (0.95, 1.04) |
| Educational Attainment (n = 3,165,563)* | ||
| Less than high school graduate | 1.28 (1.25, 1.31) | 1.28 (1.25, 1.32) |
| High school graduate or equivalent | 1.16 (1.14, 1.19) | 1.15 (1.12, 1.18) |
| Some college | 1.06 (1.04, 1.09) | 1.01 (0.98, 1.03) |
| College graduate or higher | Reference | Reference |
SMM, severe maternal morbidity; RR, relative risk; CI, confidence interval
Sample sizes differ because of each the four stratified models excluded only individuals missing that sociodemographic factor of interest.
Results were overall similar for non-transfusion severe maternal morbidity. In the full population, 22,712 births (0.69%) experienced non-transfusion severe maternal morbidity. The median comorbidity score was highest in the Black group (Table 4). The area under the ROC curve and area under the precision-recall curve statistics indicated minimal variation across sociodemographic groups and calibration plots showed excellent concordance between predicted and actual risk of non-transfusion severe maternal morbidity; plots are shown in Appendix 3. As observed when including transfusion-only cases, risk adjustment attenuated disparities for all racial-ethnic groups except the Asian and Latinx groups, for whom disparities increased. Before and after risk adjustment, the highest rates of non-transfusion severe maternal morbidity were in the Black and Pacific Islander groups (Appendix 4). As also observed when including transfusion-only cases, a disparity between the U.S.-born and foreign-born groups only became evident after risk adjustment, disparities by payment method increased, and educational disparities were largely unaffected by risk adjustment (Table 5).
Table 4.
Discrimination of comorbidity scoring systems for non-transfusion severe maternal morbidity in California birth data, 2011–2017 (N = 3,308,554)
| N (column %) | Mean SMM comorbidity score (SD) | Area under ROC curve | Area under PR curve | |
|---|---|---|---|---|
| All | 3,308,554 (100) | 4.1 (8.1) | 0.74 | 0.10 |
| Race-Ethnicity (n = 3,225,224) | ||||
| American Indian-Alaska Native | 10,920 (<1) | 4.9 (9.0) | 0.78 | 0.15 |
| Asian | 386,864 (12) | 3.1 (6.7) | 0.73 | 0.09 |
| Black | 164,943 (5) | 5.8 (9.8) | 0.73 | 0.11 |
| Latinx | 1,545,628 (48) | 3.5 (7.5) | 0.74 | 0.12 |
| Pacific Islander | 97,288 (3) | 5.3 (9.3) | 0.74 | 0.12 |
| White | 888,017 (28) | 3.9 (7.7) | 0.72 | 0.08 |
| Multi-race | 127,540 (4) | 4.8 (8.7) | 0.75 | 0.09 |
| Other | 4,024 (<1) | 3.7 (7.7) | 0.76 | 0.09 |
| Nativity (n = 3,308,355) | ||||
| Born in U.S. | 2,074,588 (63) | 4.1 (8.1) | 0.73 | 0.10 |
| Not born in U.S. | 1,233,767 (37) | 3.4 (7.2) | 0.74 | 0.12 |
| Payment method (n = 3,304,448) | ||||
| Commercial insurance | 1,588,867 (48) | 4.2 (8.0) | 0.72 | 0.08 |
| Government programs | 1,560,790 (47) | 3.6 (7.7) | 0.75 | 0.13 |
| Other | 154,791 (5) | 2.7 (6.4) | 0.76 | 0.12 |
| Educational Attainment (n = 3,165,563) | ||||
| Less than high school graduate | 567,248 (18) | 3.6 (7.5) | 0.74 | 0.15 |
| High school graduate or equivalent | 808,836 (26) | 3.6 (7.7) | 0.74 | 0.11 |
| Some college | 845,156 (27) | 4.1 (8.1) | 0.74 | 0.09 |
| College graduate or higher | 944,323 (30) | 3.8 (8.8) | 0.72 | 0.08 |
SMM, severe maternal morbidity; IQR, interquartile range; ROC, receiver operating characteristic
Table 5.
Disparities in non-transfusion severe maternal morbidity rates before and after adjustment for comorbidity score, California birth data, 2011–2017
| Subpopulations | Crude RR (95% CI) | Adjusted RR (95% CI) |
|---|---|---|
| Race-Ethnicity (n = 3,225,224)* | ||
| American Indian-Alaska Native | 1.28 (1.03, 1.60) | 1.00 (0.80, 1.26) |
| Asian | 1.09 (1.03, 1.14) | 1.25 (1.19, 1.31) |
| Black | 1.95 (1.84, 2.06) | 1.41 (1.34, 1.50) |
| Latinx | 1.14 (1.10, 1.18) | 1.17 (1.14, 1.22) |
| Pacific Islander | 1.68 (1.56, 1.80) | 1.31 (1.22, 1.41) |
| White | Reference | Reference |
| Multi-race | 1.28 (1.19, 1.37) | 1.08 (1.00, 1.16) |
| Other | 1.19 (0.82, 1.72) | 1.16 (0.79, 1.71) |
| Nativity (n = 3,308,355)* | ||
| Born in U.S. | Reference | Reference |
| Not born in U.S. | 1.03 (1.00, 1.06) | 1.18 (1.15, 1.21) |
| Payment method (n = 3,304,448)* | ||
| Commercial insurance | Reference | Reference |
| Government programs | 1.03 (1.00, 1.05) | 1.06 (1.03, 1.09) |
| Other | 0.74 (0.69, 0.79) | 0.91 (0.85, 0.99) |
| Educational Attainment* (n = 3,165,563) | ||
| Less than high school graduate | 1.16 (1.12, 1.21) | 1.16 (1.11, 1.21) |
| High school graduate or equivalent | 1.05 (1.01, 1.09) | 1.02 (0.98, 1.05) |
| Some college | 1.02 (0.98, 1.05) | 0.92 (0.89, 0.96) |
| College graduate or higher | Reference | Reference |
SMM, severe maternal morbidity; RR, relative risk; CI, confidence interval
Sample sizes differ because of each the four stratified models excluded only individuals missing that sociodemographic factor of interest.
Comment
Principal Findings
We found a recently developed obstetric comorbidity scoring system to perform well across racial-ethnic and socioeconomic groups in a large, diverse population of live births in California during 2011 to 2017. Significant differences in comorbidity scores and severe maternal morbidity were observed, particularly among racial-ethnic groups. Racial-ethnic disparities existed in severe maternal morbidity rates, but decreased in magnitude for some groups and increased in magnitude for others after adjustment for the comorbidity score. We believe these findings support the use of the comorbidity scores to assess disparities in severe maternal morbidity and improve our understanding of maternal health inequities.
Results in the context of what is known
This study built on prior development and validation of the obstetric comorbidity score in unselected obstetric populations.8 Race-ethnicity and socioeconomic factors were not included in development of the comorbidity score because of concern that doing so would embed these social characteristics in risk assessment and decision making, to the harm of socially marginalized individuals.9 We then undertook this study to evaluate the score’s validity in racial-ethnic and socioeconomic groups as a way to determine whether the score enables comparisons between such groups independent of differences in preexisting health conditions. We chose to focus on four sociodemographic factors – race-ethnicity, nativity, payment method, and educational attainment – that comprise socially marginalized groups and are collected on the birth certificate with overall good validity.23 We also built on our previous work by updating the comorbidity scoring system, including the addition of uterine fibroids and expansion to include ICD-9-CM codes, which were used in the U.S. prior to 2016. The ICD-9-CM expansion enables use of the score in data extending over many years. Overall, our study fulfills the important need for a valid method to measure and adjust for comorbidities related to severe maternal morbidity across racial-ethnic and socioeconomic groups in the U.S.
Non-white individuals experience higher rates of severe maternal morbidity than white individuals,13,16,24 which we also found. Prior evidence supports the interpretation that racism experienced throughout the life course and across generations has led to racially minoritized groups, particularly Black and American Indian-Alaska Native individuals, experiencing high rates of chronic conditions, and such conditions increase the risk of severe maternal morbidity.8,25–28 The persistence of severe maternal morbidity disparities for non-white individuals after comorbidity risk adjustment in this study further suggests that factors other than comorbidities, such as lower quality health care and other social factors, may contribute to such disparities and deserve further attention.10,25,26
Risk adjustment for comorbidities exacerbated disparities in severe maternal morbidity for several marginalized groups, including individuals who were Asian or Latinx, born outside the U.S., and who did not use commercial insurance to pay for their birth hospitalization. That is, when we accounted for the relatively better underlying health of these groups, we found that the severe maternal morbidity disparity increased in magnitude – suggesting disparities in obstetric care. In the case of foreign-born individuals, we found that without comorbidity adjustment, the disparity was actually unobservable. Foreign-born individuals are well-known to have better overall health and neonatal outcomes than U.S.-born individuals, which may be attributed to better underlying health.29,30
Similarly, our results suggest that disparities in severe maternal morbidity for individuals with Medicaid or similar government-sponsored payment programs may be substantially higher, more than 20%, when one accounts for the better underlying health of these individuals. A study in New York City reported a lower severe maternal morbidity disparity for Medicaid-insured obstetric patients (aOR 1.05 vs aRR 1.17 in this study),31 which may differ because of geographic differences and that the comorbidity score used in this study partially accounts for the severity of (rather than just the presence of) comorbidities. Surprisingly, we also found that comorbidity risk adjustment largely did not affect the association between educational attainment and severe maternal morbidity. Educational attainment is strongly linked to overall socioeconomic advantage and health outcomes.32 Our results suggest that the causes of educational disparities may be different than for other social disparities in severe maternal morbidity.
Clinical Implications
The study findings support the use of the updated obstetric comorbidity scoring system to assessing social disparities in severe maternal morbidity rates independent of comorbidities at the time of birth hospitalization. Severe maternal morbidity and its disparities are increasingly being used for maternal health surveillance and quality improvement and the scoring system and this study’s results are informative for those efforts. We developed this scoring system for the purpose of risk adjustment, and further research is needed to determine utility in patient-level assessment and decision-making.
Research Implications
This study aims to enable future studies that examine questions about maternal health inequities. In particular, consideration of intersectionality is an important area of future maternal health equity research. Intersectionality is a critical analytic framework to understand the overlap between race, socioeconomic status, and other social characteristics.33,34 Further research is also needed to assess utility in comparing risk-adjusted severe maternal morbidity disparities between hospitals as coding practices may differ.
Strengths and Limitations
This study’s findings should be interpreted in light of its strengths and limitations. The dataset used was limited to records from the delivery hospitalization, which could lead to misclassification of complications as comorbidities. We attempted to address this concern by restricting bleeding disorders and anemia to those present on admission, which we encourage researchers to do when possible. Our dataset likely also under-identifies very rare obstetric complications, misses details from prenatal and postpartum encounters, and may be biased by more intensive diagnostic coding for more complicated births.35–37 The transition from ICD-9-CM to ICD-10-CM was problematic for certain diagnoses and procedures, and we addressed this limitation as best as possible by assessing comorbidity prevalence changes over time, modifying ICD-CM codes to achieve temporal consistency in comorbidity rates, and using a validated algorithm to identify placenta accreta spectrum in ICD-9-CM years (details in Appendix 2). We also conducted all analyses for severe maternal morbidity both including and excluding transfusion-only cases. In addition, the generalizability of our findings was not assessed. However, we previously validated the obstetric comorbidity scores in national commercial claims data and California is a diverse state that represents 1 in 8 births in the U.S.8 We did not use national claims data for this study because of limited information on race-ethnicity and socioeconomic factors. We used information on race-ethnicity and socioeconomic factors collected on birth certificates, which have been found to have good validity,38,39 but it is likely some misclassification occurred.
Conclusions
Our findings have significant implications for maternal health practices and policies. Substantial attention has been paid to regionalizing obstetric care and achieving appropriate acuity of care for patients based on their medical and obstetric comorbidities.40 Additionally, recent national efforts have focused on improving the quality of obstetric care for racially minoritized groups, particularly Black individuals.26 This study supports the use of the comorbidity scores in these efforts, particularly as administrative data are often used for process and outcome evaluation.1 Our findings also underscore the importance of addressing determinants of health inequities both during and before pregnancy, as preconception health and perinatal care strongly affect severe maternal morbidity and mortality.
Figure 2.
Severe maternal morbidity incidence before (blue) and after (yellow) standardization for the obstetric comorbidity score among racial-ethnic and socioeconomic subpopulations, California live births, 2011–2017.
AJOG at a Glance:
A. Why was the study conducted?
To evaluate the performance of applying an updated obstetric comorbidity scoring system across racial-ethnic and socioeconomic groups
To determine the effect of risk adjustment for the comorbidity score on disparities in severe maternal morbidity.
B. What are the key findings?
Obstetric comorbidity scores performed well across racial-ethnic and socioeconomic groups.
Disparities in severe maternal morbidity decreased in magnitude for some racial-ethnic and socioeconomic groups and increased in magnitude for others after adjustment for the comorbidity score.
C. What does the study add to what is already known?
This study updated an obstetric comorbidity scoring system, assessed its performance across socially marginalized groups, and provides new evidence on disparities in severe maternal morbidity independent of differences in health at the time of birth hospitalization.
Acknowledgments
We acknowledge the California Office of Statewide Health Planning and Development and the California Maternal Quality Care Collaborative for providing the study data.
Appendix
Appendix 1.
Comorbidities with ICD-CM codes for predicting SMM and non-transfusion SMM in administrative data.
| Comorbidity | ICD-9-CM | ICD-10-CM |
|---|---|---|
| Anemia, preexistinga | 280.0, 280.1, 280.9, 285.9, 280.8, 281, 282.0, 282.1, 282.3, 282.40, 282.41, 282.43, 282.44, 282.45, 282.46, 282.47, 282.49, 282.5, 282.60, 282.61, 282.63, 282.68, 282.7, 282.8, 282.9, 284, 285, 648.20, 648.21, 648.22, 628.23 | O99.01, O99.02, D50, D55, D56, D58, D59, D57.1, D57.20, D57.3, D57.40, D57.80 |
| Asthma, acute or moderate-severe | 493 | O99.5, J45.21, J45.22, J45.31, J45.32, J45.4, J45.5, J45.901, J45.902 |
| Bleeding disorder, preexistingc | 286.0–286.5, 286.7 287 | D66, D67, D68.0-D68.6, D69 |
| BMI (kg/m2) at delivery 40 or greaterd | Birth certificate - use code 278.01 if birth certificate not available | Birth certificate – use Z68.4, E66.01, E66.2 if birth certificate not available |
| Cardiac disease, preexisting | 394–397, 402–405, 412–414, 416.2, 416.8, 416.9, 428.22, 428.23, 428.32, 428.33, 428.42, 428.43, 745, 746, 648.5, 648.60648.63, 426, 427.0–427.4, 427.6–427.9 | I05-I09, I11-I13, I15, I16, I20, I25, I27.8, I30-I41, I44-I49, I50.22, I50.23, I50.32, I50.33, I50.42, I50.43, I50.812, I50.813 O99.41, O99.42, Q20-Q24 |
| Chronic hypertension | 401–405, 642.0–642.2, 642.7 | O10, O11, I10 |
| Chronic renal disease | 581–583, 585, 587, 588, 753, 250.4 249.4, 710.0 | O26.83, I12, I13, N03-N05, N07, N08, N11.1, N11.8, N11.9, N18, N25.0, N25.1, N25.81, N25.89, N25.9, N26.9 |
| Connective tissue or autoimmune disease | 710, 714, 279.4 | M30-M36 |
| Gastrointestinal diseasee | 539, 555–558, 570–579, 564, 646.7 | K50-K52, K70-K77, K80-K83, K85-K87, K94, K95, O26.6 |
| Gestational diabetes mellitus | 648.8 | O24.4 |
| HIV or AIDS | 042, V08 | O98.7, B20 |
| Major mental health disorderf | 295–298, 300.0, 300.21, 300.22, 300.3, 300.4, 301, 309 | F06, F20-F25, F28-F34, F39, F40.0, F41, F43, F53, F60 |
| Maternal age 35 y or older | Birth certificate/Discharge record | Birth certificate/Discharge record |
| Neuromuscular diseaseg | 345, 358 | G40, G70 |
| Placental abruption | 641.2 | O45 |
| Placenta accreta spectrumh | Use algorithm: no uterine rupture (665.0, 665.10, 665.11) PLUS (placenta previa (641.0, 641.1) or retained placenta (666.0, 667.x)) PLUS hysterectomy (PR 68.3–68.9) | O43.213, O43.223, O43.233 |
| Placenta previa, complete or partial | 641.01, 641.11 | O44.03, O44.13, O44.23, O44.33 |
| Preeclampsia with severe features | 642.5 | O14.1, O14.2, O11 |
| Preeclampsia without severe features or gestational hypertension | 642.3, 642.4, 642.7 | O13, O14.0, O14.9 |
| Preexisting diabetes mellitus | 250, 648.0 | E08-E13, O24.0, O24.1, O24.3, O24.8, O24.9, Z79.4 |
| Preterm birth (less than 37 wk) | Birth certificate (644.21 if not available) | Z3A.20-Z3A.36 |
| Previous cesarean birth | 654.2 | O34.21 |
| Pulmonary hypertension | 416.0, 416.8, 416.9 | I27.0, I27.2 |
| Substance use disorder | 291, 303, 304, 305, 648.30, 648.31, 648.32, 648.33 | F10-F19, O99.31, O99.32 |
| Thyrotoxicosis | 242 | E05 |
| Twin or multiple pregnancy | 651, V27.2-V27.7 | O30, O31, Z37.2-Z37.7 |
| Uterine fibroidsb | 218, 654.1 | D25, O34.1 |
All parent codes subsume child codes (e.g., 493 means 493.xx)
Revised from Leonard et al.8 to restrict to present on admission codes
Revised to include these two comorbidities, which were statistically significant in variable importance analyses for SMM.
Revised to exclude D68.8, D68.9 (could indicate DIC, an SMM indicator) and to restrict to present on admission codes.
Revised to include E66.01, E66.2 (severe obesity)
Revised to exclude O99.6, K00-K46, K55-K68, K80-K84, K90-K92 (found to be capturing non-relevant gastrointestinal diseases)
Revised to exclude O99.34 and include F06, F40.0, F41, F43, F53, F60 (revised codes to follow Veteran’s Administration recommendations for ICD-9-CM and ICD-10-CM coding of psychotic disorders, mood disorders, personality disorders, post-traumatic stress disorder, adjustment reactions, generalized anxiety, and panic disorders.41 Generalized anxiety and panic disorders conferred similar risk of the outcomes as the other disorders.)
Revised to exclude O99.35
Codes are PAS are not available in ICD-9-CM. Therefore, the ICD-9-CM algorithm follows the approach developed by Creanga et al.42 to identify PAS using ICD-9-CM. We found the PAS rate to be approximately 2 per 10,000 with that approach, and 11 per 10,000 with the ICD-10-CM approach in their respective time groups. Also revised from Leonard et al.8 to include only PAS if indicated in the third trimester
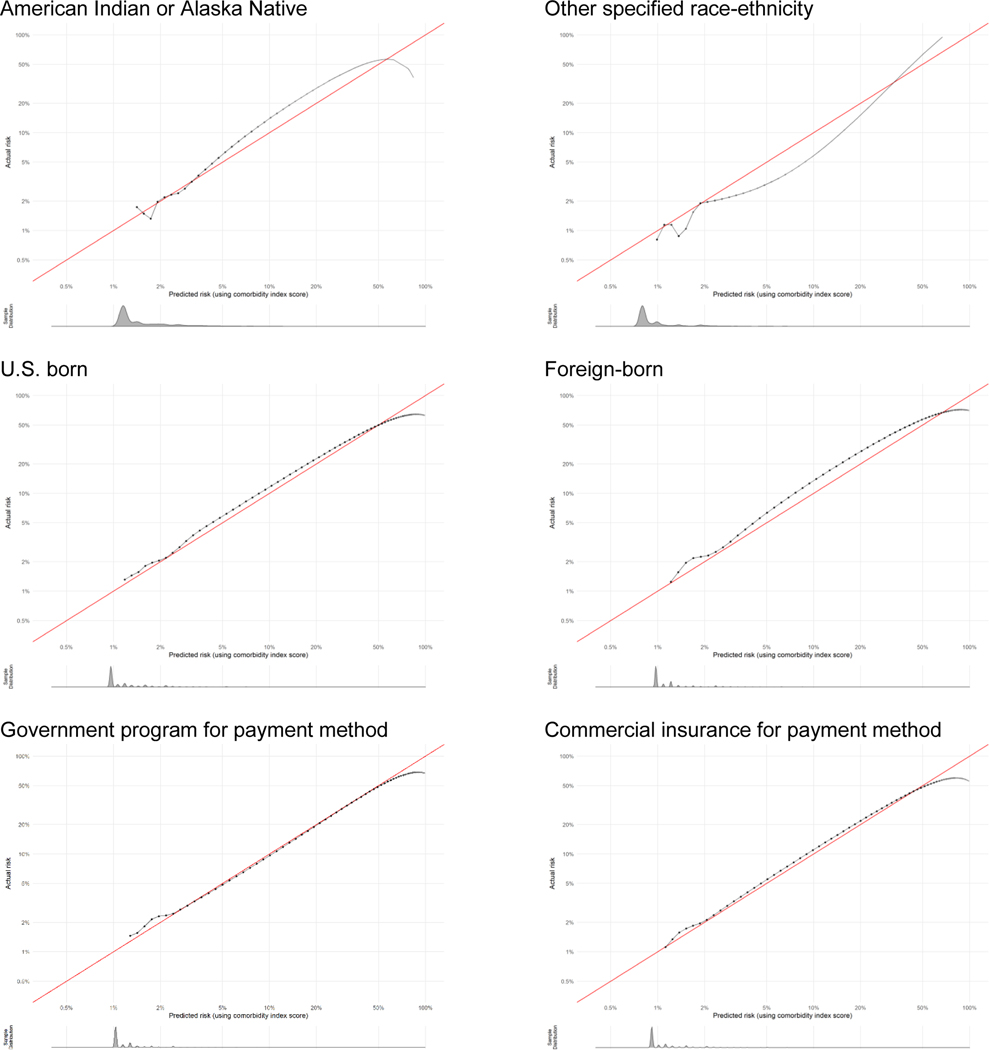
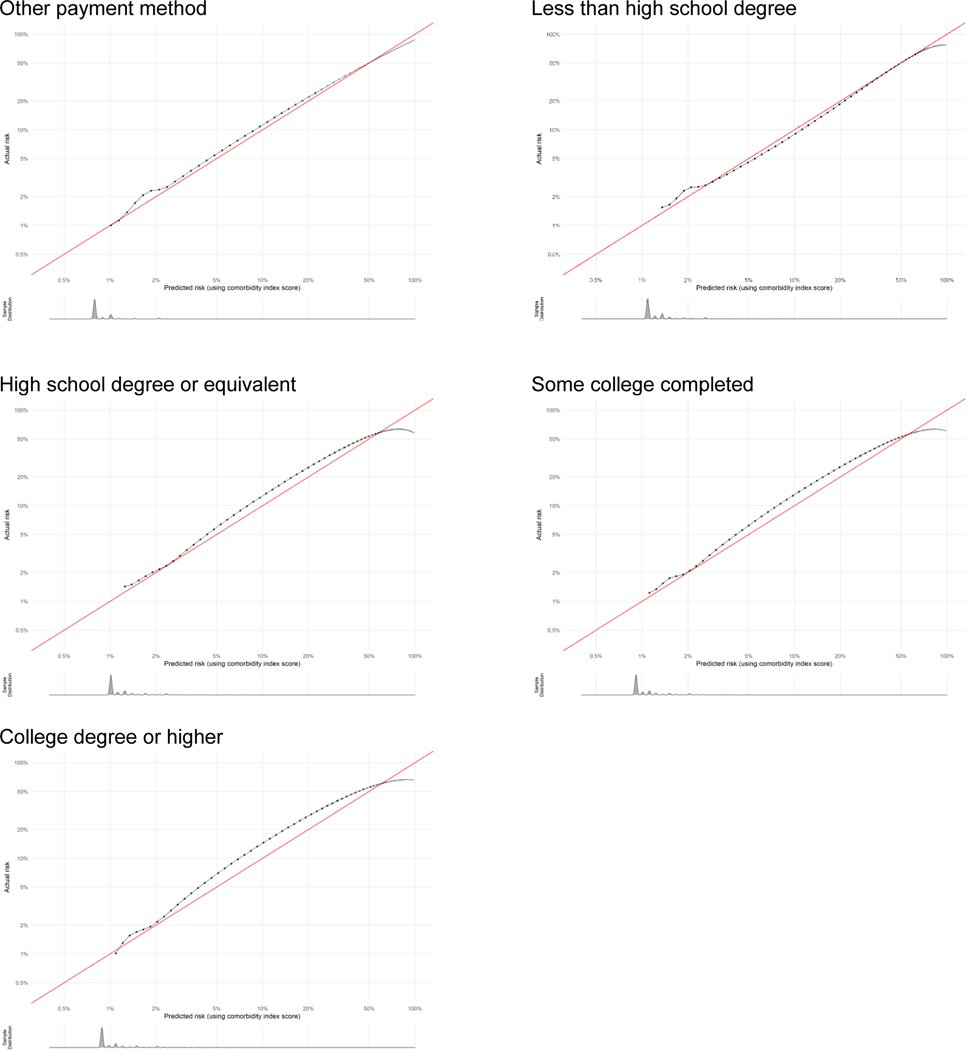
Appendix 2. Calibration plots for severe maternal morbidity comorbidity scores by subpopulation as indicator of goodness of fit.
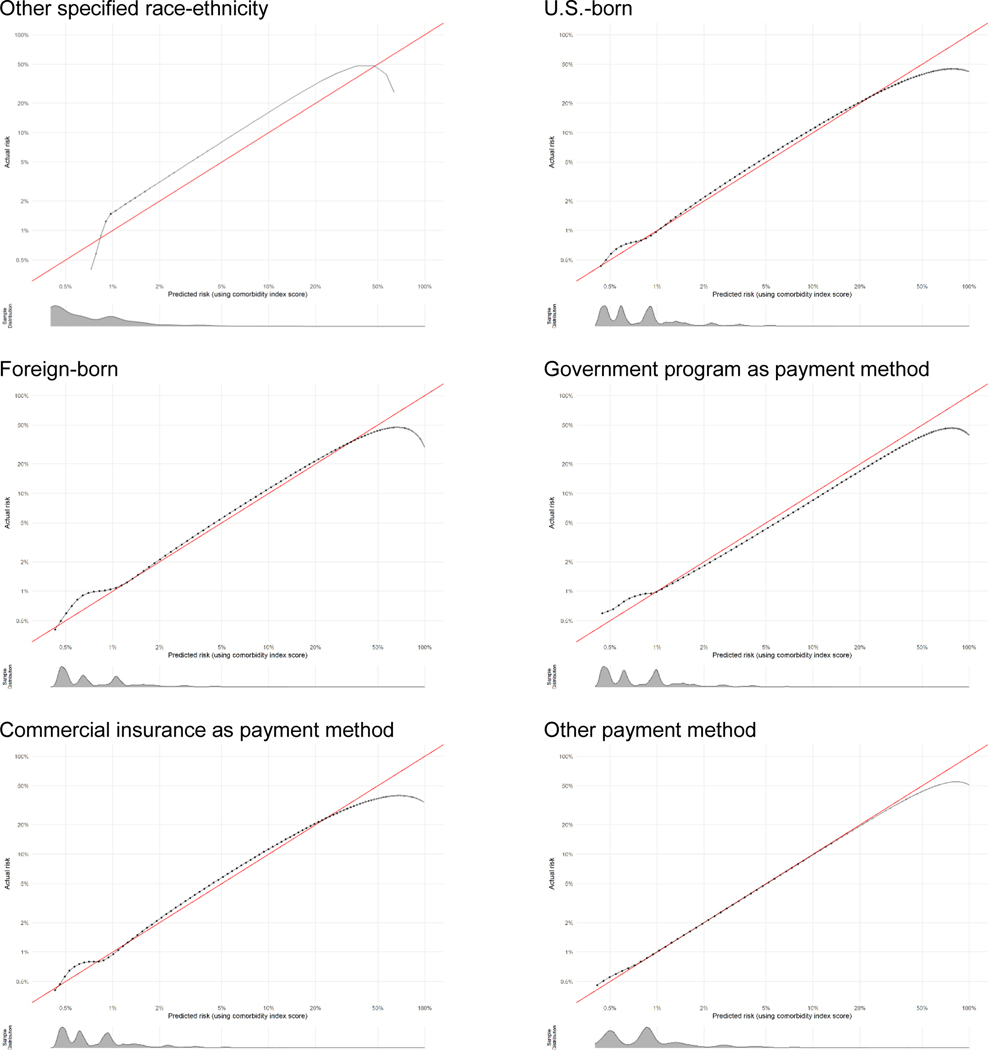
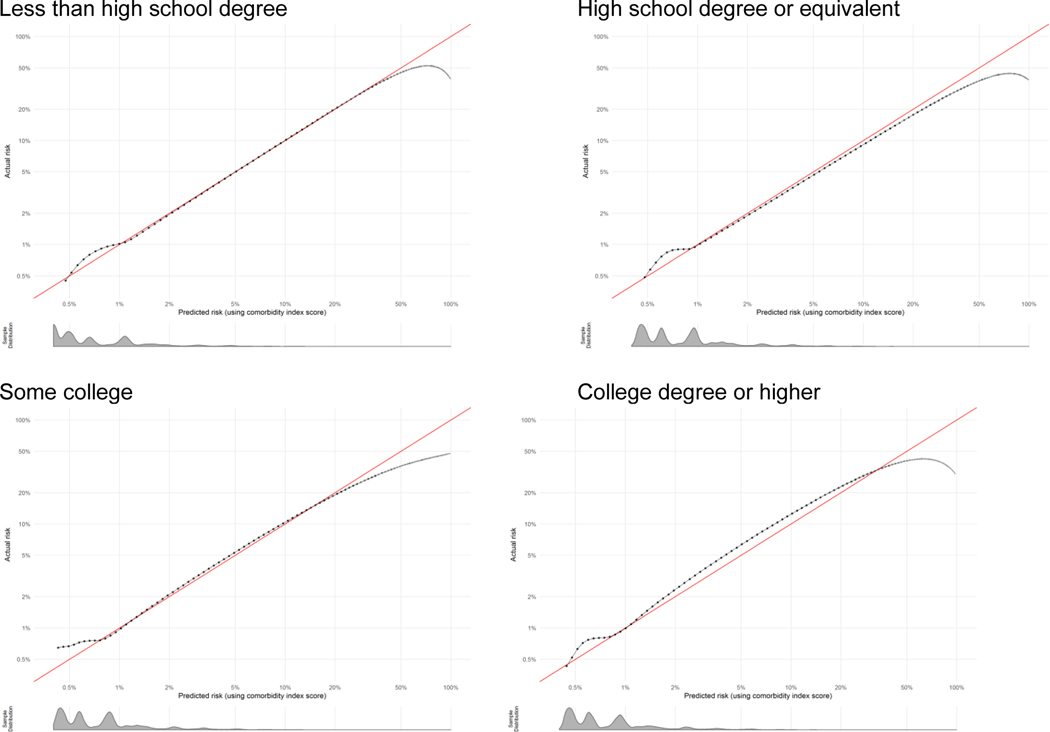
Calibration plots show how well the score predicts the absolute risk of the outcome. Data presented are log-transformed and histograms are shown beneath each calibration plot for distributions of predicted risk. Calibration is excellent in nearly all groups, with the notable exception of when sample size becomes very small (i.e., American Indian-Alaska Native, other race-ethnicity, other payment method, and at very high risk levels).
Appendix 3. Calibration plots for non-transfusion severe maternal morbidity comorbidity scores by subpopulation as indicator of goodness of fit.
Calibration plots show how well the score predicts the absolute risk of the outcome. Data presented are log-transformed and histograms are shown beneath each calibration plot for distributions of predicted risk. Calibration is excellent in nearly all groups, with the notable exception of when sample size becomes very small (i.e., American Indian-Alaska Native, other race-ethnicity, other payment method, and at very high risk levels).
Appendix 4.
Non-transfusion severe maternal morbidity incidence before (blue) and after (yellow) standardization for the obstetric comorbidity score among racial-ethnic and socioeconomic subpopulations, California live births, 2011–2017.
Footnotes
Disclosure: The authors do not report any potential conflicts of interest.
References
- 1.Centers for Disease Control and Prevention. Severe maternal morbidity in the United States. Available at: https://www.cdc.gov/reproductivehealth/maternalinfanthealth/severematernalmorbidity.html. Retrieved April 25, 2021.
- 2.National Quality Forum. National Quality Forum Launches New Project to Improve Maternal Morbidity and Mortality Outcomes. Available at: http://www.qualityforum.org/News_And_Resources/Press_Releases/2019/National_Quality_Forum_Launches_New_Project_to_Improve_Maternal_Morbidity_and_Mortality_Outcomes.aspx. Retrieved January 8, 2021.
- 3.Main EK, Cape V, Abreo A, et al. Reduction of severe maternal morbidity from hemorrhage using a state perinatal quality collaborative. American Journal of Obstetrics and Gynecology. 2017;216(3):298.e291–298.e211. [DOI] [PubMed] [Google Scholar]
- 4.Leonard SA, Main EK, Carmichael SL. The contribution of maternal characteristics and cesarean delivery to an increasing trend of severe maternal morbidity. BMC Pregnancy and Childbirth. 2019;19(1):16. [DOI] [PMC free article] [PubMed] [Google Scholar]
- 5.Grobman WA, Bailit JL, Rice MM, et al. Frequency of and Factors Associated With Severe Maternal Morbidity. Obstetrics & Gynecology. 2014;123(4):804–810. [DOI] [PMC free article] [PubMed] [Google Scholar]
- 6.Main EK, Leonard SA, Menard MK. Association of Maternal Comorbidity With Severe Maternal Morbidity: A Cohort Study of California Mothers Delivering Between 1997 and 2014. Annals of Internal Medicine. 2020;173(11_Supplement):S11–S18. [DOI] [PubMed] [Google Scholar]
- 7.Bateman BT, Mhyre JM, Hernandez-Diaz S, et al. Development of a Comorbidity Index for Use in Obstetric Patients. Obstetrics & Gynecology. 2013;122(5):957–965. [DOI] [PMC free article] [PubMed] [Google Scholar]
- 8.Leonard SA, Kennedy CJ, Carmichael SL, Lyell DJ, Main EK. An Expanded Obstetric Comorbidity Scoring System for Predicting Severe Maternal Morbidity. Obstetrics & Gynecology. 2020;136(3):440–449. [DOI] [PMC free article] [PubMed] [Google Scholar]
- 9.Vyas DA, Eisenstein LG, Jones DS. Hidden in Plain Sight — Reconsidering the Use of Race Correction in Clinical Algorithms. New England Journal of Medicine. 2020;383(9):874–882. [DOI] [PubMed] [Google Scholar]
- 10.U.S. Department of Health and Human Services. Healthy Women, Healthy Pregnancies, Healthy Futures: Action Plan to Improve Maternal Health in America. Available at: https://aspe.hhs.gov/system/files/aspe-files/264076/healthy-women-healthy-pregnancies-healthy-future-action-plan_0.pdf. Retrieved February 12, 2021.
- 11.Office of the Surgeon General. The Surgeon General’s Call to Action to Improve Maternal Health. Available at: https://www.hhs.gov/sites/default/files/call-to-action-maternal-health.pdf. Retrieved February 12, 2021.
- 12.Vilda D, Wallace M, Dyer L, Harville E, Theall K. Income inequality and racial disparities in pregnancy-related mortality in the US. SSM - Population Health. 2019;9:100477. [DOI] [PMC free article] [PubMed] [Google Scholar]
- 13.Leonard SA, Main EK, Scott KA, Profit J, Carmichael SL. Racial and ethnic disparities in severe maternal morbidity prevalence and trends. Annals of Epidemiology. 2019;33:30–36. [DOI] [PMC free article] [PubMed] [Google Scholar]
- 14.Chinn JJ, Eisenberg E, Artis Dickerson S, et al. Maternal mortality in the United States: research gaps, opportunities, and priorities. American Journal of Obstetrics and Gynecology. 2020;223(4):486–492.e486. [DOI] [PMC free article] [PubMed] [Google Scholar]
- 15.Alliance for Innovation on Maternal Health. 2021. AIM SMM Codes List. Available at: https://safehealthcareforeverywoman.org/aim/resources/aim-data-resources/. Retrieved October 29, 2021.
- 16.Fingar KR, Hambrick MM, Heslin KC, Moore JE. Trends and disparities in delivery hospitalizations involving severe maternal morbidity, 2006–2015. Rockville (MD): Agency for Healthcare Research and Quality (US); 2018. Sep 04 2018. [PubMed] [Google Scholar]
- 17.Main EK, Abreo A, McNulty J, et al. Measuring severe maternal morbidity: validation of potential measures. Am J Obstet Gynecol. 2016;214(5):643 e641–643 e610. [DOI] [PubMed] [Google Scholar]
- 18.Murugappan G, Alvero RJ, Lyell DJ, Khandelwal A, Leonard SA. Development and validation of a risk prediction index for severe maternal morbidity based on preconception comorbidities among infertile patients. Fertility and Sterility. 2021;116(5):1372–1380. [DOI] [PMC free article] [PubMed] [Google Scholar]
- 19.California Maternal Quality Care Collaborative. Severe Maternal Morbidity: Validated Approach for Comorbidity Risk Adjustment. Available at: https://www.cmqcc.org/research/severe-maternal-morbidity-validated-approach-comorbidity-risk-adjustment. Retrived October 29, 2021.
- 20.Robbins C, Boulet SL, Morgan I, et al. Disparities in Preconception Health Indicators — Behavioral Risk Factor Surveillance System, 2013–2015, and Pregnancy Risk Assessment Monitoring System, 2013–2014. MMWR Surveill Summ. 2018;67(1):1–16. [DOI] [PMC free article] [PubMed] [Google Scholar]
- 21.Saito T, Rehmsmeier M. The precision-recall plot is more informative than the ROC plot when evaluating binary classifiers on imbalanced datasets. PLoS ONE. 2015;10(3). [DOI] [PMC free article] [PubMed] [Google Scholar]
- 22.Alba AC, Agoritsas T, Walsh M, et al. Discrimination and Calibration of Clinical Prediction Models: Users’ Guides to the Medical Literature. JAMA. 2017;318(14):1377–1384. [DOI] [PubMed] [Google Scholar]
- 23.Vinikoor LC, Messer LC, Laraia BA, Kaufman JS. Reliability of variables on the North Carolina birth certificate: a comparison with directly queried values from a cohort study. Paediatric and Perinatal Epidemiology. 2010;24(1):102–112. [DOI] [PMC free article] [PubMed] [Google Scholar]
- 24.Creanga AA, Bateman BT, Kuklina EV, Callaghan WM. Racial and ethnic disparities in severe maternal morbidity: a multistate analysis, 2008–2010. Am J Obstet Gynecol. 2014;210(5):435 e431–438. [DOI] [PubMed] [Google Scholar]
- 25.Crear-Perry J, Correa-de-Araujo R, Lewis Johnson T, McLemore MR, Neilson E, Wallace M. Social and structural determinants of health inequities in maternal health. Journal of Women’s Health. 2020;Epub ahead of print. [DOI] [PMC free article] [PubMed]
- 26.Howell EA, Brown H, Brumley J, et al. Reduction of Peripartum Racial and Ethnic Disparities: A Conceptual Framework and Maternal Safety Consensus Bundle. Obstetrics & Gynecology. 2018;131(5). [DOI] [PubMed] [Google Scholar]
- 27.Rosenthal L, Lobel M. Gendered racism and the sexual and reproductive health of Black and Latina Women. Ethn Health. 2020;25(3):367–392. [DOI] [PubMed] [Google Scholar]
- 28.Geronimus AT. The weathering hypothesis and the health of African-American women and infants: Evidence and speculations. Ethn Dis. 1992;2:207–221. [PubMed] [Google Scholar]
- 29.Argeseanu Cunningham S, Ruben JD, Venkat Narayan KM. Health of foreign-born people in the United States: A review. Health & Place. 2008;14(4):623–635. [DOI] [PubMed] [Google Scholar]
- 30.Singh GK, Yu SM. Adverse pregnancy outcomes: differences between US- and foreign-born women in major US racial and ethnic groups. American Journal of Public Health. 1996;86(6):837–843. [DOI] [PMC free article] [PubMed] [Google Scholar]
- 31.Howell EA, Egorova NN, Janevic T, et al. Race and Ethnicity, Medical Insurance, and Within-Hospital Severe Maternal Morbidity Disparities. Obstetrics & Gynecology. 2020;135(2). [DOI] [PMC free article] [PubMed] [Google Scholar]
- 32.Winkleby MA, Jatulis DE, Frank E, Fortmann SP. Socioeconomic status and health: how education, income, and occupation contribute to risk factors for cardiovascular disease. American Journal of Public Health. 1992;82(6):816–820. [DOI] [PMC free article] [PubMed] [Google Scholar]
- 33.Crenshaw K. Demarginalizing the intersection of race and sex: A Black feminist critique of antidiscrimination doctrine, feminist theory and antiracist politics. University of Chicago Legal Forum. 1989;1(8). [Google Scholar]
- 34.LaVeist T. Disentangling race and socioeconomic status: A key to understanding health inequalities. J Urban Health. 2005;82(3):iii26–iii34. [DOI] [PMC free article] [PubMed] [Google Scholar]
- 35.Lydon-Rochelle MT, Holt VL, Nelson JC, et al. Accuracy of reporting maternal in-hospital diagnoses and intrapartum procedures in Washington State linked birth records. Paediatric and Perinatal Epidemiology. 2005;19(6):460–471. [DOI] [PubMed] [Google Scholar]
- 36.Salemi JL, Hansen MA, Modak S, et al. Estimating the obstetric co-morbidity burden using administrative data: The impact of the pregnancy-related assessment window. Paediatric and Perinatal Epidemiology. 2020;34(4):440–451. [DOI] [PubMed] [Google Scholar]
- 37.Bateman BT, Robinson JN. Getting Risk Prediction Right. Obstetrics & Gynecology. 2020;136(3). [DOI] [PubMed] [Google Scholar]
- 38.Baumeister L, Marchi K, Pearl M, Williams R, Braveman P. The validity of information on “race” and “Hispanic ethnicity” in California birth certificate data. Health Serv Res. 2000;35(4):869–883. [PMC free article] [PubMed] [Google Scholar]
- 39.Braveman P, Pearl M, Egerter S, Marchi K, Williams R. Validity of insurance information on California birth certificates. Am J Public Health. 1998;88(5):813–816. [DOI] [PMC free article] [PubMed] [Google Scholar]
- 40.Easter SR, Robinson JN, Menard MK, et al. Potential Effects of Regionalized Maternity Care on U.S. Hospitals. Obstetrics & Gynecology. 2019;134(3). [DOI] [PubMed] [Google Scholar]
- 41.Wagner TH, Gehlert E, Rosen A, Valenstein M. Updating the Psychiatric Case Mix System (PsyCMS) Mental Health and Substance Use Grouper for ICD-10-CM. Menlo Park, CA: VA Palo Alto, Health Economics Resource Center;2016. [Google Scholar]
- 42.Creanga AA, Bateman BT, Butwick AJ, et al. Morbidity associated with cesarean delivery in the United States: is placenta accreta an increasingly important contributor? American Journal of Obstetrics & Gynecology. 2015;213(3):384.e381–384.e311. [DOI] [PubMed] [Google Scholar]


