Abstract
Background and purpose:
Meningeal lymphatic vessels (MLVs) along the dural venous sinuses are suspected to be important in connecting the glymphatic and peripheral lymphatic system. Understanding the topography of MLVs may clarify the role of the glymphatic system in neurological diseases. The aim of this analysis was to use high resolution pre- and post-contrast FLAIR 7T MRI to identify and characterize the morphology of MLV in a cohort of healthy volunteers.
Materials and methods:
MRI examinations of seventeen healthy volunteers enrolled as controls in a larger 7T MRI study were reviewed. Pre- and post-contrast 3-D FLAIR subtractions and MP2RAGE sequences were spatially normalized and reviewed for signal intensity and enhancement patterns within putative MLVs along pre-determined dural and venous structures. Frequency of occurrence of MLVs at the above-described locations and patterns of their enhancement were analyzed.
Results:
Putative MLVs are commonly located along the superior sagittal sinus (SSS) and cortical veins. A “fixed enhancement” signal pattern was more frequent at these locations (p<.05). The morphology of MLVs along the SSS qualitatively changes in an antero-posterior direction. Lack of signal was more frequent along the straight and transverse sinuses (p<.05).
Conclusion:
Putative MLVs in healthy individuals are concentrated along the SSS and cortical veins. FLAIR signal and enhancement characteristics suggest these structures may transport proteinaceous fluid. Pathways connecting MLVs to cervical lymph nodes however remain unclear.
Introduction
The identification of a functional lymphatic system in the human central nervous system has challenged the historic tenet of an immune privileged CNS 1. Recent studies suggest a complex paravascular system termed the “glymphatic” system comprised of peri-vascular and interstitial spaces in the brain parenchyma for waste clearance 2. Influx of cerebrospinal fluid (CSF) into the brain interstitium occurs along penetrating arteries and efflux of CSF, immune cells and macromolecules are routed to cervical neck lymph nodes; however, the precise pathways through which this is accomplished are yet to be fully understood. Meningeal lymphatics along the dural venous sinuses are suspected to be important in connecting the glymphatic system to the peripheral lymphatic system3. On histopathology, vessels expressing lymphatic markers are found lining the dural venous sinuses3,4. These vessels may regulate fluid transport and immunosurveillance, and may also have CNS-specific functions such as regulating neuroinflammation and neurodegeneration5,6. Impaired or disrupted lymphatics may contribute to the accumulation of protein aggregates that result in dementia 7 or the sequelae of traumatic brain injury8. Additionally, lymphatics may play a role in immune surveillance and could be a therapeutic target for inflammatory conditions such as multiple sclerosis9. Mapping the topography of meningeal lymphatic vessels (MLV) in the healthy population may contribute to clarifying the role of the glymphatic system in neurological diseases.
Structures corresponding to MLVs have recently been identified noninvasively using contrast enhanced 3T MRI, albeit in a small group of healthy volunteers10. The topography of these MLV is as yet not completely understood but may be concentrated around major venous channels such as the superior sagittal sinus (SSS) and straight sinus10. MR imaging at 7T may be a more sensitive method of mapping MLV, in light of prior multiple sclerosis studies which found that 7T MRI better identified patterns of enhancement along cortical venous walls11–14, perhaps reflecting MLV15. The aim of this analysis was to use high resolution pre- and post-contrast FLAIR (Fluid Attenuation Inversion Recovery) 7T MR imaging to identify and characterize the morphology of and distribution of MLV in a cohort of healthy volunteers. FLAIR imaging is preferred as dural enhancement on post-contrast T1 weighted sequences may obscure adjacent lymphatics. We hypothesize that MLV will follow the course of cerebral venous structures, and cranial nerve sheaths. Additionally, as the protein content of lymphatic fluid is relatively high and flow may be slow16, MLV may also be identifiable on both pre- and post-contrast FLAIR MRI, 17 but will enhance further and be more apparent with gadolinium due to glymphatic and paravascular clearance18. As this study does not include histopathologic analysis, we will refer to structures identified on MR imaging as putative meningeal lymphatic vessels (PMLVs).
Methods
This retrospective study was approved by the institutional review boards at the University of Maryland, Baltimore and Johns Hopkins University. MR imaging of healthy volunteers, who were enrolled as control subjects in a larger prospective multiple sclerosis 7T MRI study, were retrospectively reviewed. Subjects underwent a full informed consent process and consent documents were signed. Study visits and imaging acquisition occurred between September 2019 and February 2020.
MRI acquisition
Participants underwent MRI of the brain in a Philips Achieva 7T scanner (Philips Healthcare, Best, Netherlands), which was equipped with a multi-transmit MTX8 and 32-channel receive head coil (Nova Medical, Wilmington, MA, USA). To improve signal homogeneity, dielectric padding was used. We obtained a whole brain 3-D FLAIR sequence (pre-FLAIR) at 0.500 × 0.488 × 0.488 mm3 resolution. Imaging parameters were as follows: relaxation time (TR) = 8,000 ms; inversion time (TI) = 2,200 ms; echo time (TE) = 300 ms; SENSE factor = 2.5 × 3.0; flip angle = 70 degrees; 9 min 4 sec duration. We acquired post-contrast FLAIR images immediately and 23 minutes (referred to as post-FLAIR-1 and post-FLAIR-2, respectively) after administration of the gadolinium-based contrast agent (0.1 mmol/kg ProHance, Bracco Diagnostics, Princeton, New Jersey). A whole brain non-contrast 3-D multi-shot fast-field-echo MP2RAGE was acquired also at 0.700 × 0.688 × 0.688 mm3 resolution19. Imaging parameters were: MP2RAGE TR = 8,250 ms; TR = 6.9 ms; TI1 = 1,000 ms; TI2 = 3,300 ms; TE = 1.97 ms; SENSE factor = 2 × 2; flip angle 1 = 5 degrees; flip angle 2 = 5 degrees; 9 min 37 sec duration.
Image processing
Pre-processing
We processed each MP2RAGE image as per Marques et al.19 to create a T1 weighted (T1-w) image using custom software written in Matlab (Mathworks, Inc., Natick, MA), based on publicly available code provided by the developers of the MP2RAGE sequence (https://github.com/JosePMarques/MP2RAGE-related-scripts). MP2RAGE T1-w images were denoised by suppressing the background noise, as previously described 20. All FLAIR images were corrected for bias fields 21.
Spatial normalization
MP2RAGE T1-w images were non-linearly coregistered to a standard space (i.e., MNI 152 T1 space of 0.5 mm3 resolution) using ANTs (advanced normalization tools, https://github.com/ANTsX/ANTs), and this transformation matrix was saved 22. FLAIR images were coregistered to the MP2RAGE T1-w image of the same participant first. The previously saved transformation matrix was then applied to coregister the FLAIR images to the standard space.
Post-processing
An individual gray-and-white-matter mask (GM-WM mask) was created for each participant using Atropos multi-tissue segmentation to combine gray and white matter labels 23. GM-WM masks were used to normalize FLAIR image intensity to compare pre- and post-contrast signal intensities objectively. FLAIR images were normalized to the mean signal intensity of their own GM-WM region. Then, two images between intensity-normalized pre- and post-contrast were created by subtracting pre- and post-FLAIR images: dFLAIR-1 (= post-FLAIR-1 - pre-FLAIR) and dFLAIR-2 (= post-FLAIR-2 - pre-FLAIR).
Group mean masks for dFLAIR-2 were created by averaging each image across all subjects. A group standard deviation (SD) map was created for normalized dFLAIR-2 images by calculating the voxel-wise SD value across all subjects. A map specific threshold was manually defined for each mean or SD map to best exclude voxels and artifacts that are unlikely to belong to the lymphatic system. The above processes were performed using AFNI (Analysis of Functional NeuroImages, https://afni.nimh.nih.gov/) 24,25.
Image Evaluation
MP2RAGE T1-w, pre-contrast FLAIR, as well as subtraction post-contrast FLAIR images were manipulated using Medical Image Processing, Analysis, and Visualization (Version 10.0.0; http://mipav.cit.nih.gov) software. Images were reviewed by two independent readers (a post graduate year four radiology resident, and a board certified neuroradiologist of 15 years experience). Morphological evaluation of putative meningeal lymphatic vessels (PMLV) was completed by evaluating images for the presence of hyperintense foci on pre- or post-contrast FLAIR, located adjacent to but distinctly separable from a cerebral venous structure or in a cranial nerve foramen. The independent readers were directed to evaluate the following structures: SSS, cortical veins, torcula, straight sinus, vein of Galen, internal cerebral veins, transverse sinus, and Meckel’s cave/foramen ovale. Localization of the hyperintensity as separate from vascular structures was confirmed on anatomic T1-w MP2RAGE images. Enhancement characteristics of these structures were evaluated with consensus review between the two readers by comparing pre-contrast FLAIR and the two post-contrast FLAIR subtraction sequences (dFLAIR-1 and dFLAIR-2). Enhancement pattern categories were not pre-specified.
Descriptive statistics were used to calculate the frequency of subjects in whom PMLVs at the above-described locations were identified and characterized. Two-sided chi-squared tests were performed comparing frequencies of the observed signal patterns between different PMLV locations, with a significance level of p=.05.
Results
MR examinations of the brain of seventeen healthy volunteers were reviewed. Two examinations were excluded from analysis due to wrap around artifact. The remaining examinations (n=15) were of healthy volunteers with median age 36 (range 24–64). 6 (40%) volunteers were male and 9 (60%) were female.
Six types of FLAIR signal characteristic patterns were observed across the PMLVs. The fixed enhancement pattern reflects the presence of hyperintense foci on pre-contrast FLAIR with contrast enhancement on both subtraction sequences. The early enhancement and late enhancement patterns reflect hyperintense foci initially visible on pre-contrast FLAIR, but with additional contrast enhancement on only the dFLAIR-1 or dFLAIR-2 sequences, respectively. The pre-only pattern reflects hyperintense signal that was identified only on the pre-contrast FLAIR images without post-contrast enhancement. The post-only pattern indicates foci only identified on post-contrast subtraction sequences without a pre-contrast FLAIR hyperintense correlate. No signal reflects absence of a PMLV, without a hyperintense foci on either pre- or post- contrast FLAIR sequences. A histogram of the distribution of signal patterns across PMLVs adjacent to the prescribed venous anatomic structures is shown in Figure 1, and examples of signal patterns are presented in Figure 2. Of the 225 observations made across the 15 locations and 15 subjects, the fixed enhancement pattern was observed most frequently (n=106, 47.1%), followed by no signal (n=77, 34.2%). Frequencies of the six signal types were statistically different per Chi-square test (p<.001).
Figure 1.
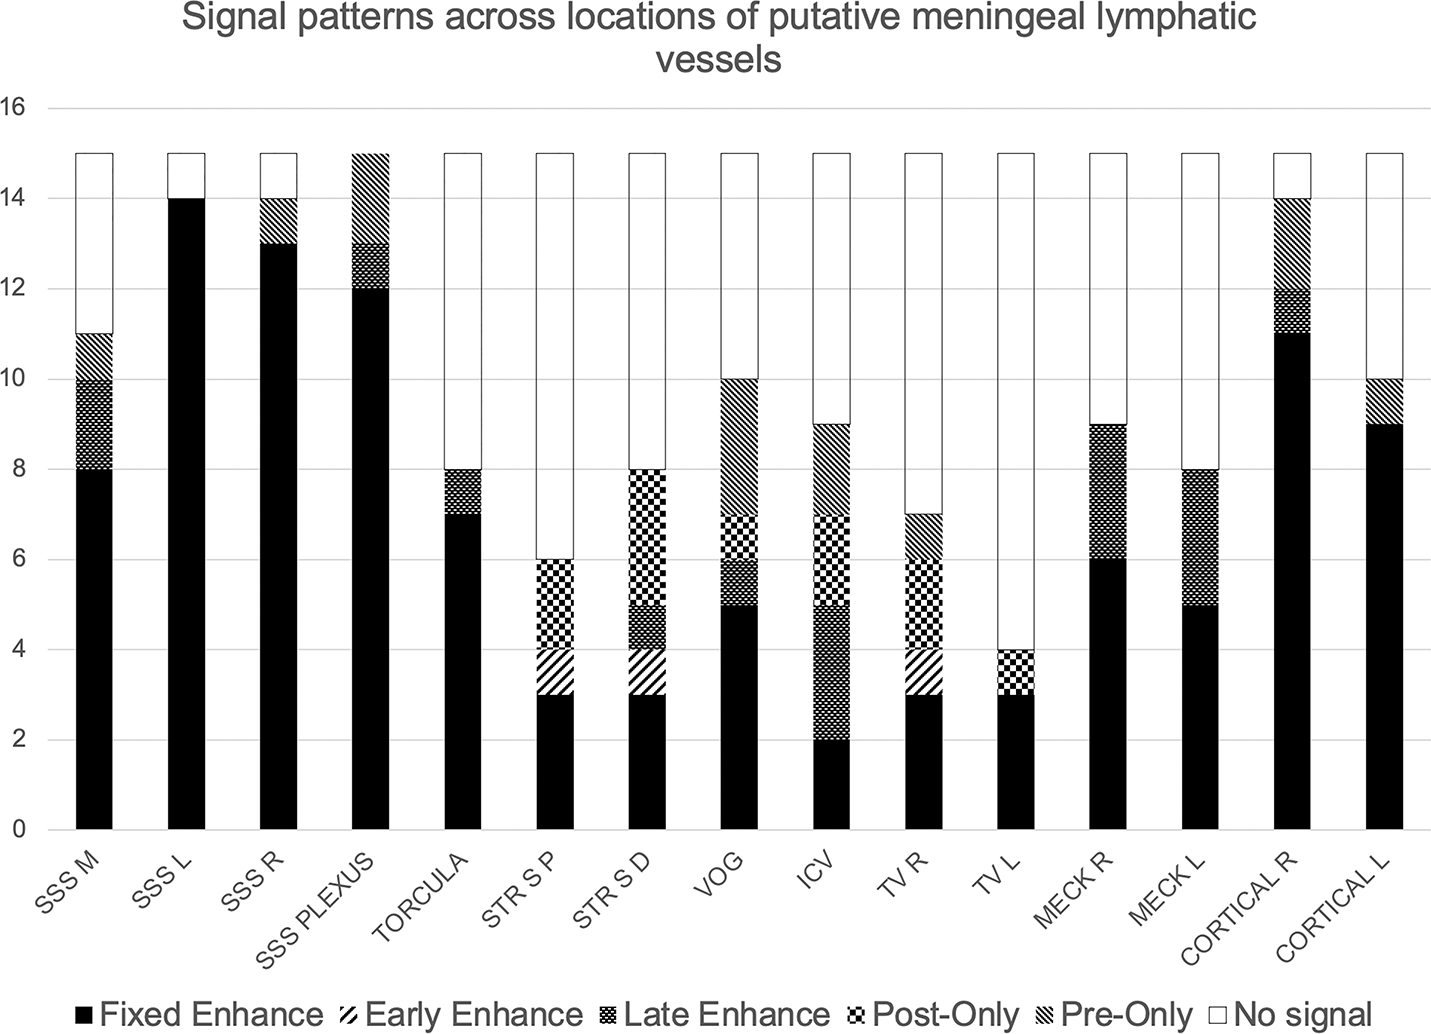
Histogram of signal patterns across locations of PMLVs. Maximum value for each location is n=15. SSS M, L, R = Superior sagittal sinus median, left, and right, respectively. SSS Plexus = Superior sagittal sinus plexus. STR S P, D = straight sinus proximal and distal. VOG = vein of Galen. ICV = internal cerebral veins. TV R, L - transverse sinus right and left. MECK R, L = Meckel’s cave right and left. Cortical R, L = cortical vein right and left.
Figure 2.
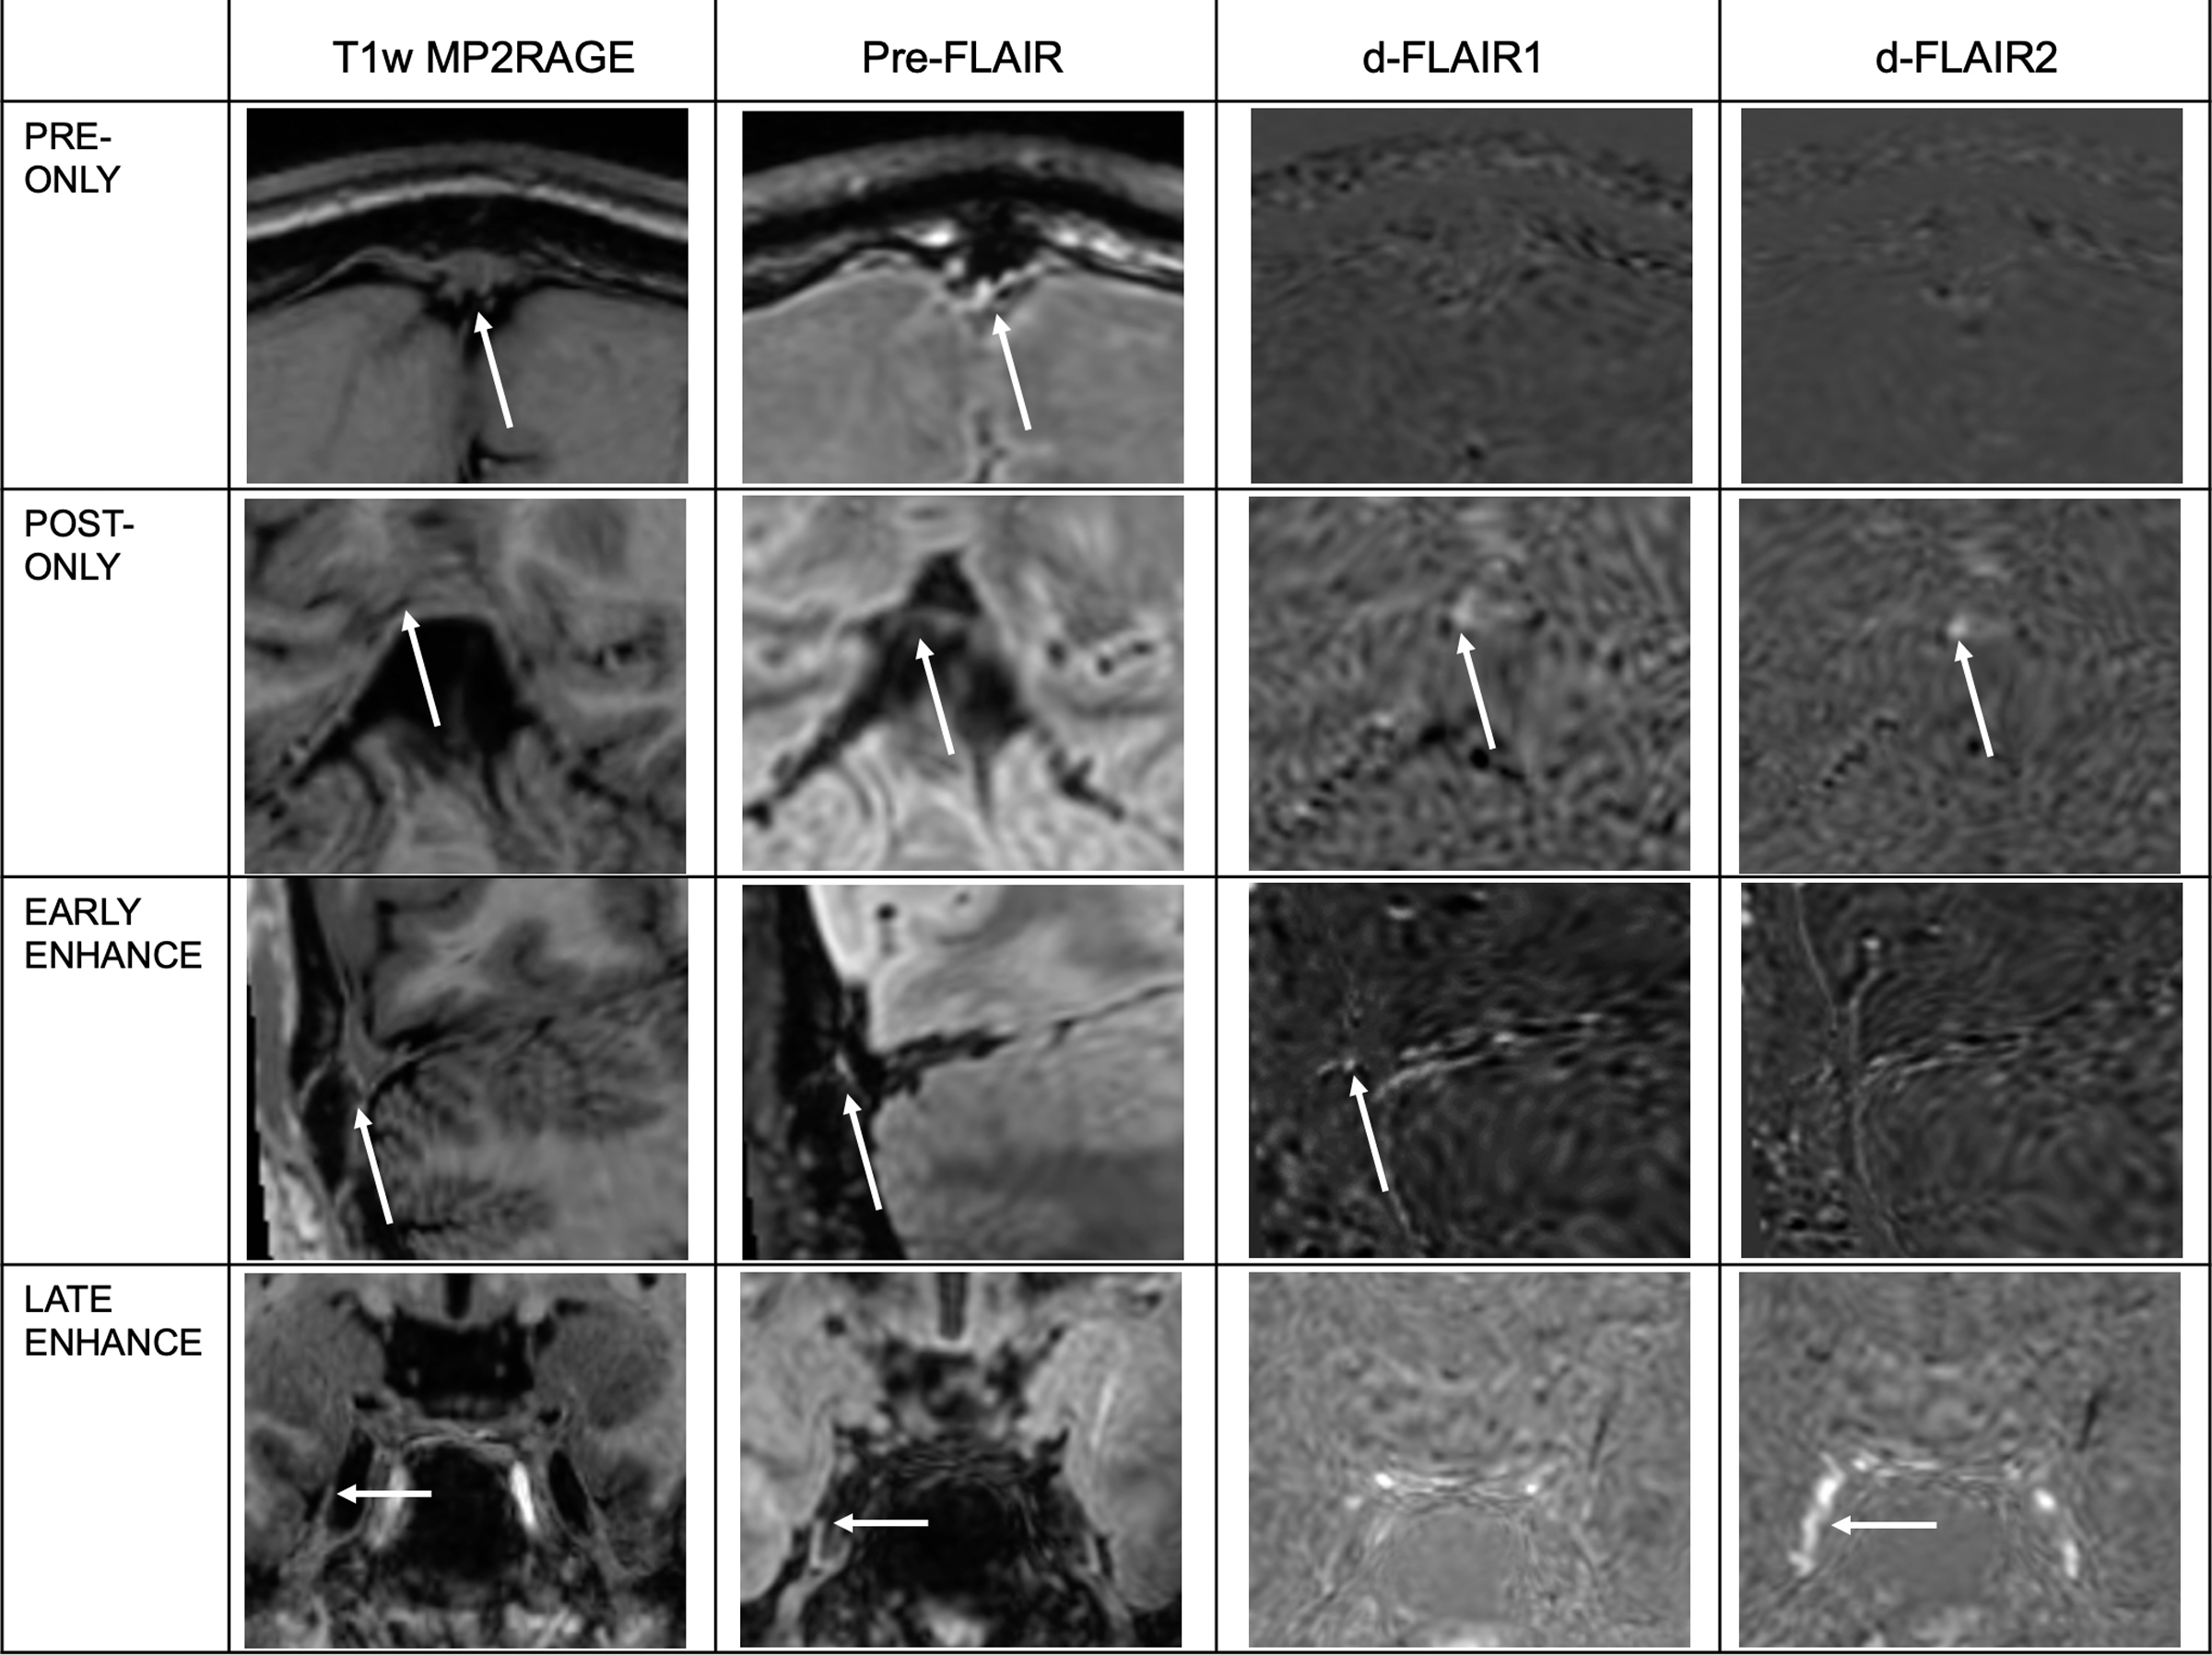
Examples of observed FLAIR signal characteristics at PMLVs. White arrows denote the location of signal intensity on the Pre-contrast FLAIR sequence (second column), located adjacent to venous structures, or within CSF containing spaces, when localized on the anatomic T1w MP2RAGE sequence (first column). White arrows on subtraction images (d-FLAIR 1 and d-FLAIR2) denote where gadolinium accumulation signal is present. Pre-only, post-only, early and late enhancement signal patterns are illustrated. Fixed enhancement signal pattern is illustrated across various examples in Figure 3. No signal pattern is not shown.
Signal was also identified in a high number of subjects adjacent to the posterior SSS (n=15, 100%), anterior SSS (n=14, 93.3%), and cortical veins at the vertex (n=14, 93.3%). Coregistration with anatomic T1-w MP2RAGE sequences confirmed that FLAIR hyperintense signal was present adjacent to, but not within, the T1 isointense venous structures, and that the PMLVs generally were T1 iso/hypointense (Figures 2,3).
Figure 3.
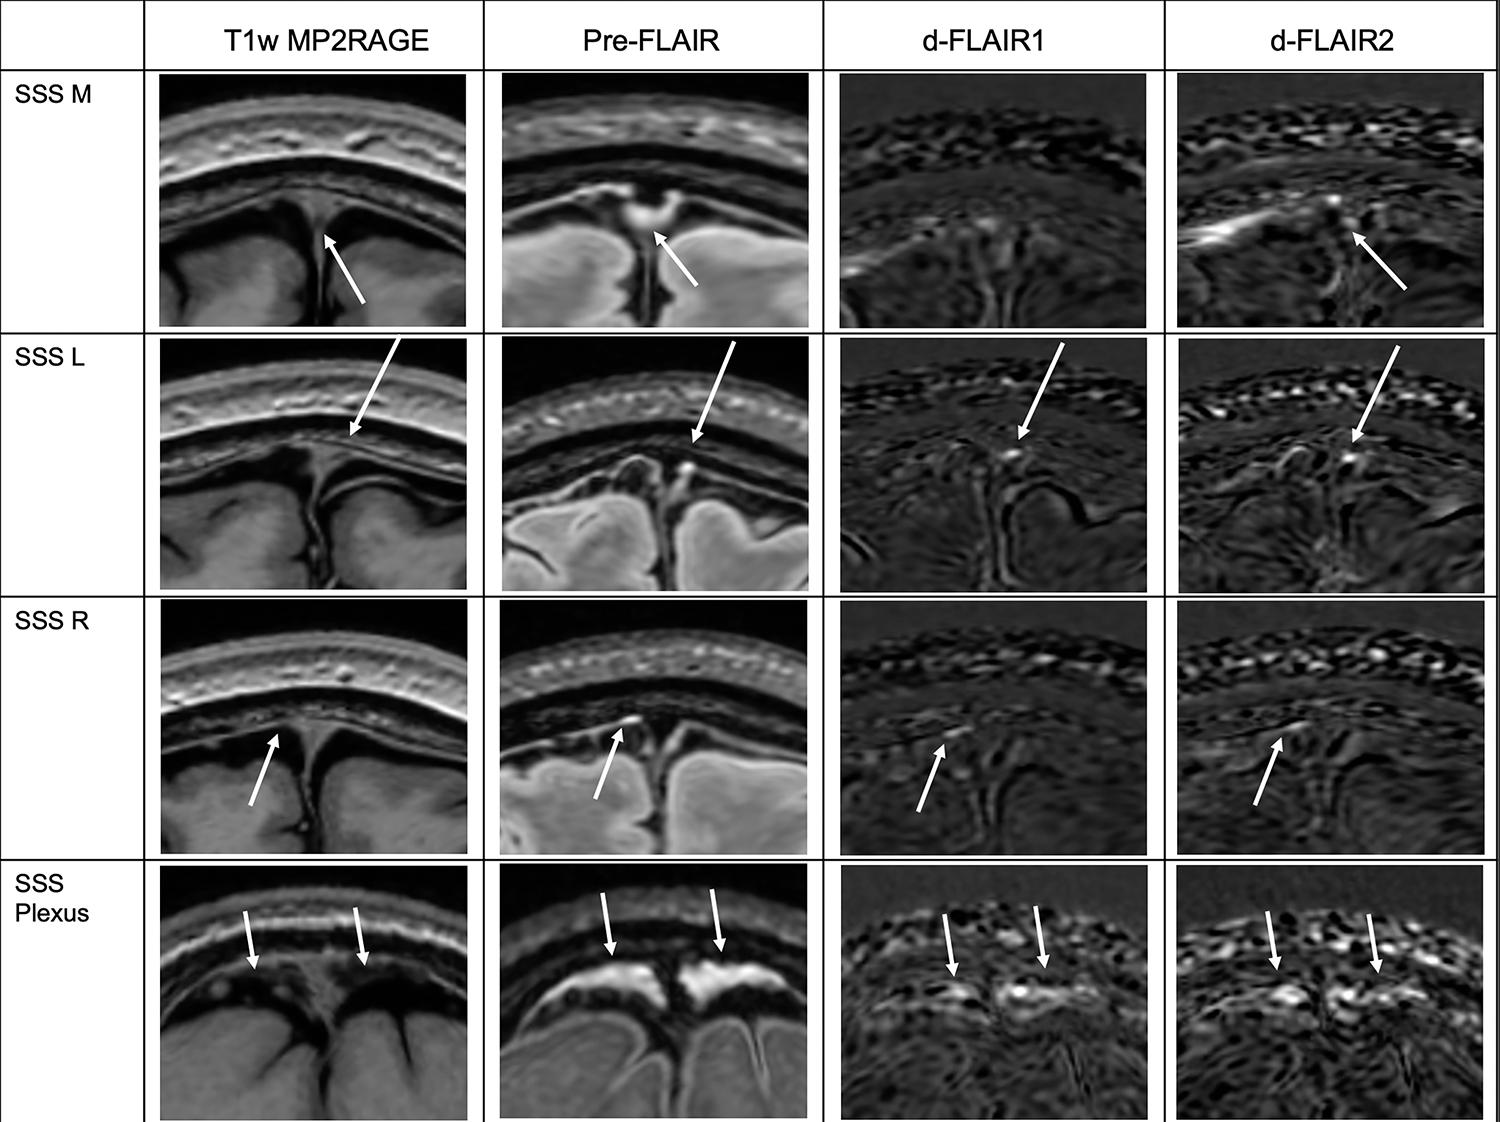
PMLVs along the SSS. White arrows denote the location of signal intensity on the Pre-contrast FLAIR sequence (second column), located adjacent to the SSS when localized on the anatomic T1w MP2RAGE sequence (first column). White arrows on subtraction images (d-FLAIR 1 and d-FLAIR2) denote where gadolinium accumulation signal is present. SSS M, L, R are along the sinus anterior to the coronal suture. SSS Plexus is along the sinus posteriorly. The fixed enhancement signal pattern is illustrated at SSS L, SSS R, and SSS Plexus. SSS M, L, R = Superior sagittal sinus median, left, and right, respectively. SSS Plexus = Superior sagittal sinus plexus.
Frequencies of the observed signal patterns varied based on location. The fixed enhancement pattern was statistically more frequent along the SSS and cortical veins compared to other locations (p<.05). Significance values of chi-square comparisons across locations of the fixed enhancement pattern, no signal pattern, and other signal patterns (combined frequencies of early-enhancement, late-enhancement, pre-only, and post-only patterns) are presented in Supplemental Table 1.
“No signal” meaning absence of PMLVs was more frequently observed in subjects along the straight sinus (n=9, 60%) and transverse sinuses (n=11, 73.3%) (p<.05). At other locations, there was no significant difference in the frequencies of signal patterns. Signal was variably identified in subjects adjacent to the venous structures that drain into the straight sinus, including the internal cerebral veins (n=8, 53.3%) and vein of Galen (n=10, 66.7%). Inferiorly, signal was variably identified adjacent to the torcula (n=8, 53.3%) and in Meckel’s cave and foramen ovale (right n=9, 60% and left n=8, 53.3%).
Examples of PMLV morphology along the SSS are shown in Figure 3. Anterior to the coronal suture, three well defined tubular channels were present in relation to the SSS: right lateral (n=14, 93.3%), left lateral (n=14, 93.3%), and inferior median (n=11, 73.3%), with a predominantly fixed enhancement signal pattern. Posteriorly, the morphology was plexiform (n=15, 100%) with large areas of pre-contrast FLAIR hyperintensity and smaller areas of subsequent contrast enhancement within the plexus.
Supplement Figure 1 depicts examples of PMLVs along other smaller venous structures. Both group mean and standard deviation maps of dFLAIR-2 sequences are shown in Figure 4, in order to illustrate where gadolinium accumulation in PMLVs was common, and most variable, across the cohort.
Figure 4.
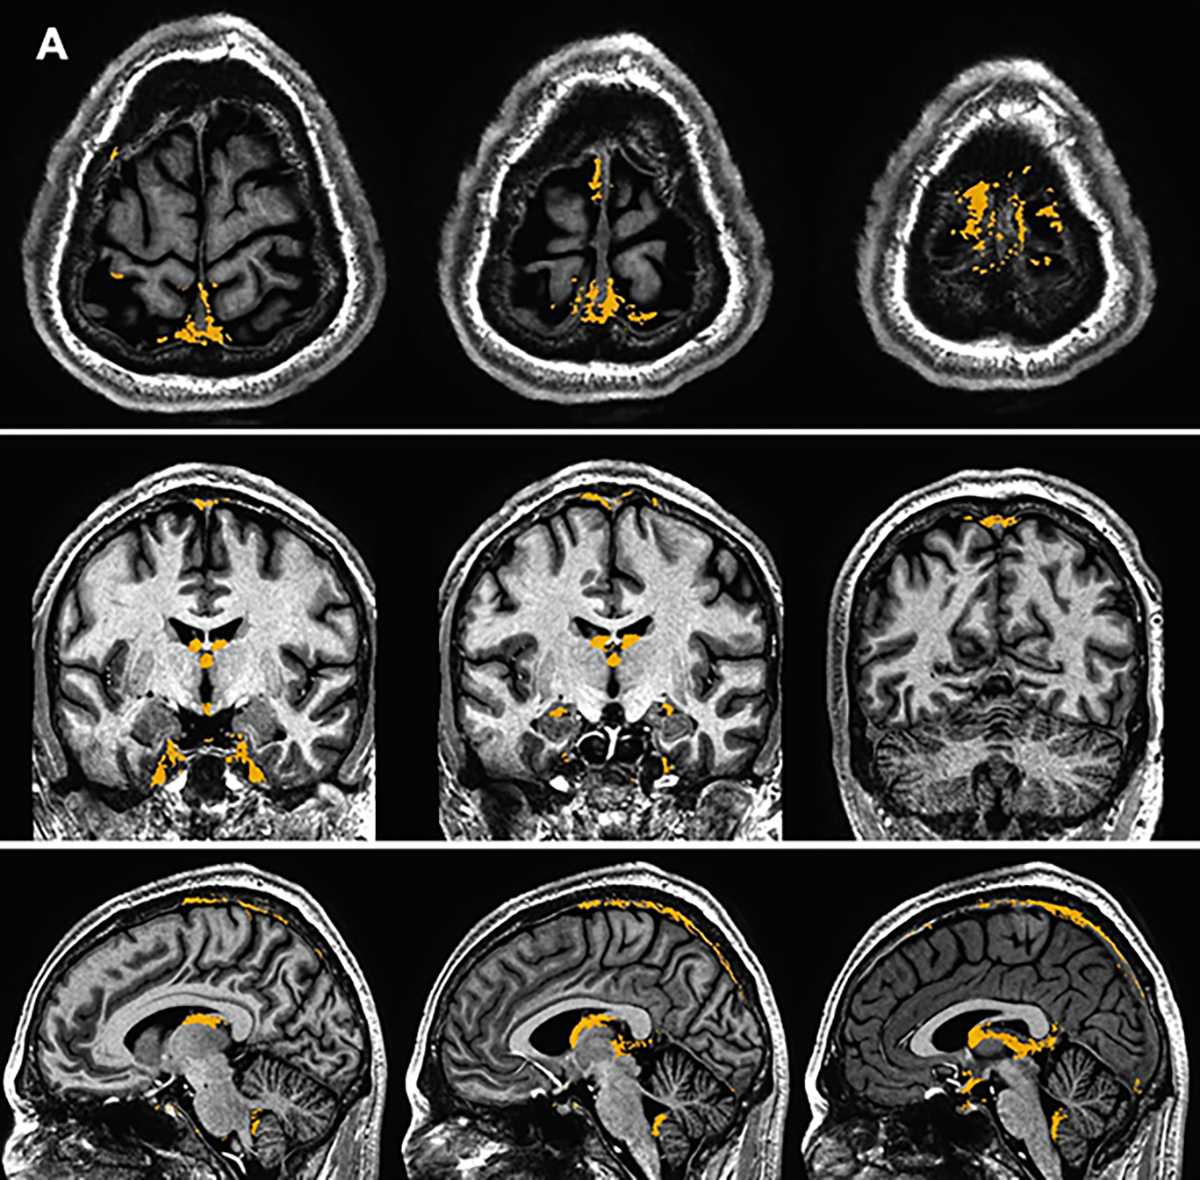
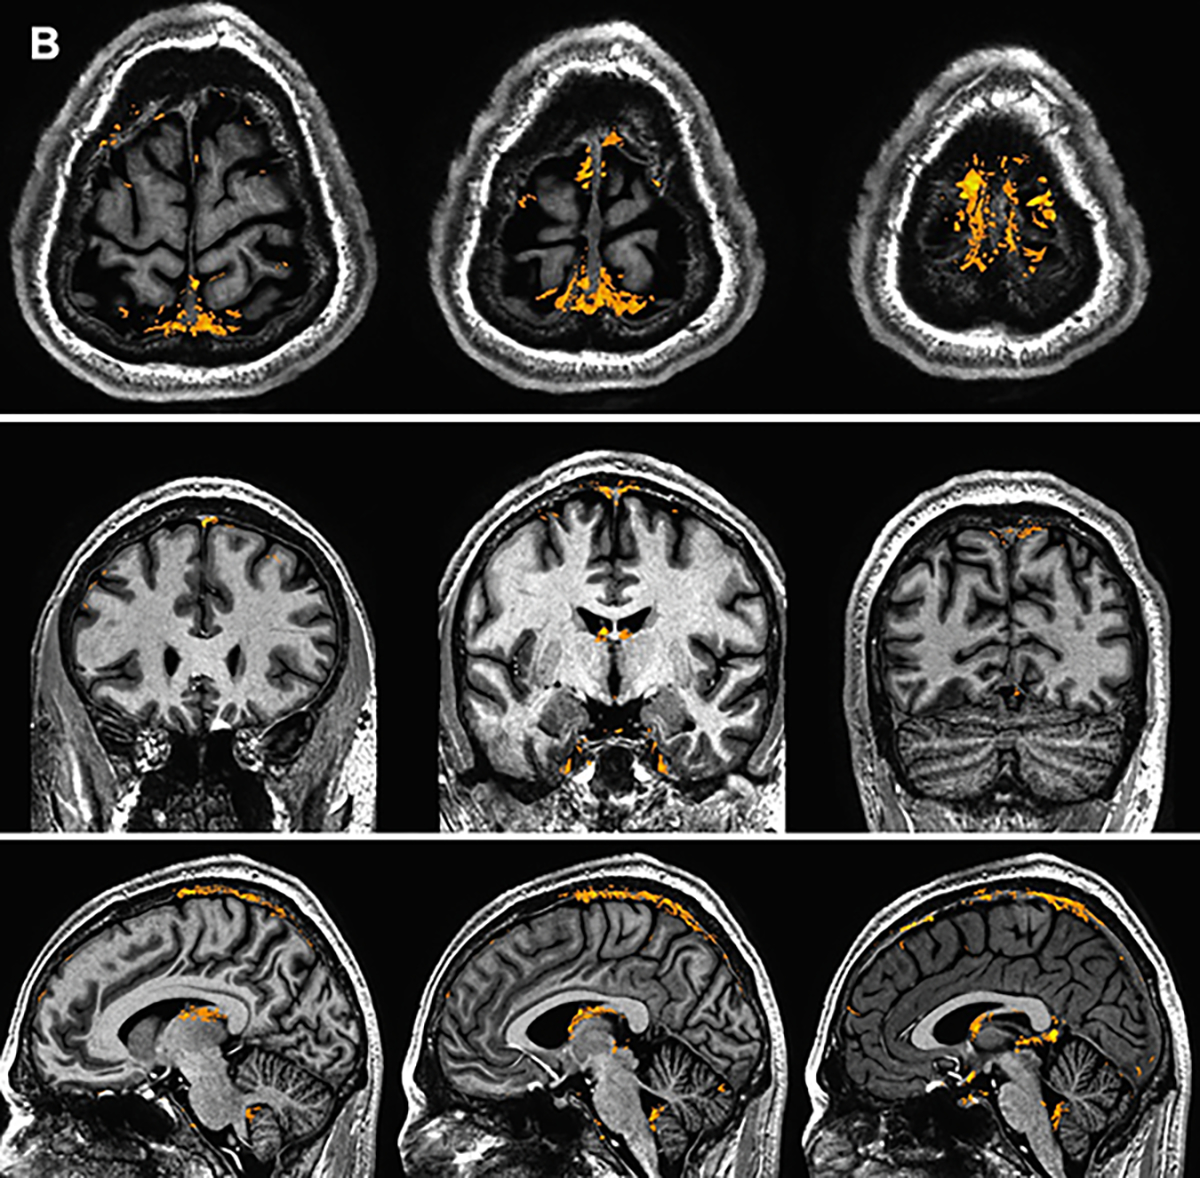
Group mean (A) and standard deviation (B) maps generated from d-FLAIR2 sequence data in the coronal, axial, and sagittal planes. Mask signal (yellow) is overlayed on a T1w MP2RAGE sequence normalized to a standard space.
Discussion
We identified a consistent pattern of distribution of PMLVs along the dural venous sinuses on pre- and post-contrast 7T FLAIR MRI in a cohort of healthy volunteers. In our study, PMLVs were present along dural venous sinuses, cortical and cerebral veins, and at foramen ovale. These locations match that of the recently reported meningeal lymphatic system, visualized on histopathology independently by Loveau 4 and Aspelund 3 and via contrast enhanced MRI by Absinta 10. Histopathological analysis from these works show that lymphatic vessels were most dense around venous sinuses and in the meningeal dural layer. Using FLAIR and two post-contrast sequence 7T acquisitions, multiple signal contrast enhancement patterns of PMLVs were described in this study. These included intrinsic pre-contrast FLAIR hyperintensity of structures, which may reflect proteinaceous fluid and slow flow within meningeal lymphatics relative to that of the venous blood pool. As the PMLVs in this study were generally not T1 hyperintense, perhaps 7T FLAIR imaging is more sensitive to lower protein concentrations. The contents of CNS lymphatic fluid may be comprised of protein aggregates and metabolic waste products such as beta-amyloid, tau protein, alpha-synuclein, and lactate7,26,27.
Fixed enhancement on both post-contrast subtraction sequences was most frequently and consistently observed along the SSS and cortical veins, suggesting early and continued accumulation of gadolinium within PMLVs predominantly over the cerebral convexity. The theorized mechanism of gadolinium transit from intravascular injection to the PMLVs is influx into CSF via leakage at choroid plexus capillaries, then flow along the interstitial space perivascular glymphatics, with efflux into meningeal perivenous spaces26,28–30. Gadolinium accumulation across the two post contrast time points in this study captures the efflux stage of this theorized mechanism. Based on the time points in this study, we theorize that this efflux and accumulation of gadolinium into PMLVs occurs shortly after and throughout 23 minutes from gadolinium injection. Observations from this study may also suggest variations in flow rates such as relatively delayed efflux into PMLVs (the late-enhancement observation) or efflux and subsequent washout of gadolinium from the PMLV within 23 minutes (the early-enhancement observation). Some of these proposed flow patterns are similar to dynamic imaging done by Filippopulos et al31. Ultimately, gadolinium efflux and accumulation within PMLVs may exit the central nervous system glymphatic system by draining through the skull base into cervical neck lymph nodes of the peripheral lymphatic system.
Lymphatic morphology along the SSS, has not previously been fully characterized. Our data demonstrates a difference in the morphology of PMLVs around the SSS, in an anterior-posterior direction. This was present across the majority of the cohort, highlighted in the generated mean study population maps. Anteriorly, well defined median, left lateral, and right lateral channels are identified. Posteriorly, in contrast, signal is more confluent and visually larger in volume, with a plexiform structure surrounding the sinus. This anterior to posterior morphology may suggest that the CNS lymphatic flow vector parallels the antero-posterior flow of the venous sinus, especially when combined with the observation of gadolinium accumulation in these vessels across two time points. This however differs from time of flight MR angiography data that suggest flow is countercurrent to the SSS32. The presence of lymphatics along surface cortical veins may support a parallel flow theory, as MLV would need to be larger and more confluent posteriorly to accept lymphatic waste from tributaries along the cortical veins which increase in the anterior-posterior direction.
Registration and spatial normalization of imaging across this cohort allowed for group mapping of mean signal, demonstrating commonality in the anatomic distribution of PMLVs. In particular, PMLVs are concentrated along the cerebral convexity parallel to the SSS. We expand on prior works which generated topography maps of dural lymphatics in smaller cohorts, and described intense signal along the SSS 10. These locations are also highlighted on group standard deviation maps, suggesting that the amount of gadolinium accumulation within these common structures can vary between individuals. Varied gadolinium accumulation may suggest a complex network of enhancing and non-enhancing structures adjacent to the SSS, including lymphatic vessels, arachnoid granulations, and venous lacunes/pouches 30. Our findings provide a basis, albeit based on a relatively small cohort, for the distribution and variance of PMLVs in healthy individuals. A reference of normal dural lymphatic anatomy derivated from a larger cohort would be important to compare and study how alterations in structure or flow of lymphatic structures may be implicated in neurodegenerative or inflammatory disease states. Recent mouse models have shown impaired lymphatic drainage and morphological changes in MLV after traumatic brain injury33.
A lack of signal along the straight sinus and transverse sinuses was statistically more frequent than the fixed enhancement or other signal patterns. Additionally, signal intensity along the internal cerebral veins and the vein of Galen were identified in some individuals, but these areas are not highlighted on the group mean maps. These observations suggest that PMLVs are either unlikely to exist along these segments of the dural and cerebral venous system, or that the anatomic distribution is variable across the general population. Without identifying common lymphatic structures at deep cerebral veins and the more caudal dural sinuses, it remains unclear if and how a posterior efflux pathway connects meningeal lymphatic vessels to extracranial lymph nodes.
We acknowledge several limitations. Artifacts from air-filled paranasal sinuses and mastoid air cells precluded evaluation of parts of the anterior cranial fossa, skull base and sigmoid sinus areas. Prior studies have also described the presence of these along the olfactory nerves. Susceptibility artifact inherent to 7T precluded evaluation of these. Identifying PMLVs at these areas would be important in understanding how the dural lymphatic system eventually drains into cervical nodes. Additionally, the imaging techniques used in this study cannot confirm that the identified PMLVs are exclusively lymphatic vessels. For example, signal along the posterior SSS may in part reflect slow venous flow within dural venous channels and lakes, as angiography data has recently suggested the existence of complex dural venous structures along sinus tributaries 34,35. It is likely that complex relationships between dural venous channels, lymphatic vessels, and dural venous sinuses exist that are not fully understood. However, given the similar locations of PMLVs between our study and previous works, we believe the structures along the SSS and cortical veins to contain lymphatic vessels. The smaller structures along internal cerebral veins and transverse sinuses; however, cannot be confidently attributed to dural lymphatics.
In conclusion, our findings expand the basis for understanding the distribution and signal characteristics of PMLVs in a healthy population. MLVs are commonly located along the SSS and cortical veins. Further characterization of efflux pathways that connect these structures to the extracranial lymphatic system is needed. These pathways could play a substantial role in the clearance of protein aggregates and alterations in lymphatic pathways may underlie various inflammatory and degenerative diseases of the central nervous system.
Supplementary Material
Supplement Figure 1. PMLVs adjacent to other venous structures. White arrows denote the location of signal intensity on the Pre-contrast FLAIR sequence (second column), located adjacent to venous structures when localized on the anatomic T1w MP2RAGE sequence (first column). White arrows on subtraction images (d-FLAIR 1 and d-FLAIR2) denote where gadolinium accumulation signal is present. TV = transverse sinus. ICV = Internal cerebral veins.
Acknowledgements
We thank the staff of the F.M. Kirby Research Center at the Kennedy Krieger Institute, Baltimore, Maryland, USA for their assistance with MRI acquisition, including Dr. Peter van Zijl, Dr. Xu Li, Terri Brawner, Ivana Kusevic, and Kathleen Kahl. We also thank our research coordinators and nurses, Kerry Naunton, Christina Kingsley, and Christina Spadafora, for their work on this study.
Grant Support:
This study was funded by NIH grant 1R01NS104403-01.
Abbreviations
- MLV
Meningeal lymphatic vessel
- PMLV
Putative meningeal lymphatic vessel
- SSS
Superior Sagittal Sinus
- CSF
Cerebrospinal fluid
Footnotes
Disclosures: Dr. Harrison has received consulting fees from Genentech, Biogen, and Horizon Therapeutics. Dr. Harrison has received writing fees from the American College of Physicians and royalties from Up To Date, Inc. Dr. Harrison has received research funding from Roche-Genentech.
Presentation in part or whole at any meeting: None
References
- 1.Iliff JJ, Wang M, Liao Y, et al. A paravascular pathway facilitates CSF flow through the brain parenchyma and the clearance of interstitial solutes, including amyloid β. Sci Transl Med. Aug 2012;4(147):147ra111. doi: 10.1126/scitranslmed.3003748 [DOI] [PMC free article] [PubMed] [Google Scholar]
- 2.Louveau A, Plog BA, Antila S, Alitalo K, Nedergaard M, Kipnis J. Understanding the functions and relationships of the glymphatic system and meningeal lymphatics. J Clin Invest. Sep 2017;127(9):3210–3219. doi: 10.1172/JCI90603 [DOI] [PMC free article] [PubMed] [Google Scholar]
- 3.Aspelund A, Antila S, Proulx ST, et al. A dural lymphatic vascular system that drains brain interstitial fluid and macromolecules. J Exp Med. Jun 2015;212(7):991–9. doi: 10.1084/jem.20142290 [DOI] [PMC free article] [PubMed] [Google Scholar]
- 4.Louveau A, Smirnov I, Keyes TJ, et al. Structural and functional features of central nervous system lymphatic vessels. Nature. Jul 2015;523(7560):337–41. doi: 10.1038/nature14432 [DOI] [PMC free article] [PubMed] [Google Scholar]
- 5.Petrova TV, Koh GY. Organ-specific lymphatic vasculature: From development to pathophysiology. J Exp Med. 01 February 2018;215(1):35–49. doi: 10.1084/jem.20171868 [DOI] [PMC free article] [PubMed] [Google Scholar]
- 6.Petrova TV, Koh GY. Biological functions of lymphatic vessels. Science. 07 October 2020;369(6500)doi: 10.1126/science.aax4063 [DOI] [PubMed] [Google Scholar]
- 7.Nedergaard M, Goldman SA. Glymphatic failure as a final common pathway to dementia. Science. October 2020;370(6512):50–56. doi: 10.1126/science.abb8739 [DOI] [PMC free article] [PubMed] [Google Scholar]
- 8.Bolte AC, Dutta AB, Hurt ME, et al. Meningeal lymphatic dysfunction exacerbates traumatic brain injury pathogenesis. Nat Commun. September 2020;11(1):4524. doi: 10.1038/s41467-020-18113-4 [DOI] [PMC free article] [PubMed] [Google Scholar]
- 9.Louveau A, Herz J, Alme MN, et al. CNS lymphatic drainage and neuroinflammation are regulated by meningeal lymphatic vasculature. Nat Neurosci. October 2018;21(10):1380–1391. doi: 10.1038/s41593-018-0227-9 [DOI] [PMC free article] [PubMed] [Google Scholar]
- 10.Absinta M, Ha SK, Nair G, et al. Human and nonhuman primate meninges harbor lymphatic vessels that can be visualized noninvasively by MRI. Elife. October 2017;6doi: 10.7554/eLife.29738 [DOI] [PMC free article] [PubMed] [Google Scholar]
- 11.Tallantyre EC, Morgan PS, Dixon JE, et al. A comparison of 3T and 7T in the detection of small parenchymal veins within MS lesions. Invest Radiol. Sep 2009;44(9):491–4. doi: 10.1097/RLI.0b013e3181b4c144 [DOI] [PubMed] [Google Scholar]
- 12.Tallantyre EC, Morgan PS, Dixon JE, et al. 3 Tesla and 7 Tesla MRI of multiple sclerosis cortical lesions. J Magn Reson Imaging. Oct 2010;32(4):971–7. doi: 10.1002/jmri.22115 [DOI] [PubMed] [Google Scholar]
- 13.Kollia K, Maderwald S, Putzki N, et al. First clinical study on ultra-high-field MR imaging in patients with multiple sclerosis: comparison of 1.5T and 7T. AJNR Am J Neuroradiol. Apr 2009;30(4):699–702. doi: 10.3174/ajnr.A1434 [DOI] [PMC free article] [PubMed] [Google Scholar]
- 14.Harrison DM, Wang KY, Fiol J, et al. Leptomeningeal Enhancement at 7T in Multiple Sclerosis: Frequency, Morphology, and Relationship to Cortical Volume. J Neuroimaging. September 2017;27(5):461–468. doi: 10.1111/jon.12444 [DOI] [PMC free article] [PubMed] [Google Scholar]
- 15.Jonas SN, Izbudak I, Frazier AA, Harrison DM. Longitudinal Persistence of Meningeal Enhancement on Postcontrast 7T 3D-FLAIR MRI in Multiple Sclerosis. AJNR Am J Neuroradiol. October 2018;39(10):1799–1805. doi: 10.3174/ajnr.A5796 [DOI] [PMC free article] [PubMed] [Google Scholar]
- 16.Blatter C, Meijer EF, Nam AS, et al. In vivo label-free measurement of lymph flow velocity and volumetric flow rates using Doppler optical coherence tomography. Sci Rep. July 2016;6:29035. doi: 10.1038/srep29035 [DOI] [PMC free article] [PubMed] [Google Scholar]
- 17.Sanossian N, Saver JL, Alger JR, et al. Angiography reveals that fluid-attenuated inversion recovery vascular hyperintensities are due to slow flow, not thrombus. AJNR Am J Neuroradiol. Mar 2009;30(3):564–8. doi: 10.3174/ajnr.A1388 [DOI] [PMC free article] [PubMed] [Google Scholar]
- 18.Saade C, Bou-Fakhredin R, Yousem DM, Asmar K, Naffaa L, El-Merhi F. Gadolinium and Multiple Sclerosis: Vessels, Barriers of the Brain, and Glymphatics. AJNR Am J Neuroradiol. December 2018;39(12):2168–2176. doi: 10.3174/ajnr.A5773 [DOI] [PMC free article] [PubMed] [Google Scholar]
- 19.Marques JP, Kober T, Krueger G, van der Zwaag W, Van de Moortele PF, Gruetter R. MP2RAGE, a self bias-field corrected sequence for improved segmentation and T1-mapping at high field. Neuroimage. Jan 15 2010;49(2):1271–81. doi: 10.1016/j.neuroimage.2009.10.002 [DOI] [PubMed] [Google Scholar]
- 20.Fujimoto K, Polimeni JR, van der Kouwe AJ, et al. Quantitative comparison of cortical surface reconstructions from MP2RAGE and multi-echo MPRAGE data at 3 and 7 T. Neuroimage. Apr 15 2014;90:60–73. doi: 10.1016/j.neuroimage.2013.12.012 [DOI] [PMC free article] [PubMed] [Google Scholar]
- 21.Tustison NJ, Avants BB, Cook PA, et al. N4ITK: improved N3 bias correction. IEEE Trans Med Imaging. Jun 2010;29(6):1310–20. doi: 10.1109/TMI.2010.2046908 [DOI] [PMC free article] [PubMed] [Google Scholar]
- 22.Avants BB, Tustison NJ, Song G, Cook PA, Klein A, Gee JC. A reproducible evaluation of ANTs similarity metric performance in brain image registration. Neuroimage. Feb 01 2011;54(3):2033–44. doi: 10.1016/j.neuroimage.2010.09.025 [DOI] [PMC free article] [PubMed] [Google Scholar]
- 23.Avants BB, Tustison NJ, Wu J, Cook PA, Gee JC. An open source multivariate framework for n-tissue segmentation with evaluation on public data. Neuroinformatics. Dec 2011;9(4):381–400. doi: 10.1007/s12021-011-9109-y [DOI] [PMC free article] [PubMed] [Google Scholar]
- 24.Cox RW. AFNI: software for analysis and visualization of functional magnetic resonance neuroimages. Comput Biomed Res. Jun 1996;29(3):162–73. doi: 10.1006/cbmr.1996.0014 [DOI] [PubMed] [Google Scholar]
- 25.Cox RW, Hyde JS. Software tools for analysis and visualization of fMRI data. NMR Biomed. 1997 Jun-Aug 1997;10(4–5):171–8. doi: [DOI] [PubMed] [Google Scholar]
- 26.Mestre H, Mori Y, Nedergaard M. The Brain’s Glymphatic System: Current Controversies. Trends Neurosci. July 2020;43(7):458–466. doi: 10.1016/j.tins.2020.04.003 [DOI] [PMC free article] [PubMed] [Google Scholar]
- 27.Benveniste H, Liu X, Koundal S, Sanggaard S, Lee H, Wardlaw J. The Glymphatic System and Waste Clearance with Brain Aging: A Review. Gerontology. 2019;65(2):106–119. doi: 10.1159/000490349 [DOI] [PMC free article] [PubMed] [Google Scholar]
- 28.Deike-Hofmann K, Reuter J, Haase R, et al. Glymphatic Pathway of Gadolinium-Based Contrast Agents Through the Brain: Overlooked and Misinterpreted. Invest Radiol. April 2019;54(4):229–237. doi: 10.1097/RLI.0000000000000533 [DOI] [PubMed] [Google Scholar]
- 29.Watts R, Steinklein JM, Waldman L, Zhou X, Filippi CG. Measuring Glymphatic Flow in Man Using Quantitative Contrast-Enhanced MRI. AJNR Am J Neuroradiol. April 2019;40(4):648–651. doi: 10.3174/ajnr.A5931 [DOI] [PMC free article] [PubMed] [Google Scholar]
- 30.Ringstad G, Eide PK. Cerebrospinal fluid tracer efflux to parasagittal dura in humans. Nat Commun. January 2020;11(1):354. doi: 10.1038/s41467-019-14195-x [DOI] [PMC free article] [PubMed] [Google Scholar]
- 31.Filippopulos FM, Fischer TD, Seelos K, et al. Semiquantitative 3T Brain Magnetic Resonance Imaging for Dynamic Visualization of the Glymphatic-Lymphatic Fluid Transport System in Humans: A Pilot Study. Invest Radiol. Aug 01 2022;57(8):544–551. doi: 10.1097/RLI.0000000000000870 [DOI] [PubMed] [Google Scholar]
- 32.Kuo PH, Stuehm C, Squire S, Johnson K. Meningeal Lymphatic Vessel Flow Runs Countercurrent to Venous Flow in the Superior Sagittal Sinus of the Human Brain. Tomography. Sep 2018;4(3):99–104. doi: 10.18383/j.tom.2018.00013 [DOI] [PMC free article] [PubMed] [Google Scholar]
- 33.Lemprière S Meningeal lymphatic flow slows after mild traumatic brain injury. Nat Rev Neurol. November 2020;16(11):600. doi: 10.1038/s41582-020-00420-5 [DOI] [PubMed] [Google Scholar]
- 34.Shapiro M, Srivatanakul K, Raz E, Litao M, Nossek E, Nelson PK. Dural Venous Channels: Hidden in Plain Sight-Reassessment of an Under-Recognized Entity. AJNR Am J Neuroradiol. August 2020;41(8):1434–1440. doi: 10.3174/ajnr.A6647 [DOI] [PMC free article] [PubMed] [Google Scholar]
- 35.Shapiro M, Raz E, Nossek E, et al. Dural venous system: angiographic technique and correlation with ex vivo investigations. J Neurointerv Surg. Feb 2022;14(2):196–201. doi: 10.1136/neurintsurg-2020-017237 [DOI] [PubMed] [Google Scholar]
Associated Data
This section collects any data citations, data availability statements, or supplementary materials included in this article.
Supplementary Materials
Supplement Figure 1. PMLVs adjacent to other venous structures. White arrows denote the location of signal intensity on the Pre-contrast FLAIR sequence (second column), located adjacent to venous structures when localized on the anatomic T1w MP2RAGE sequence (first column). White arrows on subtraction images (d-FLAIR 1 and d-FLAIR2) denote where gadolinium accumulation signal is present. TV = transverse sinus. ICV = Internal cerebral veins.


