

Abstract
Th17-cells play a key role in the pathogenesis of autoimmune hepatitis (AIH). Dysregulation of Th17-cells in AIH is linked to defective response to aryl-hydrocarbon-receptor (AhR) activation. AhR modulates adaptive immunity and is regulated by aryl-hydrocarbon-receptor-repressor (AHRR), which inhibits AhR transcriptional activity. In this study, we investigated whether defective Th17-cell response to AhR derives from aberrant AHRR regulation in AIH.
Th17-cells, obtained from the peripheral blood of AIH patients (n=30) and healthy controls (n=30) were exposed to AhR endogenous ligands, and their response assessed in the absence or presence of AHRR silencing. Therapeutic effects of AHRR blockade were tested in a model of Concanavalin-A (Con-A)-induced liver injury in humanized mice.
AHRR was markedly upregulated in AIH Th17-cells, following exposure to L-kynurenine, an AhR endogenous ligand. In patients, silencing of AHRR boosted Th17-cell response to L-kynurenine, as reflected by increased levels of CYP1A1, the main gene controlled by AhR; and decreased IL17A expression. Blockade of AHRR limited the differentiation of naïve CD4-cells into Th17 lymphocytes; and modulated Th17-cell metabolic profile by increasing the levels of uridine via ATP depletion or pyrimidine salvage. Treatment with 2’-deoxy-2’-fluoro-d-arabinonucleic acid (FANA) oligonucleotides to silence human AHRR in vivo, reduced ALT levels, attenuated lymphocyte infiltration on histology, and heightened frequencies of regulatory immune subsets in NOD/scid/gamma mice, reconstituted with human CD4 cells, and exposed to Con-A.
In conclusion, blockade of AHRR in AIH restores Th17-cell response to AHR, and limits Th17-cell differentiation through generation of uridine. In vivo, silencing of AHRR attenuates liver damage in NOD/scid/gamma mice. Blockade of AHRR might therefore represent a novel therapeutic strategy to modulate effector Th17-cell immunity and restore homeostasis in AIH.
Keywords: AHRR, AHR, AIH, Th17 cells
Graphical Abstract

1. Introduction
Overwhelming T-effector (Teff) cell immunity plays a prominent role in perpetrating liver damage in autoimmune hepatitis (AIH), an organ-specific autoimmune disorder, characterized by elevated levels of immunoglobulin G (IgG), seropositivity for autoantibodies and histological evidence of interface hepatitis [1, 2]. Dysfunction in regulatory T cells (Tregs), a subset key to the maintenance of immune tolerance, permits unopposed Teff to perpetuate liver injury, resulting in end-stage hepatopathy that might ultimately require liver transplantation [3–7].
T-helper-type-17 (Th17) cells are among the Teff subsets involved in AIH liver damage [8], and their presence in the portal tract infiltrate has been previously linked to increased inflammation and fibrosis [9–11]. In AIH, the Th17 cell pool is also maintained by a proportion of Tregs that when exposed to a pro-inflammatory environment acquire phenotypic and functional features of Th17 lymphocytes [12]. This implicates that strategies interfering with already existing Th17 cells, or impeding Treg conversion into Th17 cells, are relevant to the reconstitution of immune homeostasis in this hepatopathy.
Aberrant Th17 cell immunity in AIH has been linked to alterations of aryl hydrocarbon receptor (AhR) signaling that mediates toxin responses while modulating Teff and Treg cell immunity [13–15]. Upon binding to exogenous and/or endogenous ligands such as environmental pollutants, dietary compounds, products of heme and tryptophan catabolism, AhR translocates to the cell nucleus where it binds to aryl hydrocarbon receptor nuclear translocator (ARNT) to regulate gene transcription [16]. AhR may undergo regulation by aryl hydrocarbon receptor repressor (AHRR) that interferes with the AhR/ARNT complex transcriptional activity [17, 18]. Previous work has shown that Th17 cells derived from the peripheral blood of AIH patients fail to adequately respond to AhR activation, as reflected by impaired induction of cytochrome P4501A1 (CYP1A1) [13], the main gene controlled by the AhR/ARNT complex; and by limited upregulation of immunomodulatory mediators like CD39 [8, 13], an ectoenzyme that initiates a hydrolysis cascade ultimately converting pro-inflammatory ATP into immunosuppressive adenosine [19–21]. These responses were noted in the presence of exogenous and endogenous AhR ligands, including the tryptophan metabolite L-kynurenine, which is known to induce Tregs [22, 23] and was previously found being reduced in the serum of children with AIH [24].
In this study, we investigated whether inadequate Th17 cell response to AhR activation derives from aberrant AHRR regulation and whether blockade of AHRR impacts Th17 cells in vitro and is beneficial in vivo, in a model of acute liver injury in humanized mice.
We report that Th17 cells obtained from AIH patients aberrantly upregulate AHRR when exposed to L-kynurenine and silencing of AHRR restores the response of Th17 cells to this endogenous ligand. Blockade of AHRR limits the differentiation of naïve CD4 cells into Th17 cells; modulates the metabolic profile of differentiated Th17 cells by favoring generation of anti-inflammatory metabolites; and prevents conversion of AIH derived Tregs into Th17 cells. Notably, silencing of human AHRR in vivo results in attenuated disease in a model of Concanavalin-A (Con-A)-induced acute liver injury in humanized NOD/scid/gamma mice.
2. Materials and methods
2.1. Subjects
Thirty patients positive for anti-nuclear antibodies (ANA) and/or smooth muscle antibodies (SMA) type 1 AIH were studied. A liver biopsy performed at the time of, or close to diagnosis, showed presence of histopathological features of interface hepatitis in all patients. At the time of study, 21 patients were ANA and/or SMA positive, while 3 were negative for both autoantibodies. Positivity for ANA and/or SMA autoantibodies in these 3 patients was noted in previous determinations, performed at ten, twelve and eighteen months prior to this study. In 6 patients, ANA and SMA autoantibody titers were unknown at the time of study but were positive in previous determinations, before PBMC collection. Twenty-four patients were females and 21 were studied during remission (i.e., normal transaminase levels) while on immunosuppression; whereas 9 patients were studied while on active disease, during an episode of relapse. All patients studied during remission and 8 patients studied at relapse were on immunosuppressive treatment. Demographic and laboratory data of AIH patients are summarized in Supplementary Table 1. Patients on immunosuppression were treated with azathioprine (50–175 mg/day) alone or in combination with prednisone (1–15 milligram/day); budesonide (3–6 mg/day) alone or in combination with azathioprine. Six patients were on mycophenolate (500–2,000 mg/day); 2 were on tacrolimus (2 mg/day). One patient was not on immunosuppression at the time of study. Thirty healthy subjects (median age 45 years, range 22–60; 18 females) served as normal controls. The study received IRB approval at Beth Israel Deaconess Medical Center, Boston, MA. Written consent was obtained from all study participants prior to inclusion in the study.
2.2. Cell separation
Peripheral blood mononuclear cells (PBMCs) were obtained by Ficoll density centrifugation, as previously reported [25]. Mononuclear cell viability, determined by Trypan Blue exclusion exceeded 98%. CD4+ lymphocytes were purified from PBMCs by negative selection, according to the manufacturer’s recommendations (Miltenyi Biotech, San Diego, CA). The purity of CD4+ cells was consistently higher than 92%. Following isolation, cells were resuspended in RPMI 1640, supplemented with 2 mM L-glutamine, 100 IU/ml penicillin, 100 mg/ml streptomycin, 1% non essential amino acids, and 10% fetal bovine serum (FBS) and then exposed to Th17 polarizing conditions for five days. These consisted of IL6 (50 ng/ml), TGF-β (5 ng/ml), IL1β (25 ng/ml) and Dynabeads Human T Activator (Thermo Fisher Scientific, Cambridge, MA) at 1:50 bead:cell ratio. In some experiments, Th17 cells were enriched from CD4+ lymphocytes as CCR6+CXCR3− cells (Miltenyi Biotech), as we previously reported [13, 25]. In additional cultures, CD4 cells were polarized into Tregs upon exposure to IL2 (100 ng/ml), TGF-β (10 ng/ml) and Dynabeads Human T Activator at 1:2 bead:cell ratio.
2.3. Flow cytometry
The phenotype of differentiated Th17 cells and Tregs was validated by flow cytometry. Cells were incubated with anti-human antibodies to CD4 (clone # A161A1), CD25 (clone # BC96), CD127 (clone # A019D5) and CCR6 (clone # G034E3), all from Biolegend (San Diego, CA) and to IL23 receptor (IL23R, clone # 218213) from R&D Systems (Minneapolis, MN). Expression of RORC and FOXP3 and frequency of IL17 producing lymphocytes was measured using the eBioscience FOXP3/Transcription Factor Stainig Set (Thermo Fisher Scientific), according to the manufacturer’s instructions. Following fixation and permeabilization, cells were stained with anti-human RORC (clone # AFKJS-9, Thermo Fisher Scientific), anti-human FOXP3 (clone # 206D, Biolegend), and anti-human IL17A (clone # BL168 Biolegend). Cells were acquired on a CytoFLEX LX Flow Cytometer (Beckman Coulter, Pasadena, CA) and analyzed using FlowJo 2 software (version 10, TreeStar, Ashland, OR). Fluorescence compensation was adjusted based on fluorescence minus one (FMO). A representative flow cytometry staining of differentiated Th17 and Treg cells, obtained from the peripheral blood of one healthy blood donor is represented in Supplementary Fig. 1A–B.
2.4. Cell culture and inhibition studies
Polarized and ex vivo isolated Th17 cells were exposed to unconjugated bilirubin (UCB, Frontier Scientific, Newark, DE), a product of heme catabolism with known immunoregulatory properties [26–28]; or L-kynurenine (Millipore Sigma, Burlington, MA) [23, 29]. UCB and L-kynurenine were used at 20 μM (UCB) and 200 μM (L-kynurenine) for the last 6 (UCB) and 36 (L-kynurenine) hours of culture [13, 25]. Molarity and length of incubation were performed according to our previously validated protocols [13]. Resuspension of UCB was carried out using aqueous solution containing 2M NaOH and 200 mM Tris-HCl (pH 8.4) and by limiting light exposure to the minimum [25]. L-kynurenine was resuspended in 0.5 M HCl, as per manufacturer’s recommendations and as we reported previously [13]. In additional cultures, untreated and L-kynurenine treated Th17 cells were exposed to AHRR silencing using Silencer Select siRNA (Thermo Fisher Scientific). Cells were resuspended in Opti-MEM medium (Thermo Fisher Scientific) and seeded at 2.5 × 10⁵/well in a round bottom 96-well plate. AHRR specific siRNA was used at a final concentration of 1 pmol/well and added to Th17 cells for the last 18 hours of culture. A scramble RNA (Thermo Fisher Scientific) served as a negative control. AHRR silencing was confirmed by qPCR using gene specific primers, as detailed below.
In additional experiments, naïve CD4 cells, obtained by immunomagnetic isolation (Miltenyi Biotech), were exposed to AHRR siRNA or scramble on day 1 and 3 during polarization into Th17 cells. FOXP3 and RORC gene expression was measured afterwards. In another set of experiments the anti-inflammatory metabolites uridine (EMD Millipore, Billerica, MA) and allantoin (Millipore Sigma), used at 100 μM [30, 31], were added on day 2 of naïve CD4 cell differentiation into Th17 cells and RORC, FOXP3, ENTPD1 (encoding for CD39), IL10 and IL17A gene expression tested afterwards. In additional cultures, polarized Tregs were exposed to a pro-inflammatory challenge consisting of IL6 (0.04 μg/ml) and IL1β (0.01 μg/ml) [12] for 36 hours, in the absence or presence of AHRR siRNA. Expression of FOXP3, ENTPD1, IL10 and IL17A was measured afterwards.
2.5. qRT PCR
Expression of human AHRR, CYP1A1, ENTPD1, IL10, IL22, IL17A, IFNγ, FOXP3 and RORC was determined by qPCR. Total RNA was extracted using TRizol reagent (Thermo Fisher Scientific) from 3–5 ×10⁵ Th17 or Treg cells, obtained after polarization of peripheral blood derived CD4 cells or after ex vivo enrichment. mRNA was reverse transcribed using iScript cDNA synthesis kit (Bio-Rad Laboratories, Hercules, CA) according to the manufacturer’s instructions. Samples were run on a StepOnePlus Real-Time PCR System (Applied Biosystems, Foster City, CA) and the results were analyzed by matched software and expressed as relative quantification. Relative gene expression was determined after normalization to human β-actin or GAPDH.
AHRR, CYP1A1, ENTPD1, IL10, IL22, and FOXP3 primer sequence was as previously reported [4, 13, 25]. IFNγ and RORC primer sequences were as follows: IFNγ forward 5’ CCAACGCAAAGCAATACATGA 3’; IFNγ reverse 5’ TTTTCGCTTCCCTGTTTTAGCT 3’; RORC forward 5’ CTGCTGGCTGCAAAGAAGAC 3’; RORC reverse 5’ GGTTCCTGTTGCTGCTGTTG 3’. Prime time qPCR primers for the detection of 5-prime-nucleotidase (P5’N-1), cytidine deaminase (CDA), β-actin and GAPDH were pre-designed by and purchased from Integrated DNA Technologies (Coralville, IA).
2.6. Metabolomics
Polar metabolites from Th17 cells of healthy controls were measured by mass spectrometry, as previously reported [32]. 3–4 × 10⁶ cells were used per condition. Due to the high number of cells required, only Th17 cells derived from healthy controls were used for this assay. Following differentiation and AHRR siRNA/scramble treatment, cells were pelleted and mixed with 4 ml 80% methanol and transferred to −80°C. After 15-minute incubation, the cell lysate/methanol mixture was transferred to a 15 ml conical tube on dry ice, and centrifuged at 14,000 g at 4°C for 5 minutes to pellet the cell debris and proteins. Pellets were subsequently mixed with 500 μl 80% methanol, and the mixture transferred into a 1.5 ml eppendorf tube on dry ice. After centrifugation at 14,000 g at 4°C for 5 minutes, supernatants were discarded and pellets resuspended in 500 μl 80% methanol. Following an additional centrifugation at 14,000 g at 4°C for 5 minutes, samples were subjected to mass spectrometry for polar metabolomic profiling as previously reported [32] or stored at −80°C, if not used immediately.
2.7. Immunoblotting
Immunoblot analysis was performed using 10 μg total protein per sample. After one hour blocking using Intercept (TBS) Protein-free Blocking Buffer (LI-COR Biosciences, Lincoln, NE), rabbit anti-AHRR polyclonal antibody (cat. # NBP3–10508, Novus Biologicals) and mouse monoclonal anti-human β-actin antibody (cat. # ab8226, Abcam, Waltham, MA) were added at 1 μg/ml (anti-AHRR) and 1/10,000 (anti-β-actin) for overnight incubation at 4°C. IRDye 800CW goat anti-rabbit secondary antibody (cat. # D20621-05, LI-COR) (for anti-AHRR) and IRDye 680RD goat anti-mouse secondary antibody (for anti-β-actin) (cat. # 926–68070, LI-COR) were applied at 1/15,000 and 1/20,000. Bands were visualized using Odyssey-M (LI-COR Biosciences) and analyzed using LI-COR acquisition software. Band density was measured using Image J software.
2.8. Induction and assessment of liver injury
Acute liver injury was induced in NOD/scid/gamma mice, pre-emptively transferred with AHRR+ human CD4 cells, using Con-A, to mostly reflect T cell mediated liver inflammation [33, 34]. Con-A was used because of its well-established ability to activate human T cells [35–37].
Briefly, six week-old female NOD/scid/gamma mice were purchased from the Jackson Laboratory (Bar Harbor, ME) and kept under pathogen-free conditions. Mice were injected with 2 × 10⁶ CD4 T cells, obtained from the peripheral blood of one healthy blood donor. Prior to injection, CD4 T cells were tested for AHRR expression by qRT-PCR. Three weeks later, mice were bled and checked for human chimerism. Mice showing more than 10% human chimerism (75% of the originally transferred mice) were administered 2′-deoxy-2′-fluoro-d-arabinonucleic acid (FANA) oligonucleotides specifically targeting human AHRR (AHRR-FANA) (AumBiotech, Philadelphia, PA) or scramble (AumBiotech) at 5.4 mg/kg i.p., as we previously reported [38, 39]. Seventy-two hours before harvesting, scramble and AHRR-FANA treated mice were administered Con-A (Millipore Sigma) at 20 mg/kg i.v. and sacrificed four hours later. This time point was chosen after performing a series of preliminary experiments where harvest at 4, 8 and 12 hours after Con-A injection was conducted in NOD/scid/gamma mice reconstituted with human CD4 T cells. As no significant differences in ALT serum levels and liver histology were observed between 4 and 8 hours, and because of decreased ALT and improved clinical parameters in animals harvested at 12 hours following Con-A injection, harvest at 4 hours was conducted in all subsequent experiments.
At the harvest, blood was withdrawn from the vena cava and spleen and liver were collected from each recipient. Serum ALT was measured using ALT Catalyst Test (IDEXX, Westbrook, ME) (assay normal values: 28–132 U/L). Lymphocytes were isolated from spleen using Buffer EL (Erythrocyte lysis buffer) (Qiagen, Germantown, MD). Intrahepatic lymphocytes were obtained according to the protocol by Morsy et al. [40] with minor modifications. Briefly, liver tissue was mechanically disrupted and the resulting homogenate was centrifuged at 40 g to remove the hepatocyte pellet and subsequently filtered using 70 μm filters. The phenotype of spleen and liver infiltrating lymphocytes was evaluated by flow cytometry. Staining was carried out using anti-human CD3 (clone # OKT3), CD4 (clone # OKT4), CD39 (clone # A1), IL17A (clone # BL168), IL10 (clone # JES3–9D7), FOXP3 (clone # PCH101) and IFNγ (clone # B27), all from Biolegend. Dead cells were excluded using 7-amino-actinomycin D (7-AAD) viability staining solution (Biolegend) and single cell gating. Expression of FOXP3 was determined using the eBioscience FOXP3/Transcription Factor staining buffer set (eBioscience) and upon staining with anti-human FOXP3 antibodies (clone # PCH101, Thermo Fisher Scientific). Frequency of cytokine producing cells was determined using anti-human IL17A (clone # BL168, Biolegend), anti-human IFNγ (clone # B27, BD Pharmingen, San Diego, CA), and anti-human IL10 (clone # JES3–9D7, Biolegend) antibodies. Flow cytometry analysis was carried out, as indicated above. The animal protocol was approved by the Animal Care and Use Committee at BIDMC, Boston (protocol # 049–2021).
2.9. Immunohistochemistry staining
Paraffin embedded spleen and liver tissue sections were subjected to antigen retrieval [8]. Six μm tissue sections were stained with hematoxylin and eosin and examined for evidence of tissue damage. Sections were also incubated overnight at 4°C with polyclonal rabbit anti-human CD3 (catalogue # A045229-2, Agilent Dako, Santa Clara, CA) at 1:70. Following endogenous peroxidase blocking with 3% H2O2, sections were incubated with 1:1,000 goat anti-rabbit secondary antibody (Vector Laboratories, Burlingame, CA) for 1 hour at room temperature. Following treatment with Vectastain Elite ABC kit (Vector Laboratories, Newark, CA), Immpact DAB (Vector Laboratories) was applied, and sections examined by light microscopy.
2.10. Statistics
Results are expressed as mean ± SEM, unless otherwise stated. Normality of variable distribution was assessed by Kolmogorov-Smirnov goodness of fit test. Comparisons were performed using parametric (paired or unpaired Student’s t test) or non-parametric (Mann Whitney test) test according to data distribution (two sided). One-way ANOVA test followed by Tukey’s multiple comparison test and ANOVA repeated measures were used when comparing more than two sets of data. Correlation was made using Pearson correlation coefficient. P≤0.05 was considered significant. Analysis of metabolomics data was conducted using R (version 3.6.2).
3. Results
3.1. Silencing of AHRR restores Th17 cell response to AhR in AIH
We have previously shown that Th17 cell response to AhR activation is defective in AIH [13]. Since AHRR is known to inhibit the AhR/ARNT complex [16, 18], we determined whether inability of Th17 cells to respond to AhR ligands derives from aberrant AHRR levels and/or activation. Th17 cells were obtained from AIH patients and controls upon CD4 cell polarization in the presence of IL6, IL1β and TGF-β, as we previously reported [13, 25, 41]. Phenotype validation after differentiation confirmed that Th17 cells expressed CCR6, IL23R and RORC and produced IL17A (Supplementary Fig. 1A). In samples with a higher CD4 cell yield after purification, immunomagnetic enrichmment of CCR6+CXCR3− Th17 lymphocytes was carried out.
We initially measured the levels of AHRR at baseline and following activation in the presence of the AhR endogenous ligands UCB and L-kynurenine. Although baseline AHRR levels were similar in Th17 cells of AIH patients and controls (Fig. 1A, Supplementary Fig. 2A and [13]), increase in AHRR mRNA levels and AHRR protein were noted in the presence of L-kynurenine in Th17 cells obtained from AIH patients, when compared to control cells (Fig. 1B–C and Supplementary Fig. 2B). No upregulation of AHRR was noted in the presence of UCB in Th17 cells of healthy controls and AIH patients (Fig. 1B–C and Supplementary Fig. 2B). Levels of AHRR at baseline were similar in AIH patients at relapse and during remission (Supplementary Fig. 2C) but were directly correlated with total bilirubin values (R2: 0.424; P<0.0085). No significant differences were noted in AHRR baseline levels between patients treated with azathioprine alone or in combination with prednisone or budesonide (Supplementary Fig. 2D). Increase in AHRR levels following exposure to L-kynurenine was unaffected by disease status or immunosuppressive treatment (Fig. 1B–C). As no subtantial changes in AHRR upregulation were noted between Th17 cells obtained after polarization or ex vivo enrichment, the subsequent experiments were carried out using polarized Th17 cells.
Fig. 1. Silencing of AHRR restores Th17 cell response to AhR activation.
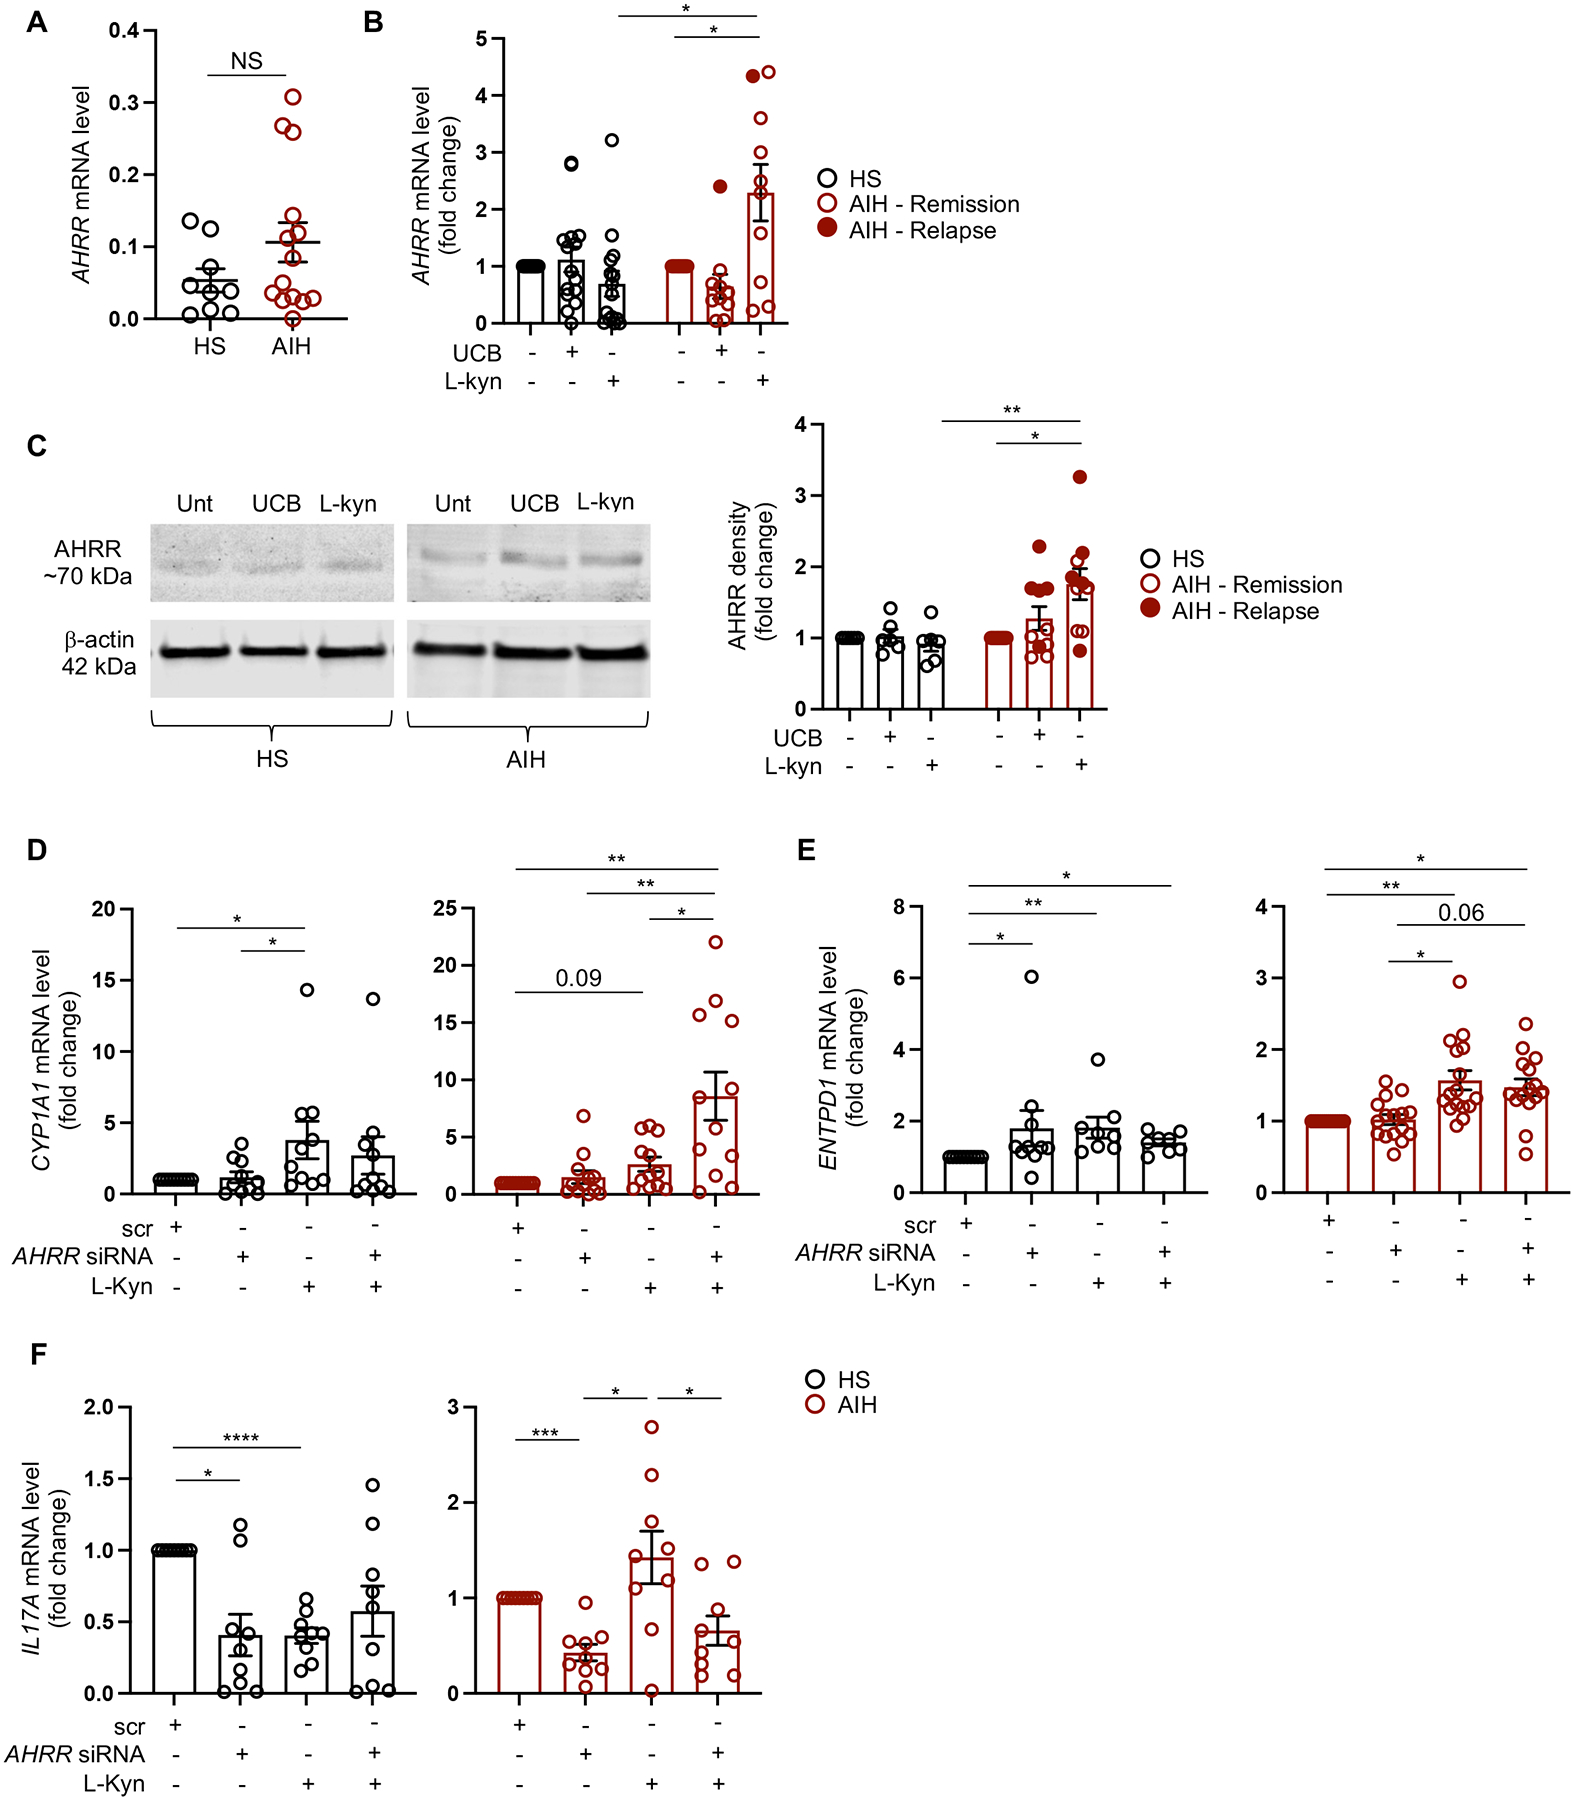
Th17 cells were obtained following polarization of peripheral blood derived CD4 cells in the presence of IL6, IL1β and TGF-β. Mean ± SEM (A) AHRR mRNA levels at baseline, before AhR activation (healthy subjects, HS, n=9; autoimmune hepatitis, AIH, n=14); (B) AHRR mRNA levels in the absence or presence of unconjugated bilirubin (UCB) or L-kynurenine (L-kyn) (HS, n=15; AIH, n=10, nine of whom were studied during remission and one during an episode of relapse). Results are expressed as fold change compared to untreated cells. (C) Immunoblot of AHRR and β-actin expression in untreated, UCB or L-kyn treated Th17 cells from one representative HS and one AIH patient. Cumulative data representing mean ± SEM AHRR density levels are also shown (HS, n=6; AIH, n=10, five of whom were studied during remission and five during an episode of relapse). Results are expressed as fold change compared to untreated cells. Mean ± SEM (D) CYP1A1, (E) ENTPD1 (encoding for the ectoenzyme CD39) and (F) IL17A mRNA levels in Th17 cells exposed to scramble (scr), AHRR siRNA, L-kyn or AHRR siRNA plus L-kyn (HS, n=9–10; AIH, n=9–16). Results are expressed as fold change compared to scramble. Data in Panel A were analyzed using unpaired t test; data in panels B-F were analyzed using one-way ANOVA test followed by Tukey’s multiple comparison test, and by ANOVA repeated measures. *P≤0.05; **P≤0.01; ***P≤0.001; ****P≤0.0001.
Since upregulation of AHRR might be implicated in the impaired response of Th17 cells to AhR activation, we determined the effects of AHRR silencing on the expression of genes regulated by the AhR/ARNT complex. In AIH, silencing of AHRR resulted in higher levels of CYP1A1 - the main gene controlled by the AhR/ARNT complex - in Th17 cells concomitantly exposed to L-kynurenine, when compared to Th17 cells exposed to scramble, L-kynurenine or AHRR siRNA used individually (Fig. 1D). Levels of CYP1A1 in the presence of L-kynurenine alone were higher than in cells exposed to scramble, this difference being significant in Th17 cells from healthy individuals and trending to significance in cells of AIH patients (Fig. 1D). When analyzing other genes controlled by the AhR/ARNT complex, we found that blockade of AHRR increased the levels of ENTPD1 (encoding for the ectoenzyme CD39) in the presence of L-kynurenine in Th17 cells of AIH patients and healthy controls (Fig. 1E), when compared to cells exposed to scramble but not to L-kynurenine used individually (Fig. 1E). Increase in ENTPD1 levels was found upon exposure to L-kynurenine in both AIH and control cells (Fig. 1E), and following exposure to AHRR siRNA in controls (Fig. 1E).
We noted reduced IL17A levels following Th17 cell exposure to AHRR siRNA in both healthy subjects and AIH patients (Fig. 1F). Decrease in IL17A levels was also noted after Th17 cell exposure to L-kynurenine in controls; and to a combination of AHRR siRNA and L-kynurenine in AIH derived Th17 cells (Fig. 1F). No changes in the expression of other genes regulated by the AhR/ARNT complex, namely IL10, IL22 and IFNγ, were noted in Th17 cells following exposure to AHRR siRNA, used individually or in combination with L-kynurenine, in both AIH and health (Supplementary Fig. 3A–C).
Overall these data show that, in AIH, AHRR is markedly upregulated upon exposure of Th17 cells to L-kynurenine and silencing of AHRR restores the ability of AIH derived Th17 cells to respond to AhR, as indicated by increased CYP1A1 levels. Further, silencing of AHRR results in heightened ENTPD1/CD39 in Th17 cells of controls and in markedly reduced IL17A levels in Th17 cells of patients and healthy controls, suggesting that AHRR could modulate Th17 cell immune responses also in an AhR independent manner.
3.2. Silencing of AHRR limits Th17 cell differentiation and stabilizes Tregs in the pro-inflammatory milieu
Since our data show that blockade of AHRR impacts the levels of IL17A, the main cytokine produced by Th17 lymphocytes, we next tested whether exposure to AHRR siRNA impacts the differentiation of naïve CD4 cells into Th17. To this end, AHRR siRNA was added to CD4 naïve cells on days 1 and 3 of their differentiation into Th17 lymphocytes. As shown in Fig. 2A, addition of AHRR siRNA limited Th17 cell differentiation in AIH, as reflected by decreased RORC levels. In healthy individuals, addition of AHRR siRNA during Th17 cell differentiation boosted the expression of FOXP3 (Fig. 2B), suggesting acquisition of regulatory properties by the differentiating cells in this group of subjects.
Fig. 2. Silencing of AHRR limits naïve CD4 cell differentiation into Th17 cells and stabilizes Tregs in AIH.

AHRR siRNA was added on days 1 and 3 during naïve CD4 cell differentiation into Th17 cells. Mean ± SEM (A) RORC and (B) FOXP3 mRNA levels in cells exposed to scramble (scr) or AHRR siRNA (HS, n=6–7; AIH, n=8). Tregs were differentiated from naïve CD4 lymphocytes in the presence of IL2 and TGF-β. Differentiated Tregs were challenged with IL6 and IL1β, in the absence or presence of AHRR siRNA. Mean ± SEM (C) FOXP3, (D) ENTPD1, (E) IL17A and (F) IL10 mRNA levels in Tregs exposed to scramble (scr), scr plus IL6 and IL1β, and to AHRR siRNA plus IL6 and IL1β (HS, n=6; AIH, n=5–6). Results are expressed as fold change compared to scramble. Data in Panels A-B were analyzed using paired t test; data in Panels C-F were analyzed using ANOVA repeated measures. *P≤0.05; **P≤0.01.
Since AIH derived Tregs have marked propensity to convert into effector cells, including Th17 lymphocytes [12], especially when exposed to a pro-inflammatory challenge, we tested whether silencing of AHRR could interfere with this phenomenon. Tregs were differentiated from naïve CD4 cells in the presence of IL2, TGF-β and anti-CD3/CD28 as per our protocols [13, 38] (Supplementary Fig. 1B). Following polarization, cells were exposed to a pro-inflammatory challenge consisting of IL6 and IL1β [12]. In AIH Tregs, addition of IL6 and IL1β reduced the levels of FOXP3 and these were restored, at least in part, when cells were concomitantly exposed to AHRR silencing (Fig. 2C). Exposure of Tregs to AHRR blockade boosted ENTPD1 levels in IL6 and IL1β challenged cells from controls and AIH patients (Fig. 2D). In AIH, Treg exposure to pro-inflammatory challenge resulted in subtantial increase in IL17A, which was reduced to baseline levels following addition of AHRR siRNA (Fig. 2E). No changes in the levels of IL10 were noted in AIH and control derived Tregs exposed to pro-inflammatory challenge, in the absence or presence of AHRR siRNA (Fig. 2F).
Overall, these data indicate that, in AIH, AHRR blockade limits Th17 cell differentiation and stabilizes Treg phenotype in the presence of a pro-inflammatory challenge.
3.3. Silencing of AHRR favors generation of anti-inflammatory metabolites by Th17 cells
As AHRR blockade reduces the levels of IL17A (Fig. 1F) and limits Th17 cell differentiation in AIH (Fig. 2A), we next evaluated whether these effects are linked to modulation of Th17 cell metabolic profile. Due to the high cell yield required by mass spectrometry, metabolomic studies were performed on Th17 cells obtained from healthy controls only.
Metabolomic analysis showed that AHRR silencing increased the levels of uridine (Fig. 3A), a pyrimidine nucleoside that plays an important role in RNA synthesis [42–44]; and allantoin, a product of uric acid oxidation [45]. Increase in uridine levels might derive from ATP depletion through CD39, as noted in Th17 cells from healthy controls (Fig. 1E), de novo synthesis (Fig. 3B) and/or pyrimidine salvage (Fig. 3C). We therefore measured the levels of P5’N-1, which catalyzes the last step of de novo uridine synthesis by dephosphorylating uridine monophosphate (UMP) to uridine (Fig. 3B); along with the expression of CDA that converts cytidine into uridine in the pyrimidine salvage pathway (Fig. 3C). We noted that AHRR silencing left unchanged P5’N-1 expression in both controls and patients (Fig. 3B) but increased the levels of CDA in AIH derived Th17 cells (Fig. 3C).
Fig. 3. Silencing of AHRR modulates Th17 cell metabolic profile.

Th17 cells differentiated from peripheral blood CD4 cells of healthy subjects were analyzed for polar metabolite profile using mass spectrometry. (A) Volcano plot showing unchanged and upregulated metabolites in AHRR siRNA versus scramble treated Th17 cells (HS, n=11). X and Y axes correspond to log2 fold change and −log10 P value respectively. Upregulated metabolites are indicated in red. (B-C) Schematic of de novo uridine synthesis and pyrimidine salvage pathway. Mean ± SEM 5-prime-nucleotidase (P5’-N1) and cytidine deaminase (CDA) mRNA levels in Th17 cells exposed to scramble or AHRR siRNA (HS, n=6; AIH, n=7). Results are expressed as fold change compared to scramble. Data were analyzed using paired t test. *P≤0.05.
As humans lack uricase that converts the anti-oxidant uric acid into allantoin [45], it is plausible that the increased levels of this metabolite derive from uric acid through non-enzymatic reaction, as previously proposed [45].
The effects of uridine and allantoin addition on Th17 cell differentiation were then evaluated in cells from controls and patients. Uridine and allantoin were added to naïve CD4 cells on day 1 of their differentiation into Th17 cells. We noted that addition of uridine decreased IL17A expression in cells of AIH patients (Fig. 4A) and boosted FOXP3 levels in healthy subjects and AIH patients (Fig. 4C). No significant changes in RORC, IL10 and ENTPD1 levels were noted upon addition of uridine to naïve CD4 cells during their differentiation into Th17 cells in AIH patients and controls (Fig. 4B, D–E). Exposure of cells to allantoin left unchanged the expression of IL17A, RORC, FOXP3, IL10 and ENTPD1 (Fig. 4A–E).
Fig. 4. Uridine decreases IL17A and boosts FOXP3 levels in Th17 cells of AIH patients.
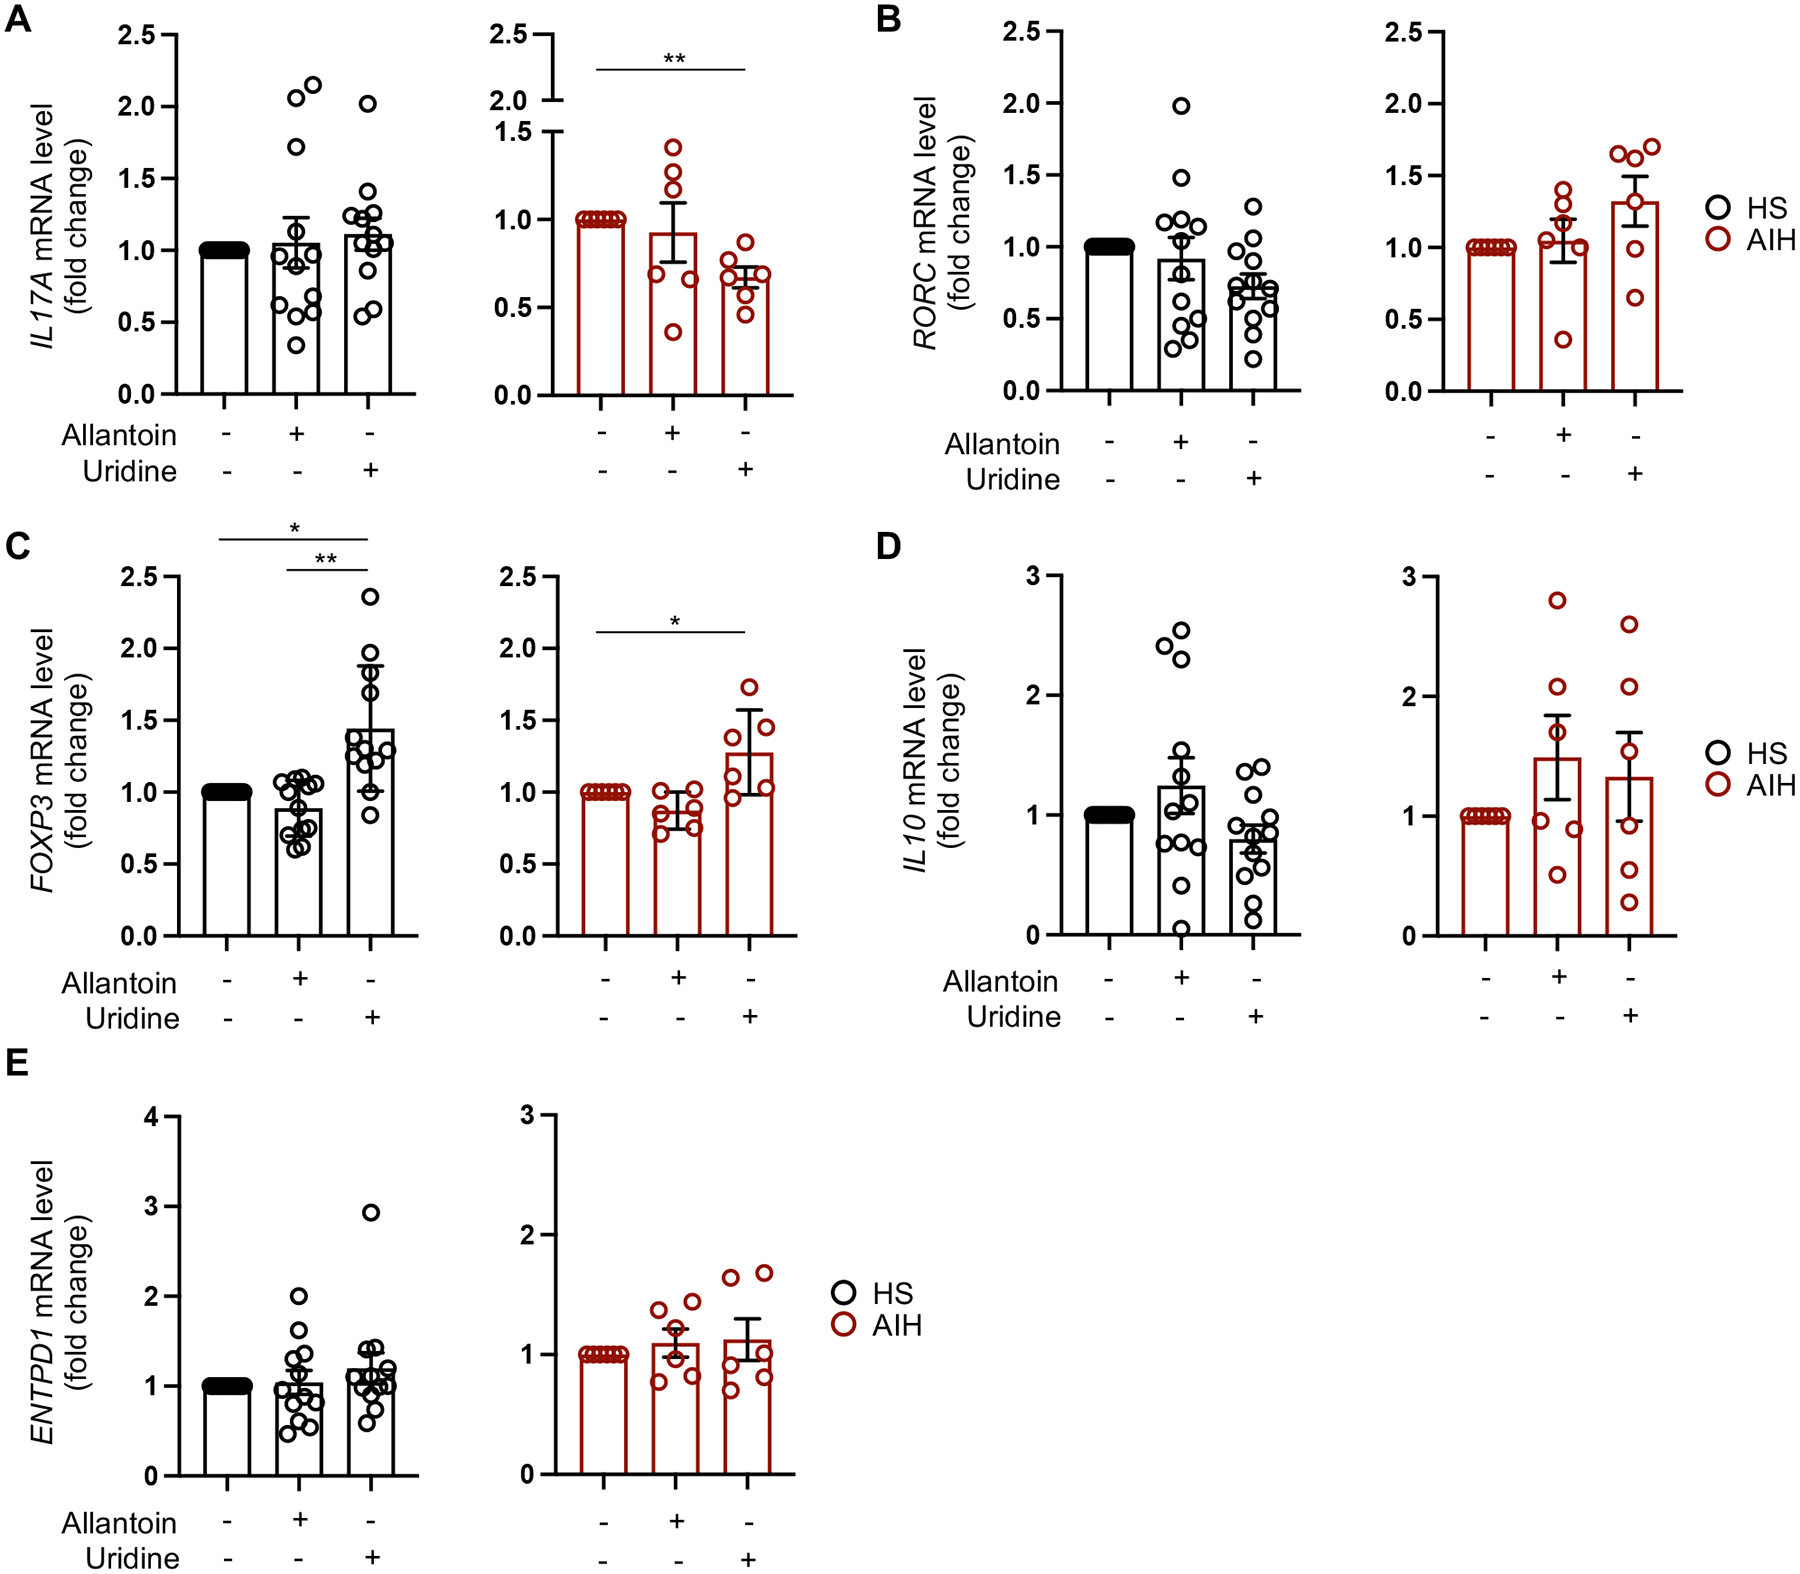
Uridine and allantoin were added to naïve CD4 cells on day 1 of their differentiation into Th17 cells. Mean ± SEM (A) IL17A, (B) RORC, (C) FOXP3, (D) IL10 and (E) ENTPD1 mRNA levels in cells exposed to allantoin or uridine (HS, n=12; AIH, n=6). Gene expression was measured after 5-day differentiation. Results are expressed as fold change compared to untreated cells. Data were analyzed using ANOVA repeated measures. *P≤0.05; **P≤0.01.
In summary, these data indicate that blockade of AHRR impacts Th17 cell metabolic profile by favoring production of anti-inflammatory metabolites. Addition of uridine to naïve CD4 cells limits their differentiation into Th17 cells in AIH patients while favoring acquisition of regulatory properties in healthy control cells.
3.4. Silencing of AHRR ameliorates liver injury in vivo
Modulation of Th17 cell immunity following AHRR blockade in AIH derived samples, led us to investigate the therapeutic effects of AHRR blockade in vivo, in a model of T cell mediated liver injury, induced by Con-A. In initial experiments, NOD/scid/gamma immunodeficient mice were reconstituted with human CD3+CD4+ cells from a healthy blood donor (Supplementary Fig. 4A). Following assessment of CD3+CD4+ cell re-population three weeks later (Supplementary Fig. 4B), animals were exposed to Con-A and sacrificed 4 hours later (Supplementary Fig. 4A). We noted increased ALT levels and substantial inflammation on histology in mice reconstituted with CD3+CD4+ cells and exposed to Con-A, when compared with mice reconstituted with CD3+CD4+ cells and unexposed to Con-A, or mice exposed to Con-A without prior CD3+CD4+ cell reconstitution (Supplementary Fig. 4C–D). This model was deployed to assess the effects of AHRR blockade in vivo that was achieved using AHRR-FANA oligonucleotides. Thus, NOD/scid/gamma recipient mice were injected with AHRR expressing CD3+CD4+ cells from a healthy donor. Mice were assessed for CD3+CD4+ cell reconstitution 3 weeks after the transfer and subsequently treated with scramble or AHRR-FANA oligos for 72 hours (Fig. 5A). For the last 4 hours, animals were exposed to Con-A and then sacrificed (Fig. 5A). Blockade of AHRR resulted in decreased serum ALT levels (Fig. 5B) and reduced hepatic inflammatory cell infiltrate on histology (Fig. 5C). No differences were noted in histological appearance and human CD3+ cell infiltrate in the spleen of AHRR-FANA and scramble treated recipients (Supplementary Fig. 5A). Flow cytometry analysis of intrahepatic lymphocytes showed increase in the frequencies of CD4+FOXP3+ and CD4+IL10+ cells in mice treated with AHRR-FANA, when compared to mice treated with scramble (Fig. 5D and Supplementary Fig. 6A, C). AHRR-FANA treated mice had lower proportions of CD4+IL17A+ cells, when compared to mice exposed to scramble (Fig. 5D and Supplementary Fig. 6D). No significant changes in the proportion of intrahepatic CD4+CD39+, CD4+IFNγ+ and CD4+IFNγ+IL17A+ lymphocytes were noted between AHRR-FANA and scramble treated mice (Fig. 5D and Supplementary Fig. 6B, E–F). Frequencies of CD4+FOXP3+, CD4+CD39+, CD4+IL10+, CD4+IFNγ+ and CD4+IFNγ+IL17A+ cells were similar in splenic lymphocytes of AHRR-FANA and scramble treated recipients (Supplementary Fig. 5B and Supplementary Fig. 6A–F).
Fig. 5. Blockade of AHRR attenuates liver injury in Con-A induced hepatitis in NOD/scid/gamma humanized mice.

(A) Liver injury was induced in NOD/scid/gamma mice, pre-emptively transferred with AHRR+ human CD4 T cells obtained from the peripheral blood of one healthy blood donor, using Con-A. Three weeks later, mice were bled and human chimerism checked. Mice showing more than 10% human chimerism were administered AHRR-FANA or scramble i.p. Seventy-two hours later, mice were administered Con-A i.v. and sacrificed after 4 hours. (B) Mean ± SEM serum ALT levels in scramble (n=8) and AHRR-FANA (n=7) treated mice. (C) Hematoxylin & Eosin and human CD3 staining of liver sections (original magnification, x10, scale bar: 200 μm), obtained from representative scramble and AHRR-FANA treated mice. (D) Mean ± SEM frequency of intrahepatic CD4+FOXP3+, CD4+CD39+, CD4+IL10+, CD4+IL17A+, CD4+IFNγ+ and IFNγ+ within CD4+IL17A+ cells in scramble (n=8) or AHRR-FANA (n=7) treated mice. Data were analyzed using unpaired t test. *P≤0.05; **P≤0.01.
Together, these data show that silencing of AHRR ameliorates liver injury in a model of Con-A induced hepatitis in NOD/scid/gamma mice reconstituted with human CD3+CD4+ cells, while containing the proportion of IL17A producing CD4+ cells and boosting the frequencies of CD4 subsets expressing regulatory markers.
4. Discussion
In this study we report that AHRR is an important modulator of Th17 cell immunity in AIH. Aberrant upregulation of AHRR following exposure to L-kynurenine, a tryptophan metabolite the levels of which are decreased in the serum of AIH patients [24], restrains Th17 cell response to AhR activation, possibly limiting AhR-mediated control over this cell subset. Interference with AhR/ARNT transcriptional activity might render Th17 cells refractory to control by immunoregulatory mechanisms, while protracting the pathogenic potential of these cells. The direct correlation between Th17 cell AHRR expression and levels of total bilirubin supports this postulate, suggesting a close link between AHRR, Th17 cell pathogenicity and disease severity. Future studies including a larger number of AIH patients are warranted to further evaluate and corroborate these important associations.
In AIH, molecular blockade of AHRR restores Th17 cell response to AhR activation in the presence of L-kynurenine, as reflected by increased levels of CYP1A1, the main gene regulated by the AhR/ARNT complex. Upregulation of CD39, an ectoenzyme that marks acquisition of regulatory properties by Th17 cells [25, 41, 46] with subsequent limitation of their pathogenic potential, does not appear to be substantially impacted by AHRR silencing, suggesting that modulation of this molecule in AIH Th17 cells is mostly mediated through AhR/ARNT activation.
Our data provide evidence that AHRR function is not solely related to AhR and its regulation. Silencing of AHRR substantially decreases the levels of IL17A in differentiated Th17 cells also in AIH, and, importantly, limits the differentiation of naïve CD4 cells into Th17 lymphocytes. Interference with the Th17 cell differentiation process might have important, translational implications to restrain the pool of effector cells in AIH. This could promote immune regulation by providing a milieu more favorable to Treg survival and expansion. In this regard, our findings show that AHRR silencing stabilizes AIH Tregs when exposed to a pro-inflammatory challenge, as indicated by IL17A being reduced to baseline levels following AHRR blockade. Importantly, the expression of regulatory molecules like FOXP3 and CD39 is also boosted to enhance Tregs even in the presence of an inflammatory environment. Perpetuation of liver damage in AIH is favored by effector cells being unable to acquire regulatory properties and maintaining their pathogenic potential over time. This is also supported by conversion of Tregs into Th17 cells in the presence of an inflammatory challenge, like exposure to IL6 and IL1β, produced and released by macrophages, innate immune subsets, and subpopulations of effector CD4 T lymphocytes. We have previously reported that de novo generation of Tregs is boosted upon immunomagnetic depletion of Th17 cells or blockade of cytokines leading to their differentiation [47]. By restraining Th17 cell differentiation and concomitantly preventing Treg conversion into Th17 cells, blockade of AHRR would be a more attractive therapeutic strategy enabling effector cell modulation while stabilizing Tregs. This would offer substantial advantages when compared to currently used drugs, the effect of which is to control inflammation without interfering with the mechanisms leading to and perpetuating liver damage.
Mechanistically, control over Th17 cell immunity following AHRR blockade could be mediated by increase in anti-inflammatory mediators like uridine, a pyrimidine nucleoside [42–44]. Decreased IL17A and heightened FOXP3 levels following treatment with uridine in AIH patients’ cells strongly support the anti-inflammatory properties of this metabolite. Uridine modulating effects over inflammation were previously reported in vivo, in the context of dextran-sodium-sulfate colitis, where uridine was found to ameliorate disease [48]; and in the setting of antigen-induced arthritis, where local administration of uridine could prevent disease development [49]. Our data implicate that increase in uridine noted following AHRR blockade in Th17 cells of healthy controls might derive from ATP depletion due to high levels of CD39. Although metabolomics analysis could not be performed in Th17 cells of AIH patients, due to limited cell yield, our data support the role of uridine in imparting regulatory features and containing IL17A levels also in the AIH setting. Higher levels of CDA following blockade of AHRR indicate that silencing of this repressor in AIH derived Th17 cells could lead to increase in uridine through pyrimidine salvage pathway. Allantoin, the other anti-inflammatory metabolite increased following AHRR blockade, does not impact Th17 functional phenotype, possibly having a less prominent role in Th17 cell metabolic modulation in this context. Studies on AIH samples, from which larger Th17 cell yields could be obtained, should be considered to validate the effects of AHRR blockade on patients’ metabolome.
In previous work, expression of AHRR was associated with high production of IFNγ by effector T cells in a model of experimental colitis [50], while its deficiency resulted in oxidative stress and ferroptosis of intraepithelial cells during intestinal inflammation [51], suggesting that AHRR could differentially modulate individual cell types in specific disease contexts. Heightened frequencies of AHRR+ lymphocytes in the AIH hepatic infiltrate, shown by us previously [13], postulate an important role for AHRR in mediating AIH tissue damage. In the present work, this is supported by in vivo data indicating the beneficial effects of AHRR blockade on disease activity and intrahepatic inflammation in NOD/scid/gamma mice exposed to Con-A after reconstitution with human CD4 cells. These effects are corroborated by flow cytometry data showing increased proportions of intrahepatic CD4+FOXP3+ and CD4+IL10+ cells and decreased frequency of liver infiltrating CD4+IL17A+ in mice treated with AHRR-FANA. Although not fully recapitulating the histological and serological features typical of human AIH, the model deployed here has several advantages, these including the genetic background of the mice that are prone to autoimmunity, the suitability for adoptive transfer with human lymphocytes, which are known to respond to Con-A [35–37]. Using this model, we could show that AHRR blockade might have therapeutic potential in an in vivo setting of acute liver injury. These findings mirror our in vitro data in AIH patient samples by showing attenuated inflammation and enhanced immune regulation. Of translational relevance, targeting AHRR would enable to achieve immune balance by acting on both regulatory and effector mechanisms.
In conclusion, AHRR modulates Th17 cell immunity in AIH likely accounting for these cells’ defective ability to respond to AhR activation. Blockade of AHRR restores Th17 cell response to AhR while controlling the pathogenic potential of these cells, possibly through modulation of their metabolic profile and generation of uridine. Silencing of AHRR interferes with Th17 cell differentiation and stabilizes Tregs in vitro. Further it limits inflammation and boosts intrahepatic immunoregulatory CD4 subsets in vivo, in a model of acute liver injury. As Th17 cells are an important effector subset that contributes to perpetuation of liver damage in AIH, blockade of AHRR might be considered an effective strategy to contain this lymphocyte subset and interfere with effector cell replenishment by blocking Treg conversion into Th17 cells.
Supplementary Material
Supplementary Fig. 1. Phenotype of IL17A producing cells and Tregs following CD4 T cell differentiation. CD4 cells were isolated from the peripheral blood of a healthy subject and exposed to Th17 (IL6, IL1β and TGF-β) or Treg (IL2 and TGF-β) polarizing conditions for five days. The frequency of IL17A producing lymphocytes and Tregs in polarized cells was measured by flow cytometry. (A-B) Cells were initially gated on live lymphocytes and subsequently on single cells and CD4 lymphocytes. (A) Expression of RORC, IL23R and CCR6 was measured in the CD4+IL17+ subset. Representative flow cytometry plots of FSC-H and SSC-H, FSC-H and FSC-A, CD4 Peridinin Chlorophyll Protein-Cyanine 5.5 (PerCP-Cy5.5) and FSC-A, and IL17A Brilliant Violet 605 (BV605) and FSC-A are shown. Histograms of RORC Allophycocyanin (APC), IL23R Fluorescein Isothiocyanate (FITC) and CCR6 Phycoerythrin (PE) are also shown. (B) Expression of CD25, CD127 and FOXP3 was measured in the Treg subset. Representative flow cytometry plots of FSC-H and SSC-H, FSC-H and FSC-A, CD4 PerCP-Cy5.5 and FSC-A and CD25 PE and FSC-A from one healthy subject are shown. Histograms of FOXP3 Pacific Blue (PB) and CD127 FITC are also shown. Cell frequencies and mean fluorescence intensity (MFI) are indicated in each plot or histogram. Gates were drawn based on fluorescence minus one (FMO) control staining.
Supplementary Fig. 2. AHRR levels in Th17 cells. Th17 cells were enriched as CCR6+CXCR3− lymphocytes from peripheral blood derived CD4 cells, as we previously reported [13, 25], and levels of AHRR measured by qPCR. Mean ± SEM AHRR mRNA levels (A) at baseline and (B) following exposure to unconjugated bilirubin (UCB) or L-kynurenine (L-kyn) (HS, n=5; AIH, n=5). Data in Panel B are expressed as fold change compared to untreated cells. Mean ± SEM AHRR mRNA levels in differentiated Th17 cells obtained from (C) AIH patients at remission (n=9) or during an episode of relapse (n=5); and from (D) patients treated with azathioprine alone (n=8) or in combination with prednisone or budesonide (n=5).
Supplementary Fig. 3. Effects of AHRR silencing on Th17 cell gene expression. Mean ± SEM (A) IL10, (B) IL22 and (C) IFNγ mRNA levels in Th17 cells differentiated from circulating CD4 cells and exposed to scramble (scr), AHRR siRNA, L-kynurenine (L-kyn), or AHRR siRNA plus L-kyn (HS, n=9–12; AIH, n=11–16). Results are expressed as fold change compared to scramble.
Supplementary Fig. 4. Concanavalin-A induced liver injury. (A) Six week-old female NOD/scid/gamma mice were injected with 2 × 10⁶ CD4 T cells. Three weeks later, mice were bled and checked for human chimerism. Those mice showing more than 10% human chimerism (75% of the originally transferred mice) were administered Concanavalin-A (Con-A) at 20 mg/kg i.v. and sacrificed four hours later. (B) Flow cytometry plots indicating reconstitution with human CD3+ cells in two representative mice. FSC-A and Brilliant Violet 785 (BV785) anti-human CD3 plots are shown. Percentage of CD3+ cells is indicated in each plot. (C) Mean ± SEM serum ALT levels in mice reconstituted with CD4 T cells but not exposed to Con-A (n=5), mice reconstituted with CD4 T cells and exposed to Con-A (n=8), and mice exposed to Con-A without prior CD4 T cell reconstitution (n=3). (D) Hematoxylin & Eosin and human CD3 staining of liver sections from one mouse reconstituted with CD4 T cells and not exposed to Con-A, one mouse reconstituted with CD4 T cells and exposed to Con-A, and one mouse exposed to Con-A without prior CD4 T cell reconstitution. Arrows indicate cellular infiltrate (original magnification, x10, scale bar: 200 μm). Data in Panel C were analyzed using one-way ANOVA test followed by Tukey’s multiple comparison test *P≤0.05; **P≤0.01.
Supplementary Fig. 5. Effects of AHRR silencing on splenocyte immune phenotype. NOD/scid/gamma mice, adoptively transferred with AHRR+ human CD4 T cells obtained from the peripheral blood of one healthy blood donor, were administered AHRR-FANA or scramble i.p. Seventy-two hours later mice were administered Con-A i.v. to induce liver injury and sacrificed 4 hours later. (A) Hematoxylin & Eosin and human CD3 staining of spleen sections (original magnification, x10, scale bar: 200 μm), obtained from representative scramble and AHRR-FANA treated mice. (B) Mean ± SEM frequency of splenic CD4+FOXP3+, CD4+CD39+, CD4+IL10+, CD4+IL17A+, CD4+IFNγ+ and IFNγ+ within CD4+IL17A+ cells in scramble (n=8) or AHRR-FANA (n=7) treated mice.
Supplementary Fig. 6. Silencing of AHRR boosts FOXP3+ and IL10+ CD4 subsets and contains CD4+IL17A+ cells within the liver. The frequency of FOXP3+, CD39+, IL10+, IL17A+ and IFNγ+ cells within CD4 and that of IFNγ+ cells within CD4+IL17A+ lymphocytes, obtained from the liver and spleen of NOD/scid/gamma mice exposed to Con-A and administered scramble or AHRR-FANA was determined by flow cytometry. Zebra plots of FSC-A and (A) FOXP3 allophycocyanin (APC), (B) CD39 Phycoerythrin (PE), (C) IL10 Brilliant Violet 421 (BV421), (D) IL17A Brilliant Violet 605 (BV605) and (E-F) IFNγ Alexa Fluor 700 (AF700) are shown. In (F) cells were initially gated on CD4+IL17A+ lymphocytes, then the frequency of IFNγ+ cells within this subset was measured. Cell frequencies are indicated in each plot. Gates were drawn based on fluorescence minus one (FMO) staining control. Silencing of AHRR boosts intrahepatic CD4+FOXP3+ and CD4+IL10+ cells and contains CD4+IL17A+ lymphocytes, while not having significant effects on the frequency of these cell subpopulations in the spleen.
Highlights.
In AIH, Th17 cells upregulate AHRR upon exposure to L-kynurenine
Silencing of AHRR boosts Th17 cell response to AhR activation in AIH
Silencing of AHRR limits Th17 cell differentiation in AIH
Silencing of AHRR modulates Th17 cell metabolic profile
Blockade of AHRR in vivo ameliorates T cell mediated liver injury in humanized mice
Funding
This work has been supported by the National Institutes of Health (R01 DK108894 and R01 DK124408 to M.S.L. and R21 AG065923 to S.C.R.); the Crohn’s and Colitis Foundation (Litwin IBD Pioneers Award to M.S.L.); grants VEGA 1/649/21 and APVV-21-0370 (to B.G.).
Abbreviations:
- AIH
autoimmune hepatitis
- AHR
aryl hydrocarbon receptor
- AHRR
aryl hydrocarbon receptor repressor
- ARNT
aryl hydrocarbon receptor nuclear translocator
- PBMCs
peripheral blood mononuclear cells
- Th17
T helper type 17
- Treg
regulatory T cell
- UCB
unconjugated bilirubin
- P5’N-1
5-prime-nucleotidase
- CDA
cytidine deaminase
- con-A
concanavalin-A
Footnotes
Publisher's Disclaimer: This is a PDF file of an unedited manuscript that has been accepted for publication. As a service to our customers we are providing this early version of the manuscript. The manuscript will undergo copyediting, typesetting, and review of the resulting proof before it is published in its final form. Please note that during the production process errors may be discovered which could affect the content, and all legal disclaimers that apply to the journal pertain.
Conflict of interest:
Nothing to disclose.
References
- [1].Heneghan MA, Yeoman AD, Verma S, Smith AD, Longhi MS. Autoimmune hepatitis. Lancet, 2013;382:1433–44. [DOI] [PubMed] [Google Scholar]
- [2].Longhi MS, Mieli-Vergani G, Vergani D. Regulatory T cells in autoimmune hepatitis: an updated overview. J Autoimmun, 2021;119:102619. [DOI] [PMC free article] [PubMed] [Google Scholar]
- [3].Longhi MS, Ma Y, Bogdanos DP, Cheeseman P, Mieli-Vergani G, Vergani D. Impairment of CD4(+)CD25(+) regulatory T-cells in autoimmune liver disease. J Hepatol, 2004;41:31–7. [DOI] [PubMed] [Google Scholar]
- [4].Longhi MS, Ma Y, Mitry RR, Bogdanos DP, Heneghan M, Cheeseman P et al. Effect of CD4+ CD25+ regulatory T-cells on CD8 T-cell function in patients with autoimmune hepatitis. J Autoimmun, 2005;25:63–71. [DOI] [PubMed] [Google Scholar]
- [5].Longhi MS, Hussain MJ, Mitry RR, Arora SK, Mieli-Vergani G, Vergani D et al. Functional study of CD4+CD25+ regulatory T cells in health and autoimmune hepatitis. J Immunol, 2006;176:4484–91. [DOI] [PubMed] [Google Scholar]
- [6].Liberal R, Grant CR, Holder BS, Ma Y, Mieli-Vergani G, Vergani D et al. The impaired immune regulation of autoimmune hepatitis is linked to a defective galectin-9/tim-3 pathway. Hepatology, 2012;56:677–86. [DOI] [PubMed] [Google Scholar]
- [7].Vuerich M, Wang N, Kalbasi A, Graham JJ, Longhi MS. Dysfunctional Immune Regulation in Autoimmune Hepatitis: From Pathogenesis to Novel Therapies. Front Immunol, 2021;12:746436. [DOI] [PMC free article] [PubMed] [Google Scholar]
- [8].Liberal R, Grant CR, Ma Y, Csizmadia E, Jiang ZG, Heneghan MA et al. CD39 mediated regulation of Th17-cell effector function is impaired in juvenile autoimmune liver disease. J Autoimmun, 2016;72:102–12. [DOI] [PMC free article] [PubMed] [Google Scholar]
- [9].Zhao L, Tang Y, You Z, Wang Q, Liang S, Han X et al. Interleukin-17 contributes to the pathogenesis of autoimmune hepatitis through inducing hepatic interleukin-6 expression. PLoS One, 2011;6:e18909. [DOI] [PMC free article] [PubMed] [Google Scholar]
- [10].Wu H, Tang S, Zhou M, Xue J, Yu Z, Zhu J. Tim-3 suppresses autoimmune hepatitis via the p38/MKP-1 pathway in Th17 cells. FEBS Open Bio, 2021;11:1406–16. [DOI] [PMC free article] [PubMed] [Google Scholar]
- [11].Beringer A, Miossec P. IL-17 and IL-17-producing cells and liver diseases, with focus on autoimmune liver diseases. Autoimmun Rev, 2018;17:1176–85. [DOI] [PubMed] [Google Scholar]
- [12].Grant CR, Liberal R, Holder BS, Cardone J, Ma Y, Robson SC et al. Dysfunctional CD39(POS) regulatory T cells and aberrant control of T-helper type 17 cells in autoimmune hepatitis. Hepatology, 2014;59:1007–15. [DOI] [PMC free article] [PubMed] [Google Scholar]
- [13].Vuerich M, Harshe R, Frank LA, Mukherjee S, Gromova B, Csizmadia E et al. Altered aryl-hydrocarbon-receptor signalling affects regulatory and effector cell immunity in autoimmune hepatitis. J Hepatol, 2021;74:48–57. [DOI] [PMC free article] [PubMed] [Google Scholar]
- [14].Quintana FJ, Basso AS, Iglesias AH, Korn T, Farez MF, Bettelli E et al. Control of T(reg) and T(H)17 cell differentiation by the aryl hydrocarbon receptor. Nature, 2008;453:65–71. [DOI] [PubMed] [Google Scholar]
- [15].Veldhoen M, Hirota K, Westendorf AM, Buer J, Dumoutier L, Renauld JC et al. The aryl hydrocarbon receptor links TH17-cell-mediated autoimmunity to environmental toxins. Nature, 2008;453:106–9. [DOI] [PubMed] [Google Scholar]
- [16].Gutierrez-Vazquez C, Quintana FJ. Regulation of the Immune Response by the Aryl Hydrocarbon Receptor. Immunity, 2018;48:19–33. [DOI] [PMC free article] [PubMed] [Google Scholar]
- [17].Harper PA, Riddick DS, Okey AB. Regulating the regulator: factors that control levels and activity of the aryl hydrocarbon receptor. Biochem Pharmacol, 2006;72:267–79. [DOI] [PubMed] [Google Scholar]
- [18].Vogel CFA, Haarmann-Stemmann T. The aryl hydrocarbon receptor repressor - More than a simple feedback inhibitor of AhR signaling: Clues for its role in inflammation and cancer. Curr Opin Toxicol, 2017;2:109–19. [DOI] [PMC free article] [PubMed] [Google Scholar]
- [19].Deaglio S, Dwyer KM, Gao W, Friedman D, Usheva A, Erat A et al. Adenosine generation catalyzed by CD39 and CD73 expressed on regulatory T cells mediates immune suppression. J Exp Med, 2007;204:1257–65. [DOI] [PMC free article] [PubMed] [Google Scholar]
- [20].Allard B, Longhi MS, Robson SC, Stagg J. The ectonucleotidases CD39 and CD73: Novel checkpoint inhibitor targets. Immunol Rev, 2017;276:121–44. [DOI] [PMC free article] [PubMed] [Google Scholar]
- [21].Vuerich M, Robson SC, Longhi MS. Ectonucleotidases in Intestinal and Hepatic Inflammation. Front Immunol, 2019;10:507. [DOI] [PMC free article] [PubMed] [Google Scholar]
- [22].Quintana FJ, Sherr DH. Aryl hydrocarbon receptor control of adaptive immunity. Pharmacol Rev, 2013;65:1148–61. [DOI] [PMC free article] [PubMed] [Google Scholar]
- [23].Mezrich JD, Fechner JH, Zhang X, Johnson BP, Burlingham WJ, Bradfield CA. An interaction between kynurenine and the aryl hydrocarbon receptor can generate regulatory T cells. J Immunol, 2010;185:3190–8. [DOI] [PMC free article] [PubMed] [Google Scholar]
- [24].Lytton SD, Osiecki M, Wozniak Malgorzata, Cukrowska B, Wierzbicka A, Goliszek M et al. Tryptophan-kynurenine profile in pediatric autoimmune hepatitis. Immunol Res, 2019;67:39–47. [DOI] [PubMed] [Google Scholar]
- [25].Longhi MS, Vuerich M, Kalbasi A, Kenison JE, Yeste A, Csizmadia E et al. Bilirubin suppresses Th17 immunity in colitis by upregulating CD39. JCI Insight, 2017;2. [DOI] [PMC free article] [PubMed] [Google Scholar]
- [26].Lee SS, Gao W, Mazzola S, Thomas MN, Csizmadia E, Otterbein LE et al. Heme oxygenase-1, carbon monoxide, and bilirubin induce tolerance in recipients toward islet allografts by modulating T regulatory cells. FASEB journal : official publication of the Federation of American Societies for Experimental Biology, 2007;21:3450–7. [DOI] [PubMed] [Google Scholar]
- [27].Rocuts F, Zhang X, Yan J, Yue Y, Thomas M, Bach FH et al. Bilirubin promotes de novo generation of T regulatory cells. Cell transplantation, 2010;19:443–51. [DOI] [PubMed] [Google Scholar]
- [28].Vetvicka V, Sima P, Miler I, Bilej M. The immunosuppressive effects of bilirubin. Folia microbiologica, 1991;36:112–9. [DOI] [PubMed] [Google Scholar]
- [29].Allegri G, Bertazzo A, Biasiolo M, Costa CV, Ragazzi E. Kynurenine pathway enzymes in different species of animals. Adv Exp Med Biol, 2003;527:455–63. [DOI] [PubMed] [Google Scholar]
- [30].Morrison C, Bandara K, Wang W, Zhang L, Figueroa B Jr. Improvement of growth rates through nucleoside media supplementation of CHO clones. Cytotechnology, 2019;71:733–42. [DOI] [PMC free article] [PubMed] [Google Scholar]
- [31].Amitani M, Cheng KC, Asakawa A, Amitani H, Kairupan TS, Sameshima N et al. Allantoin ameliorates chemically-induced pancreatic beta-cell damage through activation of the imidazoline I3 receptors. PeerJ, 2015;3:e1105. [DOI] [PMC free article] [PubMed] [Google Scholar]
- [32].Yuan M, Breitkopf SB, Yang X, Asara JM. A positive/negative ion-switching, targeted mass spectrometry-based metabolomics platform for bodily fluids, cells, and fresh and fixed tissue. Nat Protoc, 2012;7:872–81. [DOI] [PMC free article] [PubMed] [Google Scholar]
- [33].Tiegs G, Hentschel J, Wendel A. A T cell-dependent experimental liver injury in mice inducible by concanavalin A. J Clin Invest, 1992;90:196–203. [DOI] [PMC free article] [PubMed] [Google Scholar]
- [34].Liu Y, Hao H, Hou T. Concanavalin A-induced autoimmune hepatitis model in mice: Mechanisms and future outlook. Open Life Sci, 2022;17:91–101. [DOI] [PMC free article] [PubMed] [Google Scholar]
- [35].Schmidtke JR, Hatfield S. Activation of purified human T cells by mitogens: diminished mitogen-induced deoxyribonucleic acid synthesis in human T cells compared with autologous peripheral blood lymphocytes. Infect Immun, 1976;13:1061–8. [DOI] [PMC free article] [PubMed] [Google Scholar]
- [36].Persson U, Johansson SG. Concanavalin A-induced activation of human T cell subpopulations. Int Arch Allergy Appl Immunol, 1984;75:337–44. [DOI] [PubMed] [Google Scholar]
- [37].Kuritani T, Hirano T, Kishimoto T, Yamamura Y. In vitro immune response of human peripheral lymphocytes. II. Properties and functions of concanavalin A-induced suppressor T cells. Microbiol Immunol, 1979;23:185–96. [DOI] [PubMed] [Google Scholar]
- [38].Harshe RP, Xie A, Vuerich M, Frank LA, Gromova B, Zhang H et al. Endogenous antisense RNA curbs CD39 expression in Crohn’s disease. Nat Commun, 2020;11:5894. [DOI] [PMC free article] [PubMed] [Google Scholar]
- [39].Vuerich M, Wang N, Graham JJ, Gao L, Zhang W, Kalbasi A et al. Blockade of PGK1 and ALDOA enhances bilirubin control of Th17 cells in Crohn’s disease. Commun Biol, 2022;5:994. [DOI] [PMC free article] [PubMed] [Google Scholar]
- [40].Morsy MA, Norman PJ, Mitry R, Rela M, Heaton ND, Vaughan RW. Isolation, purification and flow cytometric analysis of human intrahepatic lymphocytes using an improved technique. Lab Invest, 2005;85:285–96. [DOI] [PubMed] [Google Scholar]
- [41].Xie A, Robles RJ, Mukherjee S, Zhang H, Feldbrugge L, Csizmadia E et al. HIF-1alpha-induced xenobiotic transporters promote Th17 responses in Crohn’s disease. J Autoimmun, 2018;94:122–33. [DOI] [PMC free article] [PubMed] [Google Scholar]
- [42].Zhang Y, Guo S, Xie C, Fang J. Uridine Metabolism and Its Role in Glucose, Lipid, and Amino Acid Homeostasis. Biomed Res Int, 2020;2020:7091718. [DOI] [PMC free article] [PubMed] [Google Scholar]
- [43].Yamamoto T, Koyama H, Kurajoh M, Shoji T, Tsutsumi Z, Moriwaki Y. Biochemistry of uridine in plasma. Clin Chim Acta, 2011;412:1712–24. [DOI] [PubMed] [Google Scholar]
- [44].Maiuolo J, Oppedisano F, Gratteri S, Muscoli C, Mollace V. Regulation of uric acid metabolism and excretion. Int J Cardiol, 2016;213:8–14. [DOI] [PubMed] [Google Scholar]
- [45].Cicero AFG, Fogacci F, Di Micoli V, Angeloni C, Giovannini M, Borghi C. Purine Metabolism Dysfunctions: Experimental Methods of Detection and Diagnostic Potential. Int J Mol Sci, 2023;24. [DOI] [PMC free article] [PubMed] [Google Scholar]
- [46].Longhi MS, Moss A, Bai A, Wu Y, Huang H, Cheifetz A et al. Characterization of human CD39+ Th17 cells with suppressor activity and modulation in inflammatory bowel disease. PLoS One, 2014;9:e87956. [DOI] [PMC free article] [PubMed] [Google Scholar]
- [47].Longhi MS, Liberal R, Holder B, Robson SC, Ma Y, Mieli-Vergani G et al. Inhibition of interleukin-17 promotes differentiation of CD25(−) cells into stable T regulatory cells in patients with autoimmune hepatitis. Gastroenterology, 2012;142:1526–35 e6. [DOI] [PubMed] [Google Scholar]
- [48].Jeengar MK, Thummuri D, Magnusson M, Naidu VGM, Uppugunduri S. Uridine Ameliorates Dextran Sulfate Sodium (DSS)-Induced Colitis in Mice. Sci Rep, 2017;7:3924. [DOI] [PMC free article] [PubMed] [Google Scholar]
- [49].Chenna Narendra S, Chalise JP, Magnusson M, Uppugunduri S. Local but Not Systemic Administration of Uridine Prevents Development of Antigen-Induced Arthritis. PLoS One, 2015;10:e0141863. [DOI] [PMC free article] [PubMed] [Google Scholar]
- [50].Brandstatter O, Schanz O, Vorac J, Konig J, Mori T, Maruyama T et al. Balancing intestinal and systemic inflammation through cell type-specific expression of the aryl hydrocarbon receptor repressor. Sci Rep, 2016;6:26091. [DOI] [PMC free article] [PubMed] [Google Scholar]
- [51].Panda SK, Peng V, Sudan R, Ulezko Antonova A, Di Luccia B, Ohara TE et al. Repression of the aryl-hydrocarbon receptor prevents oxidative stress and ferroptosis of intestinal intraepithelial lymphocytes. Immunity, 2023;56:797–812 e4. [DOI] [PMC free article] [PubMed] [Google Scholar]
Associated Data
This section collects any data citations, data availability statements, or supplementary materials included in this article.
Supplementary Materials
Supplementary Fig. 1. Phenotype of IL17A producing cells and Tregs following CD4 T cell differentiation. CD4 cells were isolated from the peripheral blood of a healthy subject and exposed to Th17 (IL6, IL1β and TGF-β) or Treg (IL2 and TGF-β) polarizing conditions for five days. The frequency of IL17A producing lymphocytes and Tregs in polarized cells was measured by flow cytometry. (A-B) Cells were initially gated on live lymphocytes and subsequently on single cells and CD4 lymphocytes. (A) Expression of RORC, IL23R and CCR6 was measured in the CD4+IL17+ subset. Representative flow cytometry plots of FSC-H and SSC-H, FSC-H and FSC-A, CD4 Peridinin Chlorophyll Protein-Cyanine 5.5 (PerCP-Cy5.5) and FSC-A, and IL17A Brilliant Violet 605 (BV605) and FSC-A are shown. Histograms of RORC Allophycocyanin (APC), IL23R Fluorescein Isothiocyanate (FITC) and CCR6 Phycoerythrin (PE) are also shown. (B) Expression of CD25, CD127 and FOXP3 was measured in the Treg subset. Representative flow cytometry plots of FSC-H and SSC-H, FSC-H and FSC-A, CD4 PerCP-Cy5.5 and FSC-A and CD25 PE and FSC-A from one healthy subject are shown. Histograms of FOXP3 Pacific Blue (PB) and CD127 FITC are also shown. Cell frequencies and mean fluorescence intensity (MFI) are indicated in each plot or histogram. Gates were drawn based on fluorescence minus one (FMO) control staining.
Supplementary Fig. 2. AHRR levels in Th17 cells. Th17 cells were enriched as CCR6+CXCR3− lymphocytes from peripheral blood derived CD4 cells, as we previously reported [13, 25], and levels of AHRR measured by qPCR. Mean ± SEM AHRR mRNA levels (A) at baseline and (B) following exposure to unconjugated bilirubin (UCB) or L-kynurenine (L-kyn) (HS, n=5; AIH, n=5). Data in Panel B are expressed as fold change compared to untreated cells. Mean ± SEM AHRR mRNA levels in differentiated Th17 cells obtained from (C) AIH patients at remission (n=9) or during an episode of relapse (n=5); and from (D) patients treated with azathioprine alone (n=8) or in combination with prednisone or budesonide (n=5).
Supplementary Fig. 3. Effects of AHRR silencing on Th17 cell gene expression. Mean ± SEM (A) IL10, (B) IL22 and (C) IFNγ mRNA levels in Th17 cells differentiated from circulating CD4 cells and exposed to scramble (scr), AHRR siRNA, L-kynurenine (L-kyn), or AHRR siRNA plus L-kyn (HS, n=9–12; AIH, n=11–16). Results are expressed as fold change compared to scramble.
Supplementary Fig. 4. Concanavalin-A induced liver injury. (A) Six week-old female NOD/scid/gamma mice were injected with 2 × 10⁶ CD4 T cells. Three weeks later, mice were bled and checked for human chimerism. Those mice showing more than 10% human chimerism (75% of the originally transferred mice) were administered Concanavalin-A (Con-A) at 20 mg/kg i.v. and sacrificed four hours later. (B) Flow cytometry plots indicating reconstitution with human CD3+ cells in two representative mice. FSC-A and Brilliant Violet 785 (BV785) anti-human CD3 plots are shown. Percentage of CD3+ cells is indicated in each plot. (C) Mean ± SEM serum ALT levels in mice reconstituted with CD4 T cells but not exposed to Con-A (n=5), mice reconstituted with CD4 T cells and exposed to Con-A (n=8), and mice exposed to Con-A without prior CD4 T cell reconstitution (n=3). (D) Hematoxylin & Eosin and human CD3 staining of liver sections from one mouse reconstituted with CD4 T cells and not exposed to Con-A, one mouse reconstituted with CD4 T cells and exposed to Con-A, and one mouse exposed to Con-A without prior CD4 T cell reconstitution. Arrows indicate cellular infiltrate (original magnification, x10, scale bar: 200 μm). Data in Panel C were analyzed using one-way ANOVA test followed by Tukey’s multiple comparison test *P≤0.05; **P≤0.01.
Supplementary Fig. 5. Effects of AHRR silencing on splenocyte immune phenotype. NOD/scid/gamma mice, adoptively transferred with AHRR+ human CD4 T cells obtained from the peripheral blood of one healthy blood donor, were administered AHRR-FANA or scramble i.p. Seventy-two hours later mice were administered Con-A i.v. to induce liver injury and sacrificed 4 hours later. (A) Hematoxylin & Eosin and human CD3 staining of spleen sections (original magnification, x10, scale bar: 200 μm), obtained from representative scramble and AHRR-FANA treated mice. (B) Mean ± SEM frequency of splenic CD4+FOXP3+, CD4+CD39+, CD4+IL10+, CD4+IL17A+, CD4+IFNγ+ and IFNγ+ within CD4+IL17A+ cells in scramble (n=8) or AHRR-FANA (n=7) treated mice.
Supplementary Fig. 6. Silencing of AHRR boosts FOXP3+ and IL10+ CD4 subsets and contains CD4+IL17A+ cells within the liver. The frequency of FOXP3+, CD39+, IL10+, IL17A+ and IFNγ+ cells within CD4 and that of IFNγ+ cells within CD4+IL17A+ lymphocytes, obtained from the liver and spleen of NOD/scid/gamma mice exposed to Con-A and administered scramble or AHRR-FANA was determined by flow cytometry. Zebra plots of FSC-A and (A) FOXP3 allophycocyanin (APC), (B) CD39 Phycoerythrin (PE), (C) IL10 Brilliant Violet 421 (BV421), (D) IL17A Brilliant Violet 605 (BV605) and (E-F) IFNγ Alexa Fluor 700 (AF700) are shown. In (F) cells were initially gated on CD4+IL17A+ lymphocytes, then the frequency of IFNγ+ cells within this subset was measured. Cell frequencies are indicated in each plot. Gates were drawn based on fluorescence minus one (FMO) staining control. Silencing of AHRR boosts intrahepatic CD4+FOXP3+ and CD4+IL10+ cells and contains CD4+IL17A+ lymphocytes, while not having significant effects on the frequency of these cell subpopulations in the spleen.