

Abstract
IL-23-activation of IL-17 producing T cells is involved in many rheumatic diseases. Herein, we investigate the role of IL-23 in the activation of myeloid cell subsets that contribute to skin inflammation in mice and man. IL-23 gene transfer in WT, IL-23RGFP reporter mice and subsequent analysis with spectral cytometry show that IL-23 regulates early innate immune events by inducing the expansion of a myeloid MDL1+CD11b+Ly6G+ population that dictates epidermal hyperplasia, acanthosis, and parakeratosis; hallmark pathologic features of psoriasis. Genetic ablation of MDL-1, a major PU.1 transcriptional target during myeloid differentiation exclusively expressed in myeloid cells, completely prevents IL-23-pathology. Moreover, we show that IL-23-induced myeloid subsets are also capable of producing IL-17A and IL-23R+MDL1+ cells are present in the involved skin of psoriasis patients and gene expression correlations between IL-23 and MDL-1 have been validated in multiple patient cohorts. Collectively, our data demonstrate a novel role of IL-23 in MDL-1-myelopoiesis that is responsible for skin inflammation and related pathologies. Our data open a new avenue of investigations regarding the role of IL-23 in the activation of myeloid immunoreceptors and their role in autoimmunity.
Keywords: Arthritis, Psoriatic, Autoimmune Diseases, Inflammation, Autoimmunity
1. Introduction
IL-23 is a pleiotropic cytokine which is involved in many autoimmune diseases including psoriasis and psoriatic arthritis [1, 2]. IL-23 is critical for a plethora of immune responses, including the differentiation, survival, and expansion of Th17, γδ T cells and neutrophils [3, 4]. Although the effects of IL-23 in the lymphoid cells have been extensively studied in relation to IL-17A production, less is known regarding the effects of IL-23 on myeloid cells. Despite multiple studies demonstrating the importance of IL-23 and its effector signaling in myelopoiesis and the recruitment and activation of neutrophils, the exact cellular and molecular pathways that govern pathogenesis remain elusive [4–8].
We have previously demonstrated that IL-23 induces myelopoiesis in the bone marrow and induces Myeloid DAP12-associated lectin 1 (MDL-1) which is associated with osteoclast activation and arthritis [9–11]. MDL-1 also known as CLEC5A is a C-type lectin, (herein referred to as MDL-1) is exclusively expressed on myeloid cells and is a major PU.1 transcriptional target during myeloid differentiation regulating a number of myeloid-dependent immune and inflammatory responses including differentiation, activation and cell recruitment during inflammation [9, 12–15]. Flaviviruses and Listeria monocytogenes stimulate MDL-1 to induce proinflammatory cytokine production [16, 17], canonical inflammasome activation and neutrophil extracellular trap (NET) formation [18, 19], while MDL-1 deficiency impairs the development of intestinal gamma/delta T cells after L. monocytogenes infection [19]. MDL-1 is a key regulator of synovial injury and bone erosion during autoimmune joint inflammation [9] and dengue virus infection [20]. Furthermore, MDL-1+ immature myeloid cells are responsive for ConA-induced liver inflammation [21]. All these observations suggest that MDL-1 plays a critical role in septic and aseptic inflammatory reactions.
Herein, we show that genetic ablation of MDL-1 prevents IL-23-induced skin inflammation demonstrating the importance of myelopoiesis in IL-23-induced pathology. Our data show that MDL-1 is critical for the development and maturation of promyelocytes to IL-17A+ neutrophils in the skin that regulate skin pathology. Collectively our data demonstrate MDL-1 as a transcriptional target in IL-23-induced skin pathology that can be exploited for therapeutic intervention.
2. Material and methods
2.1. Study design
C57BL/6 mice were purchased from Jackson Laboratories. IL-23RGFP+/+ and Mdl-1−/− mice were obtained from Dr. Kuchroo (Harvard Medical School) and Dr. Hsieh (National Yang-Ming University, Taiwan), respectively as previously described [16, 22]. For each experiment, at least two experimental replicates were performed. Mice were selected and assigned to their groups based on their body weights at the time each experiment started. Sex- and age-matched mice (8–12 weeks) were used for all experiments under specific pathogen-free conditions.
2.2. Reagents
DyLight 650-Phalloidin was purchased from Thermo Fisher Scientific, and IL-23 ELISA kit was purchased from eBioscience. Monoclonal antibodies of anti-Ly6G (1A8), MDL-1 (226402) and anti-γδTCR (GL3) were purchased from R&D Systems, CD11b (M1/70) from ebioscience, and GFP conjugated FITC (FM264G), CD3ε (145–2C1), CXC3R1 (SA011F11), B220 (RA3–6B2), Ter119 (TER-119), CSF1R (AFS98), Ly6C (HK1.4), CD61 (2C9.G2), CD45 (30-F11,) Ly6G (1A8), CD11b (M1/70) and IL-17A (1A8) from BioLegend.
2.3. Purification of GFP and IL-23 minicircle (MC) DNA and hydrodynamic gene delivery
Minicircle-RSV.Flag.mIL23.elasti.bpA or RSV.eGFP.bpA (IL-23MC) was produced as previously described, and Episomal DNA minicircle (MC) were prepared using EndoFree Megaprep plasmid purification kit (Qiagen) [11]. Fifteen micrograms of IL-23 or GFP MC DNA was injected hydrodynamically via tail vein delivery. We analyzed serum 1-day post gene transfer with an IL-23 ELISA, and collected bone marrow (BM), dorsal skin and ears for analysis on indicated days post gene transfer.
2.4. Spectral Flow cytometry and high-dimensional analysis
Murine dorsal skin was minced and incubated with 1 U/ml of Dispase for 2 h at 37°C, followed by addition of collagenase D for 30 min. BM cells were flushed out with PBS. Red blood cells were lysed with BD Pharm Lyse (BD Biosciences). Cells were pre-incubated with anti-CD16/32 (BD Biosciences) and then incubated with appropriate antibodies and analyzed on a CytoFLEX LX (Beckman Coulter). The data were analyzed using FlowJo (BD Biosciences). AccuCheck counting beads (Life Technologies) were used to determine absolute cell number. BM cells were analyzed on Cytek Aurora cytometer and among B220−CD3−Ter119−CSF1R+ cells, clustering algorithm was conducted by FlowSOM based on the marker expression of CD11b, Ly6G, Ly6C, CD45, CX3CR1, MDL1 and CD61. As this method is highly sensitive and vulnerable to batch effect, FlowSOM were conducted on single experiment using to avoid confounding bias [23]. The FlowSOM clusters was also displayed on top of the t-SNE axes to visualize each cluster.
2.5. RNA isolation and Real-time PCR
RNA was isolated from mouse tissues using the RNeasy kit (Qiagen) including a DNase I digest step. Quality of RNA was analyzed with a Nanodrop spectrophotometer (Thermo Fisher Scientific). cDNA was prepared using iScript cDNA Synthesis Kit (Bio-Rad). qRT-PCR was performed using iTaq Universal SYBR Green Supermix (Bio-Rad) as previously described [24]. Relative expression of target genes was performed using the 2−ΔΔCT method and normalized with internal GAPDH control. Relative expression of target genes was performed using the 2−ΔΔCT method and normalized with internal GAPDH control as previously described [11].
2.6. RNAseq and RNAseq meta-analysis
RNA was isolated from murine ears of WT or Mdl-1−/− mice injected with GFP MC either IL-23 MC. The 3’Tag RNA-Seq run was performed on an Illumina HiSeq 4000 and generated an average of 600,000 reads per sample. RNA-Seq reads for the 9 individual samples including three groups: control (WT+GFP MC), treatment (WT+IL-23 MC), and mutant (Mdl-1−/−+IL-23 MC) and three replicates each) were independently aligned to the mouse genome (ref. ID: GRCh38.p6) using the STAR v2.7.0a alignment software with the corresponding Ensembl reference genome. The read results from alignment are shown in Supplemental Table 1. The featureCounts package and edgeR package were used to count the mapped reads and for subsequent differential expression analysis. After excluding genes with low expression (less than three mapped reads), the data were normalized using the Trimmed Means of M values (TMM) method. A negative binomial distribution was used to model the variance of the read counts per gene. DEGs are defined by a fold change >2.0 or <0.5 and q-value (FDR-adjusted p-value) < 0.05. A gene-set enrichment analysis using gProfiler, in which we identified and examined the top 10 gene ontology processes for both upregulated and downregulated DEGs separately. A protein-protein interaction network was generated in which genes from interested gene groups were shown relative to detected gene clusters. The KEGG database was used in conjunction with R’s GOChord package to identify relevant pathways activated by genes in our interested gene groups. The RNA-Seq data is deposited in the NCBI’s Gene Expression Omnibus (GEO) database and are accessible through GEO Series under the accession number GSE133830.
For human RNA-Seq meta-analysis, RNA-Seq FASTQ files of psoriasis lesional skin were downloaded from the NCBI Sequence Read Archive (http://www.ncbi.nlm.nih.gov/Traces/sra). Four total datasets (Supplemental Table 5) were used. All statistical analysis was done using R software. Correlation analyses of gene expressions were performed on read counts of each identified gene normalized with DESeq2 package. Values were subsequently log transformed and winsorized. Spearman’s correlation coefficients (rs) were calculated in R using the cor.test function, which was also used to estimate P values of the correlations by algorithm AS 89. Meta-analyses were conducted to assess findings across the multiple datasets using R package “metafor”. A weighted random-effects model was used to estimate a summary effect size. Restricted maximum-likelihood estimator was selected to estimate between-study variance. Weighted estimation with inverse-variance weights was used to fit the model.
2.7. H&E and Immunohistochemistry
Murine skin and ears were fixed in 10% formalin in PBS and paraffin embedded for sectioning (6 μm). Tissue sections were stained with hematoxylin and eosin Y (Sigma). Photos were visualized and analyzed by Olympus BX61 microscope and BZ-II Analyzer software. Analysis and quantification were performed using ImageJ software. Histology sections were stained for immunofluorescence as previously described [25] and visualized using a confocal microscope (Nikon C1).
Skin biopsies were fixed in 10% formalin for 48-hours and paraffin embedded for sectioning (4 μm) for either: 1) Hematoxylin and Eosin (H&E) or 2) Chloroacetate Esterase. The stained sections were digitized using a slide imaging system (Olympus VS120). For immunofluorescence, sections were blocked and stained with goat anti-IL-17 (AF-317-NA, R&D systems), mouse anti-CD66b (NB100–77808SS. Novus Biologicals), and rabbit anti-MRP8 (SA100A8), (EPR3554, Ab92331. Abcam) antibodies. Primary antibodies were detected with AF568 donkey anti-goat IgG (A11057. ThermoFisher), AF488 donkey anti-rabbit and AF647 donkey anti-mouse (715-606-150, Jackson ImmunoResearch Laboratories). Representative images were taken with a Zeiss Axio Microscope and recorded with AxioCam MRM.
2.8. LPS stimulation of bone marrow myeloid cells
BM myeloid cells were magnetically sorted twice using CD11b MicroBeads (130-126-725, Miltenyi Biotec). Sorted myeloid cells were stimulated with vehicle or 100 ng/ml LPS for 4 hours and RNA were extracted for subsequent qRT-PCR as previously described [26].
2.9. Patient selection
Two healthy volunteers, six patients with PsA and nine patients with PsO who were previously untreated and sex-matched were recruited in this study. The clinical characteristic of patients with PSA are as follows: (Mean ± SEM; Age = 54.2 ± 7.17 years; DAPSA = 45.3 ± 9.39; PASI = 7.92 ± 1.77). The clinical characteristics of patients with PsO are as follows: (Mean ± SEM; Age = 58.0 ± 6.42 years; PASI = 2.72 ± 0.73).
2.10. Statistical analysis
Statistical differences were analyzed by Mann–Whitney test. All results are representative of at least 3 independent experiments, unless otherwise stated. Statistically significant differences were considered as P < 0.05 (*P < 0.05, **P < 0.01, ***P < 0.001). Data represent mean ± SEM (standard error of the mean) of three independent experiments.
2.11. Study approval
All animal protocols (protocol #20010 and #20845) were approved by Institutional Animal Care and Use Committee, BIDMC/Harvard University. Human studies were reviewed and approved by BIDMC and University of Rochester, Institutional Review Boards. Written informed consent was received from each participant prior to collection of psoriatic skin biopsies.
3. Results
3.1. IL-23-mediated skin pathology induces IL-23R+MDL-1+ myeloid cells.
In order to investigate the effects of IL-23 in the skin we performed IL-23 gene transfer in C57BL/6 mice. (Supplemental Fig. 1a, b). IL-23 gene transfer induced erythema with silvery white scales in ears 21 days post IL-23 MC injection (Fig. 1a). Histological examination revealed a significant epidermal hyperplasia, and thickness of epidermis (Fig. 1b, c), accompanied by an increased inflammatory infiltrate with a distinct formation of neutrophil exudates (Munro’s microabscesses) (Fig. 1b, d). Similar pathology to the ears was observed in the murine dorsal skin (data not shown) whereas neither control, (GFP MC), nor IL-23RGFP+/+ mice (IL-23RGFP+/+ is a non-functional IL-23R) showed any pathology (Fig. 1a–d). The observed pathology correlated with an elevated pattern in genes associated with keratinocyte proliferation and skin inflammation including K16, S100a7, S100a8, S100a9, Cxcl-1, Cxcl-2, Tnf, Il-17, Il-17ra, Il-23r, and Il-22 in ears, compared with control (GFP MC) and IL-23RGFP+/+ mice (Fig. 1e and Supplemental Fig. 1c). The elevated pattern in genes associated with keratinocyte proliferation and skin inflammation was also observed in the murine dorsal skin compared with control (GFP MC) and IL-23RGFP+/+ mice (Supplemental Fig. 1d). Furthermore, immunofluorescence staining demonstrated the presence of epidermal MDL-1+LY6G+ neutrophils and MDL1+IL-23R+ cells in IL-23 MC gene transfer mice, whereas this population was undetected in GFP MC controls (Fig. 1f). Consistent with the histological phenotype, we found an expansion of the CD11b+CD45+ myeloid cell population (Mean ± SEM; WT+GFP MC = 0.54% ± 0.14; WT+IL-23 MC = 7.01% ± 2.09) that included CD11b+Ly6G+ neutrophils (WT+GFP MC = 14.47% ± 3.11 and WT+IL-23 MC = 68.67% ± 7.79), by flow cytometric analysis in the skin post IL-23 gene transfer (Fig. 1g–i). In keeping with these observations, an elevation of myeloid cells markers Cd11b, Cd14, Mdl-1, and Mpo confirmed the myeloid expansion in the skin of IL-23 MC gene transfer mice compared to the control (GFP MC) and/or IL-23RGFP+/+ mice (Fig. 1j).
Fig. 1: IL-23-induced skin pathology depends on IL-23R signaling and correlates with increased number of epidermal MDL-1+ cells.

(a) Photographs of murine ears 21 days post IL-23 MC gene transfer showing the development of silvery white scales in WT mice compared to GFP MC and/or IL-23RGFP+/+. (b) H&E staining of murine ears showing epidermal hyperplasia and number of infiltrated cells. Arrow indicates neutrophil exudates (Munro’s microabscess). (Images are representative of three independent experiments and 9–11 mice per each group. Scale bars, 100 μm). (c) Quantification of epidermal thickness (μm) and (d) infiltrated cell number. (e) Gene expression analysis of inflammatory markers showing an elevation of K16, S100a7, S100a8, S100a9, Cxcl-1, and Cxcl-2 in the ears of IL-23 MC gene transfer WT mice and/or IL-23RGFP+/+ mice compared to GFP MC (control). (f) H&E and immunofluorescence images of staining with DAPI (blue), MDL-1-PE (red), LY6G-FITC (green) and DAPI (blue), MDL-1-FITC (green), IL-23R-PE (red) showing an increase of epidermal MDL-1+IL-23R+ neutrophils (orange) in the ears of IL-23 MC gene transfer mice compared to GFP MC (control) mice. Scale bars, 100 μm. (g) Flow cytometric analysis of murine dorsal skin post IL-23 MC gene transfer, showing an expansion of (h) CD11b+CD45+ cells and (i) CD11b+CD45+Ly6G+, cells compared to GFP MC (control) mice. (j) Gene expression analysis of murine ear post IL-23 gene transfer showing an elevation of Cd11b, Cd14, Mdl-1, and Mpo compared to GFP MC (control) and or IL-23RGFP+/+ mice. Data represent mean ± SEM of three independent experiments. *P<0.05; ** P<0.01; *** P<0.001 by Mann-Whitney.
3.2. IL-23 induces the expansion of MDL-1+ cell subsets in the bone marrow and skin
We and others have previously demonstrated that IL-23 induces myelopoiesis in the bone marrow which leads to T-cell independent IL-17A expression and skin inflammation, however the exact mechanisms remain elusive [11, 25, 27, 28]. To identify the effect of IL-23 in myeloid cells, we performed spectral cytometry on bone marrow cells isolated 6 days post IL-23 gene transfer using an extensive panel of myeloid specific antibodies (Fig. 2a). We focused our analysis on myeloid precursors by gating on the B220, CD3, Ter119 negative and c-fms positive population (Fig. 2b). Among this myeloid population, we integrated the data of GFP and IL-23 gene transfer and conducted an unsupervised clustering algorithm with a combination of tSNE and FlowSOM (flow cytometry data analysis using self-organizing maps) showing 10 distinct populations (Fig. 2c, d). The clustering was based on the expression level of CD11b, Ly6G, Ly6C, CD45, CX3CR1 (C-X3-C Motif Chemokine Receptor 1), MDL1 and CD61 (β3-integrin) (Fig. 2d). Our data demonstrate that IL-23 induced a dynamic change in the myeloid populations by dissecting the origin of the t-SNE mapping (Fig. 2e), and particularly induced an expansion of MDL-1+ cells in the bone marrow (MDL-1+CD11b+ and MDL-1+CD11b+Ly6G+ cells) (Fig. 2f, Supplemental Fig. 2a). Our quantitative analysis using percentages and absolute cell counts demonstrated that there was a significant increase of MDL-1+CD11b+ and MDL-1+CD11b+Ly6G+ cells (Fig. 2g). Next, we “followed” the inflammation for 21 days and detected the same MDL-1+CD11b+Ly6G+ neutrophils in the inflamed ear skin, which were more profoundly expanded compared to the bone marrow (Fig. 2h). Again, quantitative analysis using percentages and absolute cell counts demonstrated that IL-23 induced an increase of MDL-1+CD11b+Ly6G+ neutrophils in the skin compared to GFP controls (Fig. 2i). Importantly, we determined that IL-23 induced IL-17A in this MDL-1+CD11b+Ly6G+ neutrophil subset compared to the GFP controls (Mean ± SEM; WT+GFP MC = 0.46% ± 0.10; WT+IL-23 MC = 9.12% ± 0.77) (Fig. 2h, i). Collectively, our data indicate that IL-23 induces MDL-1+CD11b+ cells in the bone marrow that could migrate to the skin and are capable of producing IL-17A.
Fig. 2. IL-23 induces the expansion of MDL-1+ cell subsets in the bone marrow that migrate to the skin.
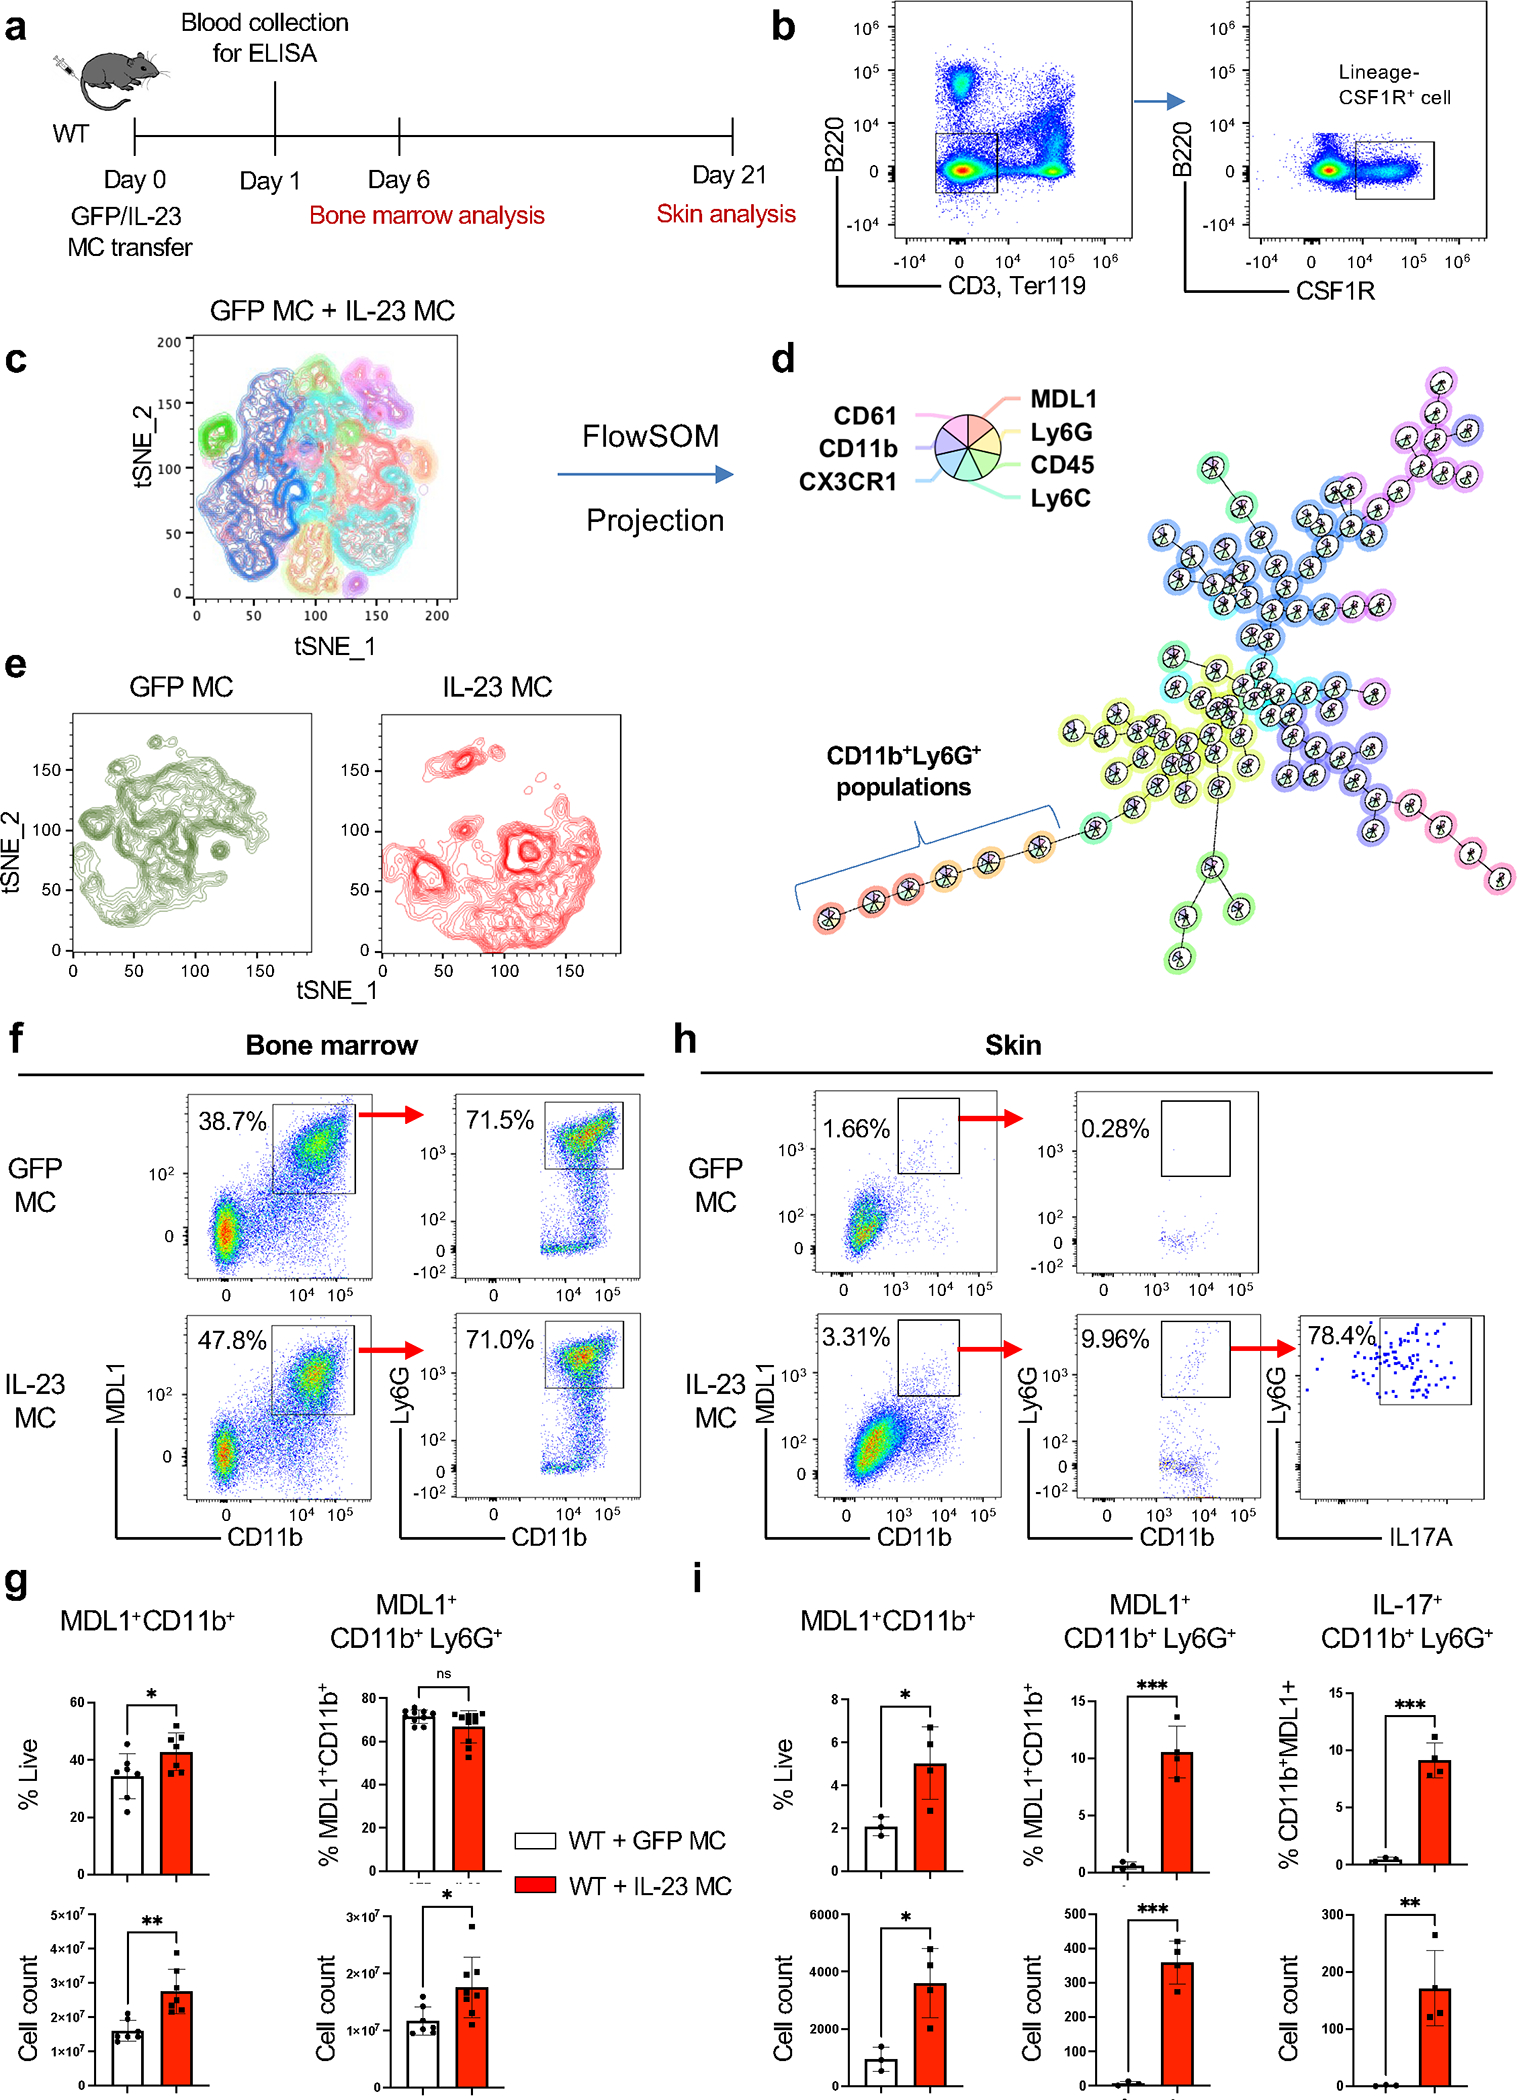
(a) Schematic presentation of GFP/IL-23 gene transfer model in WT mice. (b) Representative Fig. of integrated flow cytometry data showing the gating strategy of lineage−CSF1R+ cell used for unsupervised clustering with (c) tSNE plot and (d) FlowSOM based on seven surface molecules, showing distinct clusters. (e) Cell clusters post-GFP/IL-23 gene transfer visualized in tSNE plot. (f) Representative flow cytometry and (g) quantitative data of bone marrow derived MDL-1+CD11b+ and MDL-1+CD11b+Ly6G+ 6 days post-IL-23 gene transfer. (h) Representative flow cytometry (i) and quantitative data of skin derived MDL-1+CD11b+, MDL-1+CD11b+Ly6G+and MDL-1+IL-17+CD11b+Ly6G+ 21 days post-IL-23 gene transfer. *P<0.05; ** P<0.01; *** P<0.001 by Mann-Whitney.
3.3. IL-23 induced epidermal hyperplasia is prevented with genetic ablation of MDL-1
To further investigate the requirement of MDL-1 in IL-23 induced skin pathology, we performed IL-23 MC in vivo gene transfer in WT and Mdl-1−/− mice. We first confirmed that there was significantly low number of MDL-1+Ly6G+ cells in bone marrow 2 days post IL-23 MC gene transfer (Mean ± SEM; WT+GFP MC = 24.97% ± 2.54; WT+IL-23 MC = 28.18% ± 1.95; Mdl-1−/−+IL-23 MC = 0.75% ± 0.02) (Fig. 3a, b). By 21 days post IL-23 MC gene transfer, IL-23 induced erythema with silvery white scales in ears which was not observed in GFP controls, while they were attenuated in Mdl-1−/− mice (Fig. 3c). Consistently, histological analysis showed attenuated epidermal hyperplasia, epidermal thickness and infiltrated cells in Mdl-1−/− (Fig. 3d–g). Gene expression analysis in the inflamed skin showed that there was a significant decrease in IL-1b in Mdl-1−/− mice (Fig. 3h). We confirmed the functional significance of this observation with in vitro LPS activation assays in CD11b+ bone marrow cells derived from WT and Mdl-1 and demonstrated significant differences in IL-1b, which was consistent with previous reports [19] (Fig. 3i). As previous reports showed that Mdl-1−/− mice had an impaired number of γδ T cells in a Listeria infection model [19] we measured the frequency of bone marrow and skin γδ T cells and/or IL-17A producing γδ T cells in WT and Mdl-1−/− mice, however, we did not detect any significant differences (Supplemental Fig. 3a, b). These data indicate that MDL-1 regulates the expansion of IL-23R+ myeloid subsets critical for skin inflammation.
Fig. 3: IL-23 induced epidermal hyperplasia is prevented with genetic ablation of MDL-1 receptor.

(a) Representative flow cytometry and (b) quantitative data of bone marrow derived MDL-1+Ly6G+ cells and (c) Gene expression analysis of Il6, S100a7, Cxcl1, Cxcl2 and Il23r of total bone marrow cells 48 hours post-IL-23 gene transfer in WT and/or Mdl-1−/− compared to GFP (control) mice. (d) Photographs of murine ears 21 days post IL-23 gene transfer showing the development of silvery white scales in WT and/or Mdl-1−/− compared to GFP MC (control) mice. (e) H&E staining showing epidermal hyperplasia and inflammatory infiltrate in the murine ear. (Images are representative of three independent experiments and 9–11 mice per each group. Scale bars, 100 μm). (f) Quantification of epidermal thickness (μm) and (g) infiltrated cells per mm2. (h) Gene expression analysis of Il1b, Tnf and Il6 in the ears of IL-23 gene transfer WT and/or Mdl-1−/− compared to GFP MC (control) mice. (i) Gene expression analysis of Il1b in sorted CD11b+ bone marrow cells in the presence or absence of LPS stimulation. Data represent mean ± SEM of three independent experiments. *P<0.05; ** P<0.01; *** P<0.001 by Mann-Whitney.
3.4. IL-23-induced skin transcriptome is consistent with inflammation and neutrophil activation.
To define the transcriptomic profile of IL-23-induced skin inflammation regulated by MDL-1, we performed RNA-Seq analysis and compared three groups 1) WT+IL-23 v. WT+GFP (control), 2) Mdl1−/−+IL-23 v. WT+GFP (control), and 3) WT+IL-23 v. Mdl1−/−+IL-23. Sets of differentially expressed genes (DEGs) were defined on the basis of standard thresholds i.e. a fold change >2.0 or <0.5 and q-value (FDR-adjusted p-value) <0.05. We applied two complementary dimensionality reduction techniques: principal component analysis (PCA) and t-distributed stochastic neighbor embedding (t-SNE) which illustrate potential clusters of neighboring samples and contain similar gene expression patterns (Supplemental Fig. 4a, b). After observation of the expression values for genes in each group, we observed the Pearson Correlation between all DEGs in hierarchically clustered heat-maps (Supplemental Fig. 4c, d, Dataset S1). Due to the fact that many PCC values were close to 1, we identified gene clusters in the heat-map by more closely looking at PCC values greater than 0.97 (Supplemental Fig. 4e, f, Dataset S1), and found 12 clusters in up-regulated genes and 15 clusters in down-regulated genes.
Differential expression analysis revealed 1171 (619 up-regulated and 552 down-regulated) DEGs in WT+IL-23 v. WT+GFP, 414 (303 up-regulated and 111 down-regulated) DEGs in Mdl1−/−+IL-23 v. WT+GFP, and 260 (122 up-regulated and 138 down-regulated) DEGs in WT+IL-23 v. Mdl1−/−+IL-23 (Fig. 4a, b). An intersection of DEGs from WT+IL-23 v. WT+GFP and Mdl1−/−+IL-23 v. WT+GFP revealed a core set of 297 DEGs regulated by MDL-1 (Fig. 4a). The number of DEGs between the comparison groups is illustrated in the Venn diagram (Fig. 4a, b). To illustrate the differences and their relations to the IL-23 MC-induced skin inflammation between the groups, we performed cluster analysis of the entire sample and heat-maps of DEGs between groups were generated (Fig. 4c, d). Our data showed that IL-23 increased the expression of immune response genes were associated with myelopoiesis, neutrophils, DAP12-pathway, myeloid-T cell interactions (Fig. 4c) and skin inflammation (Fig. 4d). An increased expression of those genes was not detected in MDL-1 deficient mice, which were at similar levels to GFP control. Among the DEGs post IL-23 gene transfer, we found several genes associated with psoriasis to be highly elevated in WT but not in Mdl1−/− including Ivl, Dmkn, Defb, 1Ier3, Slurp2, Ephx3, Cdsn, Vegfa and Nipal4 and Sult2b1 previously identified as critical markers associated with ichthyosis, an abnormal scaling of the skin [29, 30]. We found multiple genes associated with neutrophil recruitment and infiltration (Plaur, Ptafr, Mmp8), neutrophil chemotaxis and migration (Capn2, Ano4, Ccr7, Fam3b, S1pr4, Cxcl1, Cxcl2, Ccr4, Sell), and neutrophil activation (C5ar1, Steap1, Fpr1, Serpinb1a, Aqp9, Mcemp1), and an increased expression of genes associated with DAP12 and T cells (Tarm1, Trac, Chil4, Mal2, Spn, Scart, Lat, Rorc) that again was not detected in Mdl1−/− but were at similar levels to GFP control. The overall biological processes commonly associated with those genes are illustrated in a Chord plot (Fig. 4e). The top 10 DEGs across all groups are summarized in supplementary tables (Supplemental Table 2–4).
Fig. 4: Myeloid activation in the IL-23 induced skin transcriptome.

(a, b) Venn diagrams showing the overlap of DEGs between WT+IL-23 v. WT+GFP and Mdl1−/−+IL-23 v. WT+GFP and WT+IL-23 v. Mdl1−/−+IL-23. (c) The hierarchically clustered heat-map of the target DEGs associated with immune response (myeloid cells, neutrophils, T cell, DAP12) genes, (d) skin inflammation associated genes. Color-coding is based on log-transformed read count values. DEGs are defined by fold change >2 or <0.5 and q-value (FDR-adjusted p-value) < 0.05. The samples were clustered using average linkage and 1-correlation distances. (Red to green color bar indicates low to high log fold-change values). (e) Chord diagram shows interrelationship for interested genes among KEGG pathways with 4 DEGs or more in the comparison group WT+IL-23 v. WT+GFP. Link thickness is proportional to the overlap between pathways and log-fold change is depicted from decreasing to increasing next to each gene.
3.5. Genetic ablation of MDL-1 protects against IL-23-induced expression of neutrophil-associated genes, neutrophil chemotaxis, and neutrophil proteases in the skin.
Next, to identify biological processes involved in IL-23 induced skin inflammation, we performed a gene-set enrichment analysis of biological processes that are statistically enriched in the shared DEGs between the WT+IL23 and Mdl-1−/−+IL23 groups (Fig. 5a). The immune-related biological processes were associated with hematopoietic differentiation and hemopoiesis, neutrophil migration and chemotaxis, and secretion transport protein as well as adaptive immunity. All of these cellular processes were inhibited in the MDL-1 deficient mice which showed an ameliorated phenotype. Next, we constructed a protein-protein interaction network for the target DEGs among WT+GFP v. WT+IL-23 v. Mdl-1−/−+IL-23 (Fig. 5b). A tight association between neutrophil genes, neutrophil chemotaxis and especially serine proteases were linked with skin inflammation. Other DEGs such as DAP12, T cell, cell survival, cytokines & chemokines, and cytoskeleton-associated genes were also associated with skin inflammation in IL-23 gene transfer but were not detected in the MDL-1 deficient mice (Fig. 5c). Collectively these data suggest that MDL-1 is critical in the regulation of neutrophil genes associated with skin inflammation.
Fig. 5: Genetic ablation of MDL-1 protects against IL-23-induced expression of neutrophil-associated genes, neutrophil chemotaxis, and neutrophil proteases in the skin.
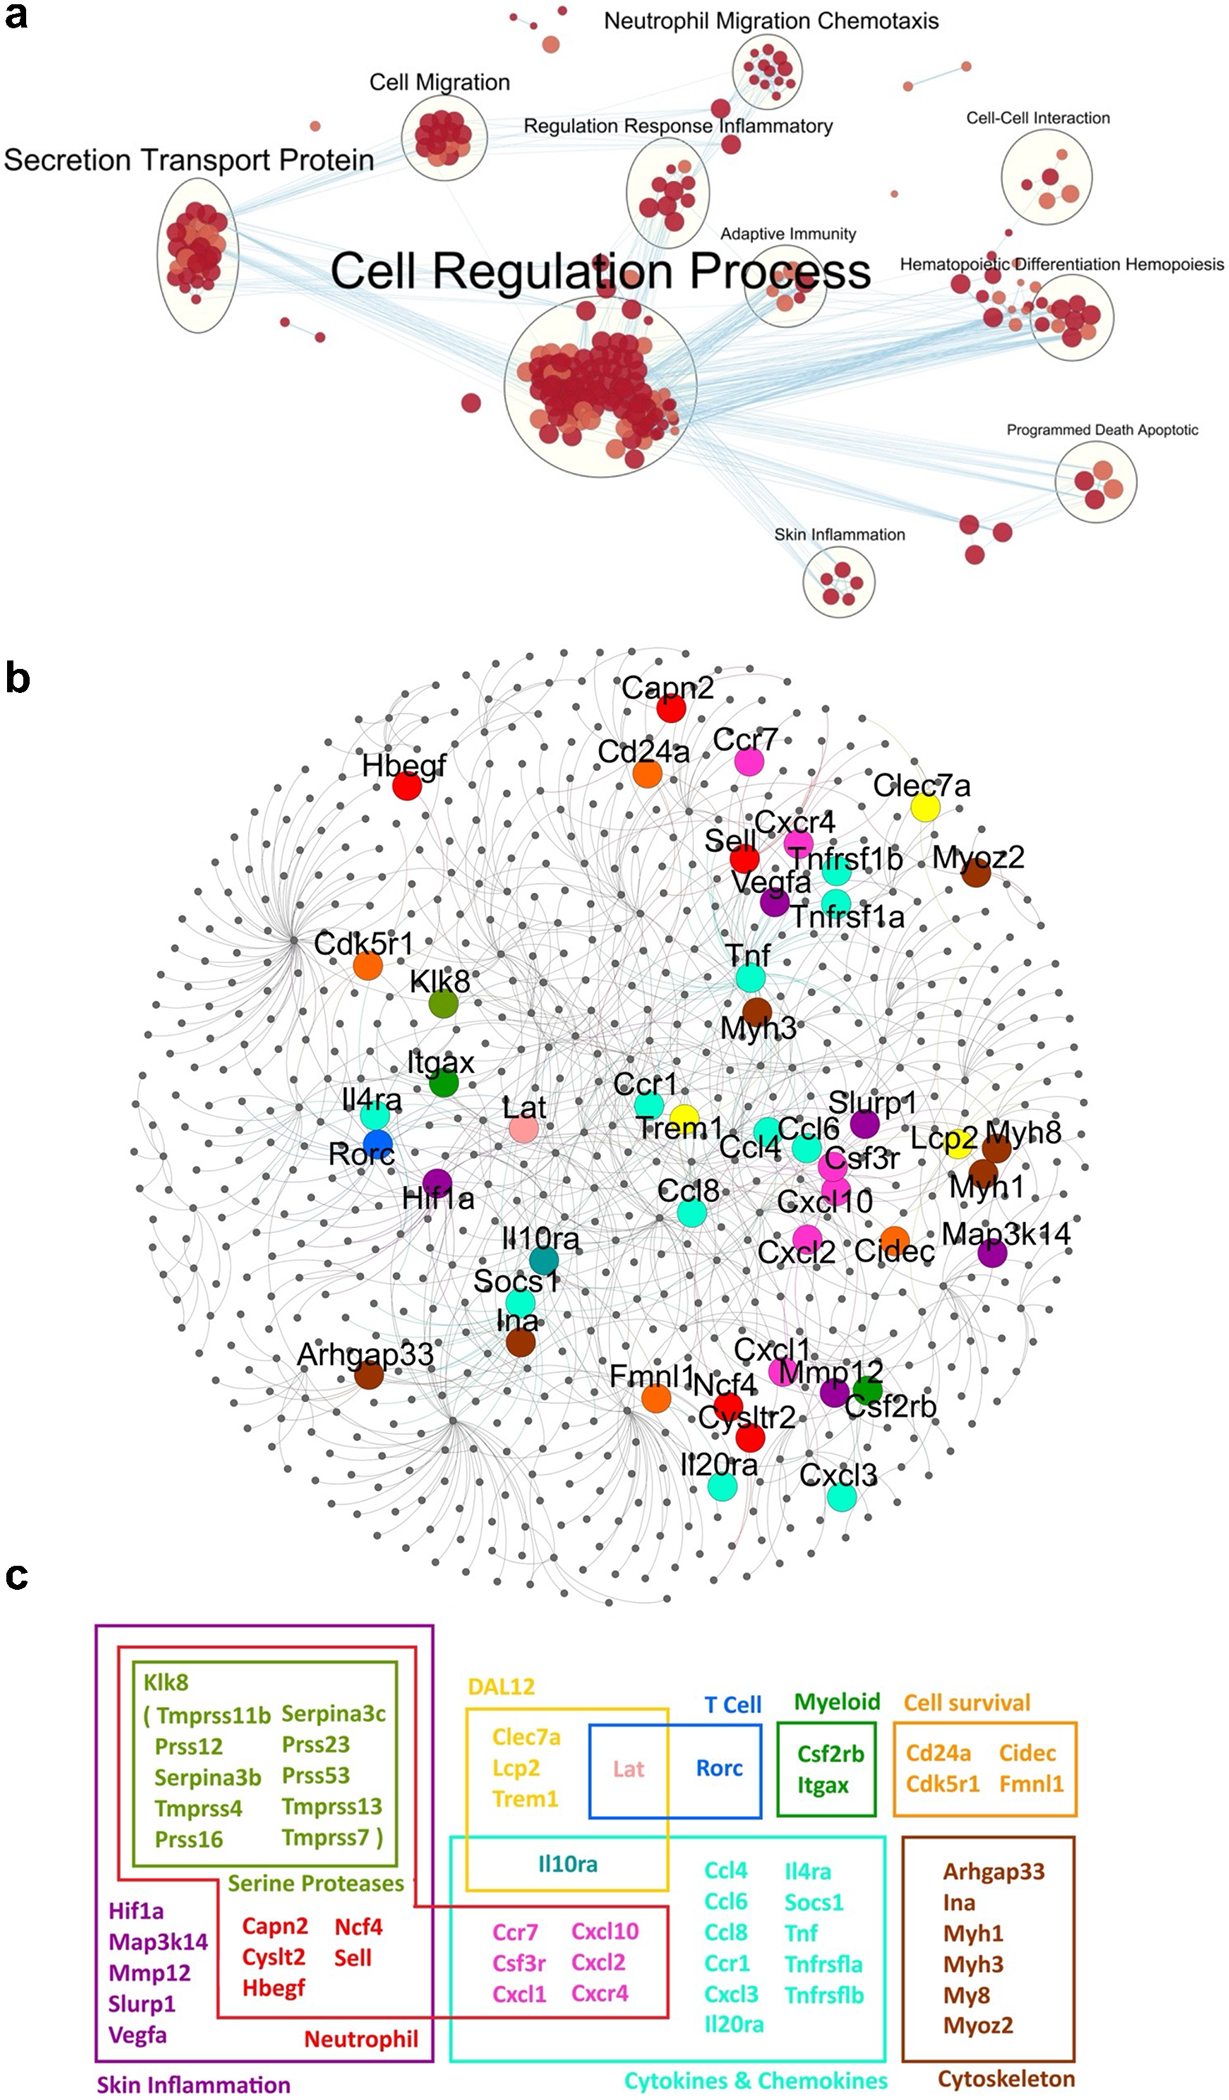
(a) Map of biological processes that are statistically enriched in the shared DEGs between the WT+IL23 and Mdl-1−/−+IL23 groups. Nodes are gene-sets with 10 or more genes each. Size and color intensity of each node correspond to the number of genes and its statistical enrichment, respectively. Two nodes are connected when they share a significant number of genes (Jaccard coefficient > 0.25). (b) Protein-protein interaction network for the target DEGs among WT+GFP v. WT+IL-23 v. Mdl-1−/− +IL-23. Yellow, red, blue, dark, purple, orange, bright blue, and brown nodes indicate DAP12-, neutrophil-, T cell-, myeloid-, skin inflammation-, cell survival-, cytokines & chemokines-, and cytoskeleton-associated genes, respectively. (c) For genes that belong to different groups, the color pink was used to show an overlap between the neutrophil and cytokines & chemokines groups, light green an overlap between the DAP12 and cytokines & chemokines groups, dark blue an overlap between the DAP12 and T cell groups, and blue-green an overlap between the skin inflammation and serine proteases groups.
3.6. MDL-1 correlates with IL-23R and IL-23 in multiple human PsA and PsO patient cohorts.
Next, we utilized human skin biopsies of PsA and PsO patients, and demonstrated by H&E the presence of epidermal hyperplasia and prominent neutrophil exudates (Munro’s microabscesses) in the stratum corneum (Fig. 6a), a characteristic feature of psoriasis. Chloroacetate esterase staining demonstrated the accumulation of neutrophil polymorphs in the stratum corneum and dermis (Fig. 6b). We also demonstrated by immunofluorescence that a large number of the neutrophil polymorphs were also CD66b+ and IL-17A+ cells and accumulated in the stratum corneum and more prominently in the epidermis (Supplemental Fig. 5a). the presence of epidermal and dermal MDL1+IL-23R+ cells in the human skin of patients with PsA (Fig. 6c) and psoriasis (Fig. 6d). Importantly, this population was also present in the uninvolved skin of patients but undetected in the healthy control (Supplemental Fig. 5b, c). We also performed gene expression correlations from 4 independently acquired psoriasis RNA-Seq data sets (Supplemental Table 5) [31–34].To understand the relationship between IL-23 and MDL-1, meta-analyses were conducted to determine the weighted averages of their gene-gene correlations across all three RNA-Seq datasets. The meta-analyses for IL-23 v. MDL-1 was positive (rs = 0.38 [0.22–0.54] (Fig. 6e) and significant (P = 3.5E-06) with no evidence (P = 0.87) of any substantial residual heterogeneity (i.e. there was no remaining variability in effect sizes that was unexplained). As a negative control, we used RUNX2 which in contrast, is not expressed in myeloid cells and as expected, there was no detectable correlation between RUNX2 and MDL-1 (rs = −0.13 [−0.60, 0.33]) (Supplemental Fig. 5d). Dash lines depict linear regressions and Spearman’s rank-order correlations (rs) are displayed in each graph.
Fig. 6: MDL-1 correlates with IL-23R and IL-23 in human PsA and PsO patients.

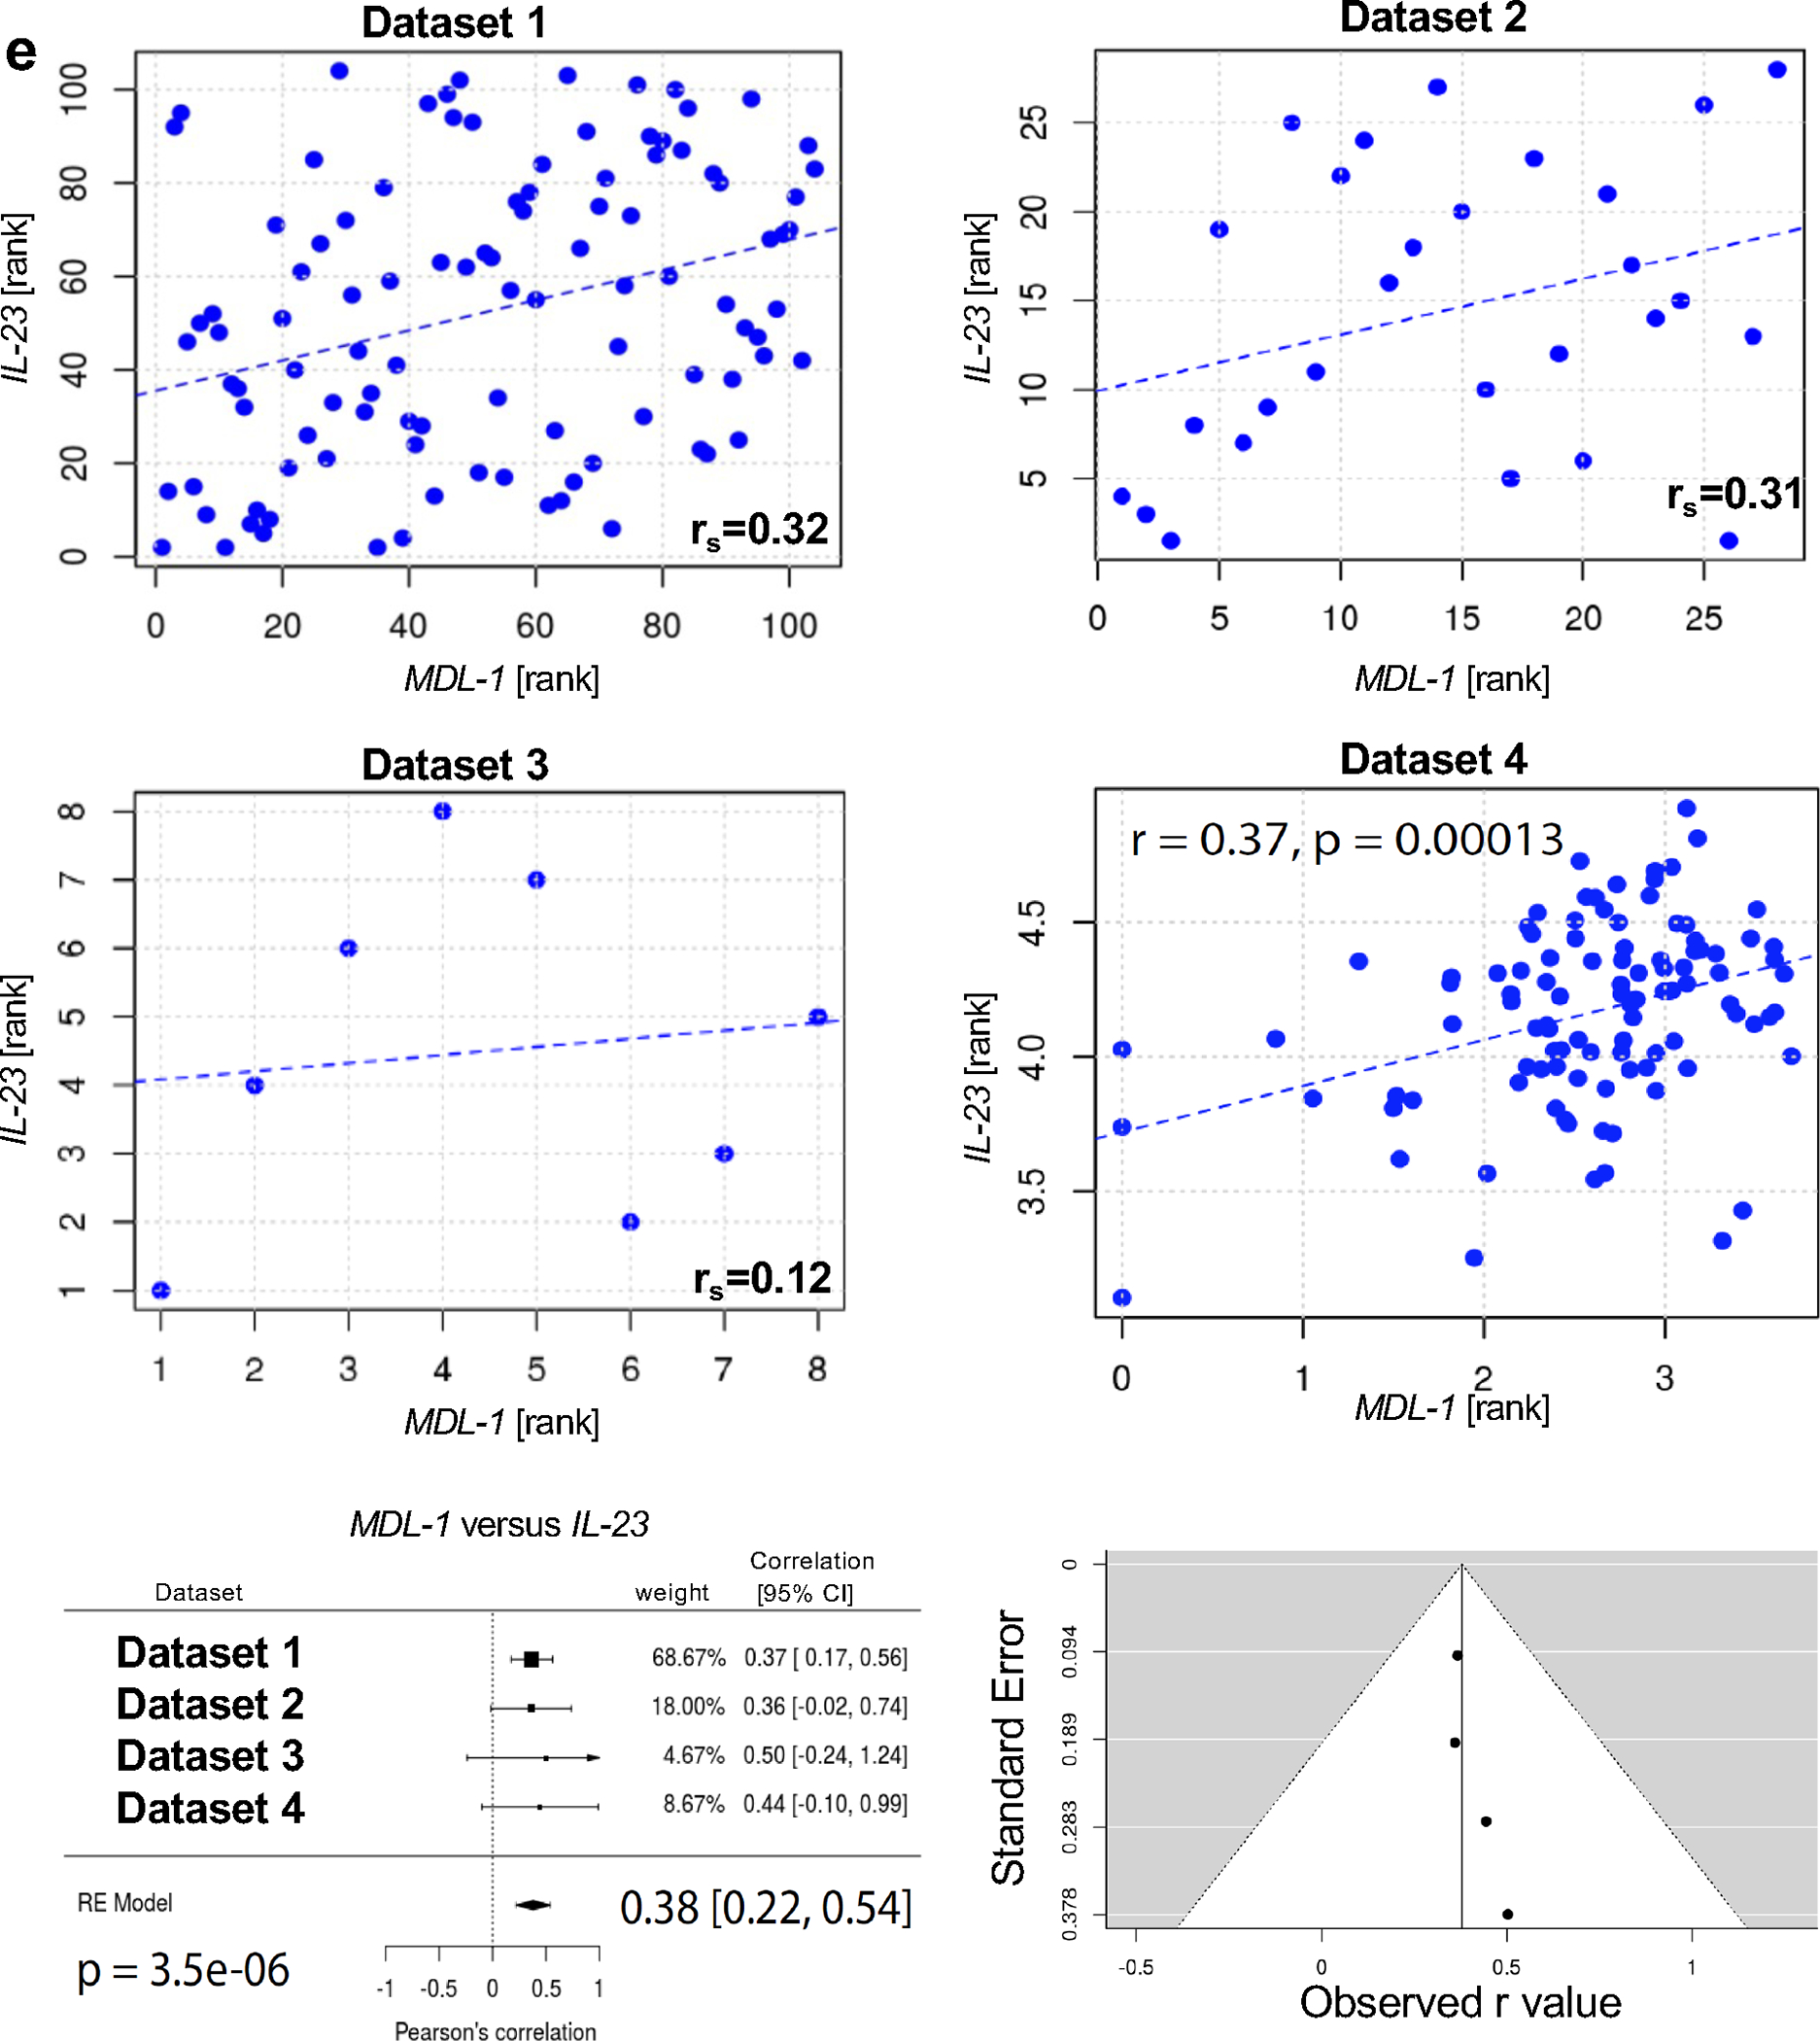
(a) Representative images of H&E staining of human psoriatic skin showing the presence of neutrophil exudates in the stratum corneum. (Arrows indicate Munro’s microabscesses). (b) Chloroacetate esterase staining showing the accumulation of neutrophil polymorphs in the stratum corneum and dermis. (Arrows indicate chloroacetate esterase positive cells). Immunofluorescent staining of human skin biopsies of patients with (c) PsA and (d) psoriasis with DAPI (blue), anti-MDL-1 (green) and anti-IL-23R (red) indicating MDL-1 colocalization with IL-23R, (MDL-1+IL-23R+ cells) (orange) in the epidermal and dermal infiltrates. Images are representative of three experiments. Scale bar, 50 μm. (e) Gene expression correlations with MDL-1 and IL-23. Linear regression lines are depicted as blue dashes. Spearman’s rank-order correlations (rs) are listed. Within these correlations none of the data points were found to be overly influential (Cook’s distance for all data points was < 1). Meta-analyses were conducted to evaluate these correlations across the four independently acquired RNA-Seq datasets and the results are displayed as Forest plots. 95% confidence intervals (CI), weighted averages and p values are shown. There was no evidence (p = 0.87 and p = 0.75, respectively) of any substantial residual heterogeneity, i.e. there was no remaining variability in effect sizes that was unexplained.
4. Discussion
IL-23 regulates the development of myeloid and lymphoid immune cells which in turn orchestrate a plethora of immune responses. The implication of IL-23 signaling in psoriasis and psoriatic arthritis is well-documented and corroborated by GWAS studies, however the exact mechanisms that govern pathogenicity remain elusive [1]. The involvement of IL-23 in the development of pathogenic IL-17A producing T cells, has dominated the literature and overshadowed the importance of myeloid cells which clinically characterize the disease, not only by the distinctive Munro’s microabscesses (neutrophil exudates) in the inflamed skin but also by the accumulation of neutrophils in the joints, enthesis and nails [35–39]. In our model these neutrophil exudates are secondary to an expansion of neutrophils in the bone marrow. We have previously shown that adoptive transfer of murine bone marrow neutrophils is sufficient to phenocopy disease [25] however the role of neutrophils in PsA are under investigation as recently reviewed [40, 41]. We have previously shown that both IL-23 and IL-17A gene transfer induce myelopoiesis in the bone marrow and IL-17A induce systemic neutrophil expansion and exhibit clinical manifestations of skin inflammation as commonly observed in psoriasis [11, 25, 27]. Herein we demonstrate that IL-23-mediated myelopoiesis is dependent on CLEC5A/MDL-1, a PU.1 transcriptional target during myeloid differentiation that regulates activation and recruitment of myeloid cells during inflammation [12–15]. We also show that activation of MDL-1 is specifically important in the maturation of IL-17A+ neutrophils, which have previously been described to be induced by IL-23 and IL-6 during fungal infection [42], and observed in psoriatic skin [43, 44]. Notably the importance of IL-17A expression by neutrophils in psoriasis is under scrutiny, as other neutrophilic functions including NETosis occur simultaneously with IL-17A secretion and have also been implicated in skin inflammation and thus pathogenicity should not be attributed to a single pathogenic characteristic [43]. Additionally, transcriptomic analysis of the skin following IL-23 gene transfer showed a marked increase in neutrophil serine proteases, KLK8, PRSS12, PRSS16, SERPIN3AB, which were recently associated with PsA [45, 46]. The pathogenic neutrophil-associated genes play far more critical roles than IL-17A alone as shown by previous studies where local IL-17A injections failed to induce skin inflammation [28] and adoptive transfer of Ly6G+ cells was sufficient to induce skin pathology in the absence of exogenous IL-17A [25]. So collectively, regardless of the critical importance of IL-17A our results are consistent with multiple studies that have shown the dependence of skin inflammation on neutrophils [25, 47]. In fact, we and others have shown that myelopoiesis is a critical event in autoimmune disorders [48–50]. Although we recently demonstrated MDL-1-induced myelopoiesis has been previously been associated with osteoclastogenesis and bone destruction [51] this is the first report to our knowledge that associates MDL-1 with skin inflammation.
In keeping with this notion, our observations of IL-23R+MDL-1+ cells were corroborated in PsO and PsA human skin biopsies and the interaction of IL-23 with MDL- 1 in the psoriatic skin was further confirmed across multiple patient cohorts (141 healthy controls VS 149 PsO patients). Although we did observe a significant correlation between IL-23 and MDL-1 in these patients the correlation coefficient (R value) was not very high. This could very well be because the patient cohort included patients with modest to severe psoriasis whereas MDL-1 seems to play a role in the early initiation phase of the disease. The role of bone marrow myelopoiesis in the pathogenesis of PsA and the contribution of these mechanisms in maintaining the chronicity of the disease remains to be deciphered. We believe that these mechanisms may differ within the patient population of PsA and hope that our data provide a mechanistic explanation of bone marrow driven disease manifestations that can be of benefit to all or to a subtype of patients. Collectively, our data demonstrate that myelopoiesis is critical in the development of skin inflammation and identify MDL-1 as a potential target for therapeutic interventions.
Supplementary Material
Highlights.
IL-23 induces pathogenic IL-17A+ MDL-1/CLEC5A+ neutrophil population
IL-23R+MDL-1+ neutrophils are identified in psoriasis/psoriatic arthritis patient
IL-23 and MDL-1 expression are correlated in multiple patient cohorts
MDL-1+ neutrophil could be a novel treatment target for psoriasis/psoriatic arthritis
Acknowledgments:
We thank Cox Terhorst, for critical reading of the manuscript and stimulating discussions, and Thanh Nguyen, and Atrin Toussi for assistance with graphic design and figure presentation.
Funding
This work was supported by National Institutes of Health/National Institute of Arthritis and Musculoskeletal and Skin Diseases Grant 2R01AR062173, and a National Psoriasis Foundation Translational Research grant to IEA.
Footnotes
Conflict of interest
The authors have no conflicts of interest to declare.
Publisher's Disclaimer: This is a PDF file of an unedited manuscript that has been accepted for publication. As a service to our customers we are providing this early version of the manuscript. The manuscript will undergo copyediting, typesetting, and review of the resulting proof before it is published in its final form. Please note that during the production process errors may be discovered which could affect the content, and all legal disclaimers that apply to the journal pertain.
References
- [1].Filer C, Ho P, Smith RL, Griffiths C, Young HS, Worthington J et al. Investigation of association of the IL12B and IL23R genes with psoriatic arthritis. Arthritis and rheumatism, 2008;58:3705–9. [DOI] [PMC free article] [PubMed] [Google Scholar]
- [2].Nair RP, Duffin KC, Helms C, Ding J, Stuart PE, Goldgar D et al. Genome-wide scan reveals association of psoriasis with IL-23 and NF-kappaB pathways. Nature genetics, 2009;41:199–204. [DOI] [PMC free article] [PubMed] [Google Scholar]
- [3].Sutton CE, Lalor SJ, Sweeney CM, Brereton CF, Lavelle EC, Mills KH. Interleukin-1 and IL-23 induce innate IL-17 production from gammadelta T cells, amplifying Th17 responses and autoimmunity. Immunity, 2009;31:331–41. [DOI] [PubMed] [Google Scholar]
- [4].Smith E, Zarbock A, Stark MA, Burcin TL, Bruce AC, Foley P et al. IL-23 is required for neutrophil homeostasis in normal and neutrophilic mice. J Immunol, 2007;179:8274–9. [DOI] [PubMed] [Google Scholar]
- [5].Mamedov MR, Scholzen A, Nair RV, Cumnock K, Kenkel JA, Oliveira JHM et al. A Macrophage Colony-Stimulating-Factor-Producing gammadelta T Cell Subset Prevents Malarial Parasitemic Recurrence. Immunity, 2018;48:350–63 e7. [DOI] [PMC free article] [PubMed] [Google Scholar]
- [6].Coffelt SB, Kersten K, Doornebal CW, Weiden J, Vrijland K, Hau CS et al. IL-17-producing gammadelta T cells and neutrophils conspire to promote breast cancer metastasis. Nature, 2015;522:345–8. [DOI] [PMC free article] [PubMed] [Google Scholar]
- [7].Stark MA, Huo Y, Burcin TL, Morris MA, Olson TS, Ley K. Phagocytosis of apoptotic neutrophils regulates granulopoiesis via IL-23 and IL-17. Immunity, 2005;22:285–94. [DOI] [PubMed] [Google Scholar]
- [8].Ley K, Smith E, Stark MA. IL-17A-producing neutrophil-regulatory Tn lymphocytes. Immunologic research, 2006;34:229–42. [DOI] [PubMed] [Google Scholar]
- [9].Joyce-Shaikh B, Bigler ME, Chao CC, Murphy EE, Blumenschein WM, Adamopoulos IE et al. Myeloid DAP12-associating lectin (MDL)-1 regulates synovial inflammation and bone erosion associated with autoimmune arthritis. J Exp Med, 2010;207:579–89. [DOI] [PMC free article] [PubMed] [Google Scholar]
- [10].Shin HS, Sarin R, Dixit N, Wu J, Gershwin E, Bowman EP et al. Crosstalk among IL-23 and DNAX activating protein of 12 kDa-dependent pathways promotes osteoclastogenesis. J Immunol, 2015;194:316–24. [DOI] [PMC free article] [PubMed] [Google Scholar]
- [11].Adamopoulos IE, Tessmer M, Chao CC, Adda S, Gorman D, Petro M et al. IL-23 is critical for induction of arthritis, osteoclast formation, and maintenance of bone mass. Journal of immunology, 2011;187:951–9. [DOI] [PMC free article] [PubMed] [Google Scholar]
- [12].Aoki N, Kimura Y, Kimura S, Nagato T, Azumi M, Kobayashi H et al. Expression and functional role of MDL-1 (CLEC5A) in mouse myeloid lineage cells. J Leukoc Biol, 2009;85:508–17. [DOI] [PubMed] [Google Scholar]
- [13].Batliner J, Mancarelli MM, Jenal M, Reddy VA, Fey MF, Torbett BE et al. CLEC5A (MDL-1) is a novel PU.1 transcriptional target during myeloid differentiation. Mol Immunol, 2011;48:714–9. [DOI] [PMC free article] [PubMed] [Google Scholar]
- [14].Gingras MC, Lapillonne H, Margolin JF. TREM-1, MDL-1, and DAP12 expression is associated with a mature stage of myeloid development. Mol Immunol, 2002;38:817–24. [DOI] [PubMed] [Google Scholar]
- [15].Inui M, Kikuchi Y, Aoki N, Endo S, Maeda T, Sugahara-Tobinai A et al. Signal adaptor DAP10 associates with MDL-1 and triggers osteoclastogenesis in cooperation with DAP12. Proc Natl Acad Sci U S A, 2009;106:4816–21. [DOI] [PMC free article] [PubMed] [Google Scholar]
- [16].Chen ST, Lin YL, Huang MT, Wu MF, Cheng SC, Lei HY et al. CLEC5A is critical for dengue-virus-induced lethal disease. Nature, 2008;453:672–6. [DOI] [PubMed] [Google Scholar]
- [17].Chen ST, Liu RS, Wu MF, Lin YL, Chen SY, Tan DT et al. CLEC5A regulates Japanese encephalitis virus-induced neuroinflammation and lethality. PLoS Pathog, 2012;8:e1002655. [DOI] [PMC free article] [PubMed] [Google Scholar]
- [18].Wu MF, Chen ST, Yang AH, Lin WW, Lin YL, Chen NJ et al. CLEC5A is critical for dengue virus-induced inflammasome activation in human macrophages. Blood, 2013;121:95–106. [DOI] [PubMed] [Google Scholar]
- [19].Chen ST, Li FJ, Hsu TY, Liang SM, Yeh YC, Liao WY et al. CLEC5A is a critical receptor in innate immunity against Listeria infection. Nat Commun, 2017;8:299. [DOI] [PMC free article] [PubMed] [Google Scholar]
- [20].Huang YL, Chen ST, Liu RS, Chen YH, Lin CY, Huang CH et al. CLEC5A is critical for dengue virus-induced osteoclast activation and bone homeostasis. J Mol Med (Berl), 2016;94:1025–37. [DOI] [PMC free article] [PubMed] [Google Scholar]
- [21].Cheung R, Shen F, Phillips JH, McGeachy MJ, Cua DJ, Heyworth PG et al. Activation of MDL-1 (CLEC5A) on immature myeloid cells triggers lethal shock in mice. J Clin Invest, 2011;121:4446–61. [DOI] [PMC free article] [PubMed] [Google Scholar]
- [22].Awasthi A R-BL, Jäger A, Korn T, Pot C, Galileos G, Bettelli E, Kuchroo VK, Oukka M. Cutting edge: IL-23 receptor gfp reporter mice reveal distinct populations of IL-17-producing cells. J Immunol, 2009;182:5904–8. [DOI] [PMC free article] [PubMed] [Google Scholar]
- [23].Quintelier K, Couckuyt A, Emmaneel A, Aerts J, Saeys Y, Van Gassen S. Analyzing high-dimensional cytometry data using FlowSOM. Nat Protoc, 2021;16:3775–801. [DOI] [PubMed] [Google Scholar]
- [24].Bouchareychas L, Grossinger EM, Kang M, Adamopoulos IE. gammadeltaTCR regulates production of interleukin-27 by neutrophils and attenuates inflammatory arthritis. Sci Rep, 2018;8:7590. [DOI] [PMC free article] [PubMed] [Google Scholar]
- [25].Suzuki E, Maverakis E, Sarin R, Bouchareychas L, Kuchroo VK, Nestle FO et al. T Cell-Independent Mechanisms Associated with Neutrophil Extracellular Trap Formation and Selective Autophagy in IL-17A-Mediated Epidermal Hyperplasia. J Immunol, 2016;197:4403–12. [DOI] [PMC free article] [PubMed] [Google Scholar]
- [26].Bouchareychas L, Grössinger EM, Kang M, Adamopoulos IE. γδTCR regulates production of interleukin-27 by neutrophils and attenuates inflammatory arthritis. Sci Rep, 2018;8:7590. [DOI] [PMC free article] [PubMed] [Google Scholar]
- [27].Adamopoulos IE, Suzuki E, Chao CC, Gorman D, Adda S, Maverakis E et al. IL-17A gene transfer induces bone loss and epidermal hyperplasia associated with psoriatic arthritis. Ann Rheum Dis, 2015;74:1284–92. [DOI] [PMC free article] [PubMed] [Google Scholar]
- [28].Chan JR, Blumenschein W, Murphy E, Diveu C, Wiekowski M, Abbondanzo S et al. IL-23 stimulates epidermal hyperplasia via TNF and IL-20R2-dependent mechanisms with implications for psoriasis pathogenesis. J Exp Med, 2006;203:2577–87. [DOI] [PMC free article] [PubMed] [Google Scholar]
- [29].Nestle FO, Kaplan DH, J. Barker. Psoriasis. N Engl J Med, 2009;361:496–509. [DOI] [PubMed] [Google Scholar]
- [30].Perera GK, Di Meglio P, Nestle FO. Psoriasis. Annu Rev Pathol, 2012;7:385–422. [DOI] [PubMed] [Google Scholar]
- [31].Tsoi LC, Iyer MK, Stuart PE, Swindell WR, Gudjonsson JE, Tejasvi T et al. Analysis of long non-coding RNAs highlights tissue-specific expression patterns and epigenetic profiles in normal and psoriatic skin. Genome Biol, 2015;16:24. [DOI] [PMC free article] [PubMed] [Google Scholar]
- [32].Di Meglio P, Duarte JH, Ahlfors H, Owens ND, Li Y, Villanova F et al. Activation of the aryl hydrocarbon receptor dampens the severity of inflammatory skin conditions. Immunity, 2014;40:989–1001. [DOI] [PMC free article] [PubMed] [Google Scholar]
- [33].Tsoi LC, Rodriguez E, Degenhardt F, Baurecht H, Wehkamp U, Volks N et al. Atopic Dermatitis Is an IL-13-Dominant Disease with Greater Molecular Heterogeneity Compared to Psoriasis. J Invest Dermatol, 2019;139:1480–9. [DOI] [PMC free article] [PubMed] [Google Scholar]
- [34].Swindell WR, Remmer HA, Sarkar MK, Xing X, Barnes DH, Wolterink L et al. Proteogenomic analysis of psoriasis reveals discordant and concordant changes in mRNA and protein abundance. Genome Med, 2015;7:86. [DOI] [PMC free article] [PubMed] [Google Scholar]
- [35].Schett G, Lories RJ, D’Agostino MA, Elewaut D, Kirkham B, Soriano ER et al. Enthesitis: from pathophysiology to treatment. Nat Rev Rheumatol, 2017;13:731–41. [DOI] [PubMed] [Google Scholar]
- [36].Steffen C. William John Munro and Munro’s abscess, and Franz Kogoj and Kogoj’s spongiform pustule. The American Journal of dermatopathology, 2002;24:364–8. [DOI] [PubMed] [Google Scholar]
- [37].Di Cesare A, Di Meglio P, Nestle FO. The IL-23/Th17 axis in the immunopathogenesis of psoriasis. J Invest Dermatol, 2009;129:1339–50. [DOI] [PubMed] [Google Scholar]
- [38].Kaul S, Singal A, Grover C, Sharma S. Clinical and histological spectrum of nail psoriasis: A cross-sectional study. J Cutan Pathol, 2018;45:824–30. [DOI] [PubMed] [Google Scholar]
- [39].Wipke BT, Allen PM. Essential role of neutrophils in the initiation and progression of a murine model of rheumatoid arthritis. J Immunol, 2001;167:1601–8. [DOI] [PubMed] [Google Scholar]
- [40].Mauro D, Gandolfo S, Tirri E, Schett G, Maksymowych WP, Ciccia F. The bone marrow side of axial spondyloarthritis. Nat Rev Rheumatol, 2023;19:519–32. [DOI] [PubMed] [Google Scholar]
- [41].Jeljeli MM, Adamopoulos IE. Innate immune memory in inflammatory arthritis. Nat Rev Rheumatol, 2023;19:627–39. [DOI] [PMC free article] [PubMed] [Google Scholar]
- [42].Taylor PR, Roy S, Leal SM Jr., Sun Y, Howell SJ, Cobb BA et al. Activation of neutrophils by autocrine IL-17A-IL-17RC interactions during fungal infection is regulated by IL-6, IL-23, RORgammat and dectin-2. Nat Immunol, 2014;15:143–51. [DOI] [PMC free article] [PubMed] [Google Scholar]
- [43].Lin AM, Rubin CJ, Khandpur R, Wang JY, Riblett M, Yalavarthi S et al. Mast cells and neutrophils release IL-17 through extracellular trap formation in psoriasis. J Immunol, 2011;187:490–500. [DOI] [PMC free article] [PubMed] [Google Scholar]
- [44].Fontao L, Brembilla NC, Masouyé I, Kaya G, Prins C, Dupin N et al. Interleukin-17 expression in neutrophils and Th17 cells in cutaneous T-cell lymphoma associated with neutrophilic infiltrate of the skin. Br J Dermatol, 2012;166:687–9. [DOI] [PubMed] [Google Scholar]
- [45].Billi AC, Ludwig JE, Fritz Y, Rozic R, Swindell WR, Tsoi LC et al. KLK6 expression in skin induces PAR1-mediated psoriasiform dermatitis and inflammatory joint disease. J Clin Invest, 2020;130:3151–7. [DOI] [PMC free article] [PubMed] [Google Scholar]
- [46].Oikonomopoulou K, Diamandis EP, Hollenberg MD, Chandran V. Proteinases and their receptors in inflammatory arthritis: an overview. Nat Rev Rheumatol, 2018;14:170–80. [DOI] [PubMed] [Google Scholar]
- [47].Schon M, Denzer D, Kubitza RC, Ruzicka T, Schon MP. Critical role of neutrophils for the generation of psoriasiform skin lesions in flaky skin mice. The Journal of investigative dermatology, 2000;114:976–83. [DOI] [PubMed] [Google Scholar]
- [48].Nguyen CT, Furuya H, Das D, Marusina AI, Merleev AA, Ravindran R et al. Peripheral γδ T Cells Regulate Neutrophil Expansion and Recruitment in Experimental Psoriatic Arthritis. Arthritis Rheumatol, 2022;74:1524–34. [DOI] [PMC free article] [PubMed] [Google Scholar]
- [49].Li X, Wang H, Yu X, Saha G, Kalafati L, Ioannidis C et al. Maladaptive innate immune training of myelopoiesis links inflammatory comorbidities. Cell, 2022;185:170–927 e18. [DOI] [PMC free article] [PubMed] [Google Scholar]
- [50].Louis C, Souza-Fonseca-Guimaraes F, Yang Y, D’Silva D, Kratina T, Dagley L et al. NK cell-derived GM-CSF potentiates inflammatory arthritis and is negatively regulated by CIS. J Exp Med, 2020;217. [DOI] [PMC free article] [PubMed] [Google Scholar]
- [51].Furuya H, Nguyen CT, Gu R, Hsieh SL, Maverakis E, Adamopoulos IE. Interleukin-23 Regulates Inflammatory Osteoclastogenesis via Activation of CLEC5A(+) Osteoclast Precursors. Arthritis Rheumatol, 2023;75:1477–89. [DOI] [PMC free article] [PubMed] [Google Scholar]
Associated Data
This section collects any data citations, data availability statements, or supplementary materials included in this article.