

Abstract
Objectives.
The purpose of this study is to use ECG-gated SPECT MPI to detect the latest contracting viable left ventricular (LV) segments to help guide the LV probe placement used in CRT therapy and to validate segment selection against the visual integration method by experts.
Methods.
For each patient, the resting ECG-gated SPECT MPI short-axis images were sampled in 3D to generate a polar map of the perfusion distribution used to determine LV myocardial viability, and to measure LV synchronicity using our phase analysis tool. In the visual integration method, two experts visually interpreted the LV viability and mechanical dyssynchrony from the short-axis images and polar maps of viability and phase, to determine the latest contracting viable segments using the 17-segment model. In the automatic method, the apical segments, septal segments, and segments with more than 50% scar were excluded as these are not candidates for CRT LV probe placement. Amongst the remaining viable segments, the segments, whose phase angles were within 10° of the latest phase angle (the most delayed contracting segment), were identified for potential CRT LV probe placement and ranked based on the phase angles of the segments. Both methods were tested in 36 pre-CRT patients who underwent ECG-gated SPECT MPI. The accuracy was determined as the percent agreement between the visual integration and automatic methods. The automatic method was performed by a second independent operator to evaluate the inter-operator processing reproducibility.
Results.
In all the 36 patients, the LV lead positions of the 1st choices recommended by the automatic and visual integration methods were in the same segments in 35 patients, which achieved an agreement rate of 97.2%. In the inter-operator reproducibility test, the LV lead positions of the 1st choices recommended by the two operators were in the same segments in 25 patients, and were in the adjacent segments in 7 patients, which achieved an overall agreement of 88.8%.
Conclusions.
An automatic method has been developed to detect the latest contracting viable LV segments to help guide the LV probe placement used in CRT therapy. The retrospective clinical study with 36 patients suggests that this method has high agreement against the visual integration method by experts and good inter-operator reproducibility. Consequently, this method is promising to be a clinical tool to recommend the CRT LV lead positions.
Keywords: SPECT MPI, hear failure, CRT, left ventricular lead
INTRODUCTION
It is known that 30%−40% of the patients who undergo CRT do not respond with improved clinical symptoms and/or improved LV function.1–3 LV lead position is essential in CRT response.4–9 The current clinical guidelines recommend LV lead placement in a lateral or posterolateral branch of the coronary venous system,10 which can be suboptimal or inappropriate in a significant number of patients.8,11,12
It is important for CRT response that LV lead is placed away from scar13 and at or near the latest site of contraction onset.8,11 Myocardial imaging techniques, such as echocardiography4,12,13 and MRI,14 have shown their potential to detect scar tissue and the site of the latest contraction onset to optimize the LV lead positions for improved CRT response. However, the low reproducibility of echocardiography and the cost and limited availability of cardiac MRI limit their clinical use.15
Myocardial viability and mechanical dyssynchrony from SPECT MPI have been used to recommend the optimal LV lead positions.15 Friehling et al16 defined a concordant LV lead position as the LV lead placement in the segment with myocardial viability and with or adjacent to the segment with the latest mechanical activation. They showed that 96% of the patients, who had baseline mechanical dyssynchrony, acceptable scar burden (<40%), and a concordant LV lead position, had favorable acute CRT response and long-term outcome. Boogers et al12 showed that favorable CRT response was significantly more often observed in patients with a concordant LV lead position, in which LV lead was placed in the latest LV activation, than in patients with a discordant LV lead position (79% vs. 26%). As a consequence, it is clinically significant and practical to recommend the LV lead positions from SPECT MPI.
This study was aimed to develop an automatic method to integrate myocardial viability and mechanical dyssynchrony from SPECT MPI to recommend the CRT LV lead positions and validate the method against the visual integration method by experts.
MATERIALS AND METHODS
Patient Data
36 patients with systolic heart failure were retrospectively enrolled in this study. All the patients met the clinical guidelines and were recommended to install CRT due to standard indications (NYHA class II-IV, LVEF ≤35%, and QRS duration ≥120 ms). All patients had undergone 8-frame ECG-gated resting SPECT. The baseline characteristics of these patients are listed in Table 1. The study was approved by the IRB of Nanjing Medical University.
Table 1.
Pre-CRT baseline characteristics of study population (n = 36)
| Age (year) | 63 ± 10 |
|---|---|
| Demographics | |
| Male | 27 |
| Female | 9 |
| LVEF (%) | 28.9 ± 5.9 |
| QRS duration (ms) | 162.2 ± 23.6 |
| NYHA class | II, 12; III, 17; IV, 7 |
| Type of cardiomyopathy | |
| Ischemia | 6 |
| Non-Ischemia | 30 |
LVEF, left ventricular ejection fraction; NYHA, New York Heart Association
The SPECT scan was performed about 30-minutes post-injection of 20–30 mCi of Tc-99 m sestamibi. SPECT images were acquired on a dual-headed camera (CardioMD, Philips Medical Systems) using a standard resting protocol. The acquisition parameters were 20% energy window around 140 keV, 180° orbit, 32 steps with 25 seconds per step, 8-bin gating and 64 projections per gate.
All the SPECT images were reconstructed into transaxial slices by ordered subsets expectation maximization (OSEM) with 3 iterations and 10 subsets, and then filtered by a Butterworth filter with a power of 10 and a cutoff frequency of 0.3 cycles/mm. The pixel size of reconstructed images was 6.4 × 6.4 × 6.4 mm3. The gated and ungated transaxial images were reoriented into short-axis images by an experienced technologist and these results were sent to Emory Cardiac Toolbox (Emory Cardiac Toolbox, Atlanta, GA) for automated processing.
Recommendation of the Optimal LV Lead Positions
Figure 1 shows the steps of recommending LV lead positions from short-axis MPI images for a single patient. An automated tool was developed to identify the LV parameters including LV center and radius, apex, and base slices. The ungated short-axis images and LV parameters were input into a LV perfusion quantification tool to generate the polar map of myocardial viability. The gated short-axis images and LV parameters were input into our LV dyssynchrony quantification tool to generate the polar map of mechanical dyssynchrony. The optimal LV lead positions were determined from these two polar maps.
Figure 1.

Major steps of recommending LV lead positions from SPECT MPI short-axis images. Red-dotted rectangle, the step where manual operation may be involved.
The LV perfusion quantification tool.
The ungated short-axis images were input into an automatic sampling algorithm which searched in 3D for the maximal count circumferential profiles to represent the regional perfusion level.17 The LV perfusion distribution voxels with less than 50% of maximum uptake were defined as myocardial scar. The viability of each LV sample was displayed on the polar map of LV viability.
The LV dyssynchrony quantification tool.
The gated short-axis images were input into the same automatic sampling algorithm as in the perfusion quantification tool for each LV cardiac frame. The phase analysis tool based on the first-harmonic Fourier approximation12,16,18 was used to calculate the contraction onset for each sample. The phase angle of each LV myocardial voxel was displayed on the polar map of LV mechanical dyssynchrony.
The latest contracting LV viable segments were identified using the 17 segment model.
Visual integration method by experts to recommend the optimal LV lead positions.
In the visual integration method, two experts visually and independently interpreted the MPI studies where three viable regions with the latest contraction onset were determined. Two nuclear cardiology experts separately read the pre-CRT images and the polar maps of LV myocardial perfusion (Figure 2A) and mechanical dyssynchrony (Figure 2B) of the 36 patients and noted their 1st, 2nd, and 3rd segmental choices. If the experts disagreed, they met and mitigated their differences by consensus. Only the consensus recommendations were reported, as illustrated in Figure 2C.
Figure 2.
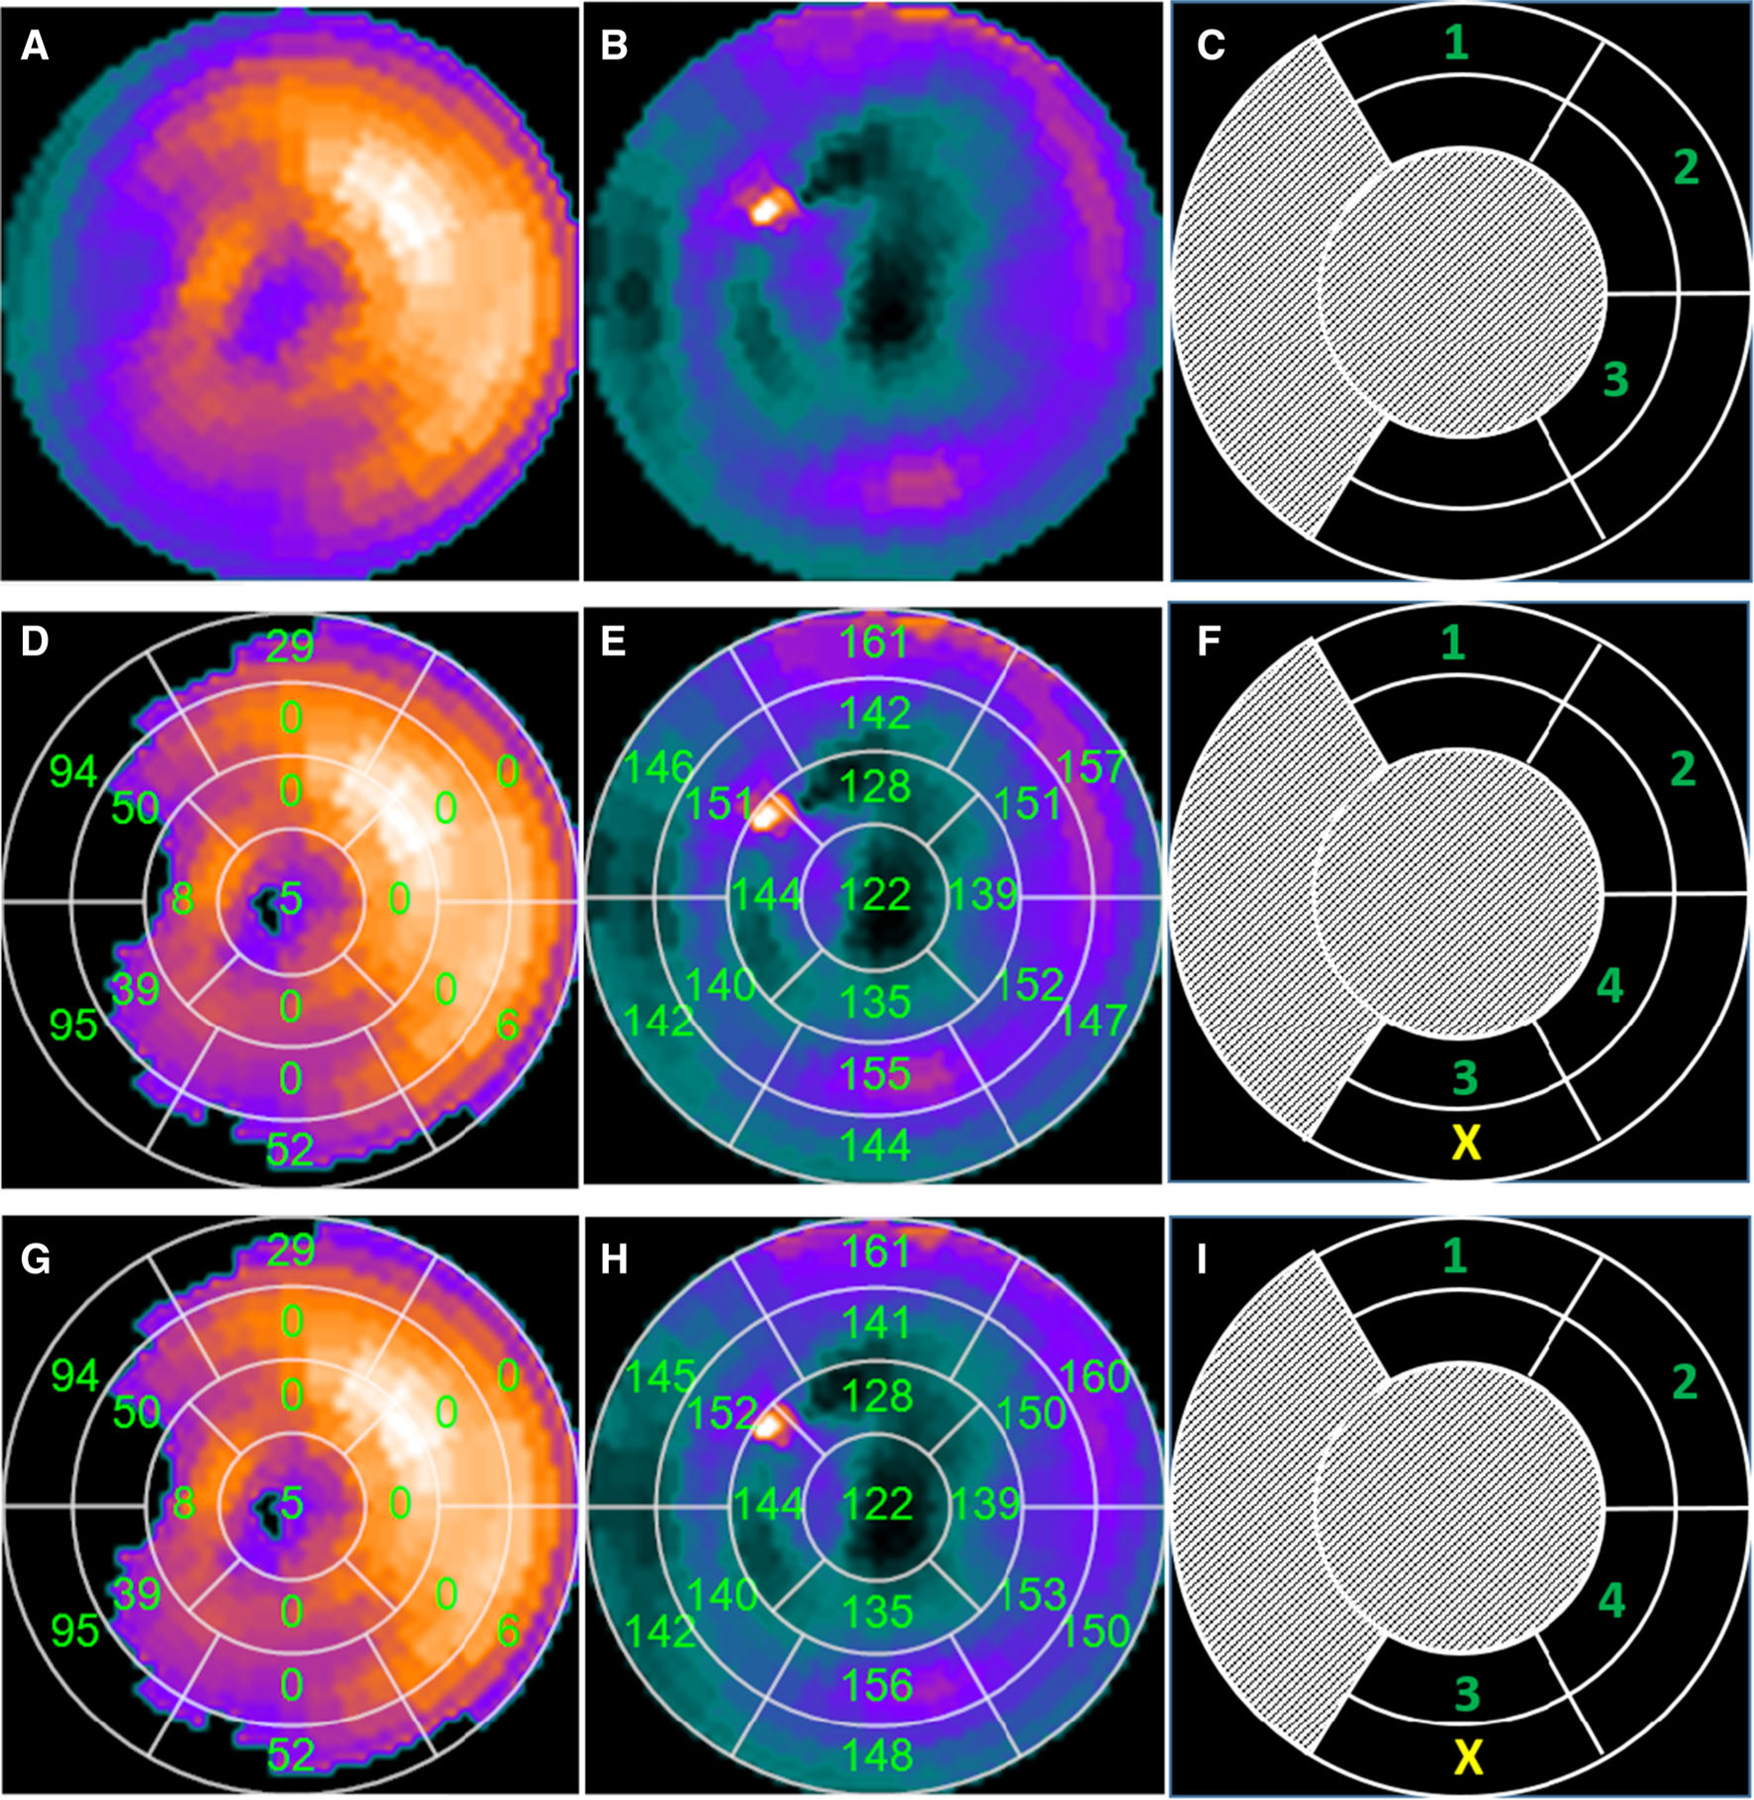
A patient example illustrating how the visual integration method by experts and automatic method recommended the left ventricular (LV) lead positions. A and B are the polar maps of LV myocardial viability and contraction onsets, respectively, which were visually analyzed by experts to recommend the LV lead positions, as illustrated in (C). D is the polar map of LV regional myocardial viability. The number in each segment of the AHA 17-segmentation polar map is the measured regional scar burden by percentage. If the number is more than 50%, the segment will be identified as scar and excluded for CRT implantation. E is the polar map of LV regional contraction onsets. The number in each segment of AHA 17-segmentation polar map is the measured regional phase angle or contraction delay. The greater the number is, the later the segment contracts. D and E were integrated by our automatic method to recommend the LV lead positions, as illustrated in (F). G is the polar map of LV regional myocardial viability by a second independent operator. H is the polar map of LV regional contraction onsets by the second operator. G and H were integrated by our automatic method to recommend the LV lead positions, as shown in (I). The apical and septal segments (whiteout segments) and scar segments (marked with the yellow ‘‘X’’) were excluded when recommending the LV lead positions. The recommended LV lead positions were ranked based on the contraction delays.
Automatic method to recommend the optimal LV lead positions.
In the automatic method, the regions below 50% of the maximum resting perfusion on the viability polar map, as illustrated in Figure 2D, were defined as scar regions. The apical segments, septal segments, and segments with more than 50% scar were excluded for the recommendation of the optimal LV lead positions. Amongst the remaining viable segments, as shown in Figure 2E, the segments whose phase angles were within 10° of the largest phase angle (Figure 2F) were recommended as the appropriate LV lead positions, whose priorities were ranked based on phase angles. Four segmental choices at maximum were recommended for each patient.
Determination of the Accuracy of Automatic Method and Its Inter-operator Reproducibility
The segmental relationship between two LV lead positions was defined as the same if they were in the same segment; adjacent if they were in two different segments whose distance was not more than one segment dimension (as illustrated by segments marked with 3 and 4 in Figure 2F); and different if they were neither the same nor adjacent.
Both the visual integration and automatic methods were tested in 36 pre-CRT patients who underwent gated SPECT MPI. Accuracy of the automatic method was determined as the percent agreement of segmental relationship with the visual integration method from the consensus readings by the two experts.
The automatic method was performed again by a second operator to evaluate the inter-operator reproducibility. The second operator was blinded to the results of the first operator and experts. Noteworthy, the manual operation was involved in only one major step (Figure 1).
RESULTS
Visual Integration Method vs. The Automatic Method
Figure 3A shows the agreement of the latest contracting viable LV segments between the automatic method by the first operator and the visual integration method by experts. The visual integration method used the same polar maps provided by the first operator. The automatic method’s 1st choice matched the experts’ consensus 1st choice in 35/36 patients (97.2%). In addition, all the 1st choices of automatic method by the first operator were one of the experts’ consensus choices, and vice versa. The Kappa agreement rate between all the choices by the first operator and the visual integration method was 0.89 (95% confidence interval: 0.83–0.95, p < .0005).
Figure 3.

Segmental agreement between the visual integration method and automatic method by two independent operators. A Segmental agreement between the visual integration method and the first operator. B Segmental agreement between the visual integration method and the second operator. C Segmental agreement between the two operators. Same, the recommended left ventricular lead positions are in the same segments; adjacent, the recommended left ventricular lead positions are in the adjacent segments; different, the recommended left ventricular lead positions are neither the same nor adjacent.
Figure 3B shows the agreement of the latest contracting viable LV segments between the automatic method by the second operator and the visual integration method by experts. The automatic method’s 1st choice matched the experts’ consensus 1st choice in 24/36 patients (66.7%). In 7/36 patients (19.4%), they were adjacent. In addition, in 34/36 patients (94.4%), the automatic method’s 1st choice by the second operator was one of the experts’ consensus 3 choices (in any order); in 28/36 patients (77.8%), the experts’ consensus 1st choice was one of the automatic method’s 3 choices by the second operator.
Inter-operator Reproducibility
The inter-operator reproducibility of the 1st choice when identifying the latest contracting viable LV segments.
Figure 3C shows the agreement of the 1st choice between the latest contracting viable LV segments determined by the automatic method by the first operator and the second operator. The second operator’s 1st choice matched the first operator’s 1st choice in 25/36 patients (69.4%). In 7/36 patients (19.4%), they were adjacent.
The inter-operator reproducibility of all the choices when identifying the latest contracting viable LV segments.
In 29/36 patients (80.6%), the second operator’s 1st choice was one of the first operator’s choices (in any order), and in 31/36 patients (86.1%), the first operator’s 1st choice was one of the second operator’s choices (in any order). The Kappa agreement rate between all the choices by the two operators was 0.74 (95% confidence interval: 0.64–0.84, p < .0005).
Segmental Distribution of the Recommended LV Lead Positions
Figure 4 shows the segmental distribution of the recommended LV lead positions using our automatic determination by the first operator of the latest contracting viable LV segments as candidates for CRT LV probe placement. Based on the recommended 1st choices, the LV leads should be placed in the anterior wall in 20 patients (55.6%), in the anterolateral wall in 2 patients (5.6%), in the posterolateral wall in 11 patients (30.5%), in the posterior wall in 3 patients (8.4%). Based on all the recommended choices, the recommended LV lead positions were in the anterior wall in 25 choices (37.9%), in the anterolateral wall in 13 choices (19.7%), in the posterolateral wall in 17 choices (25.8%), in the lateral wall in 11 choices (16.7%).
Figure 4.
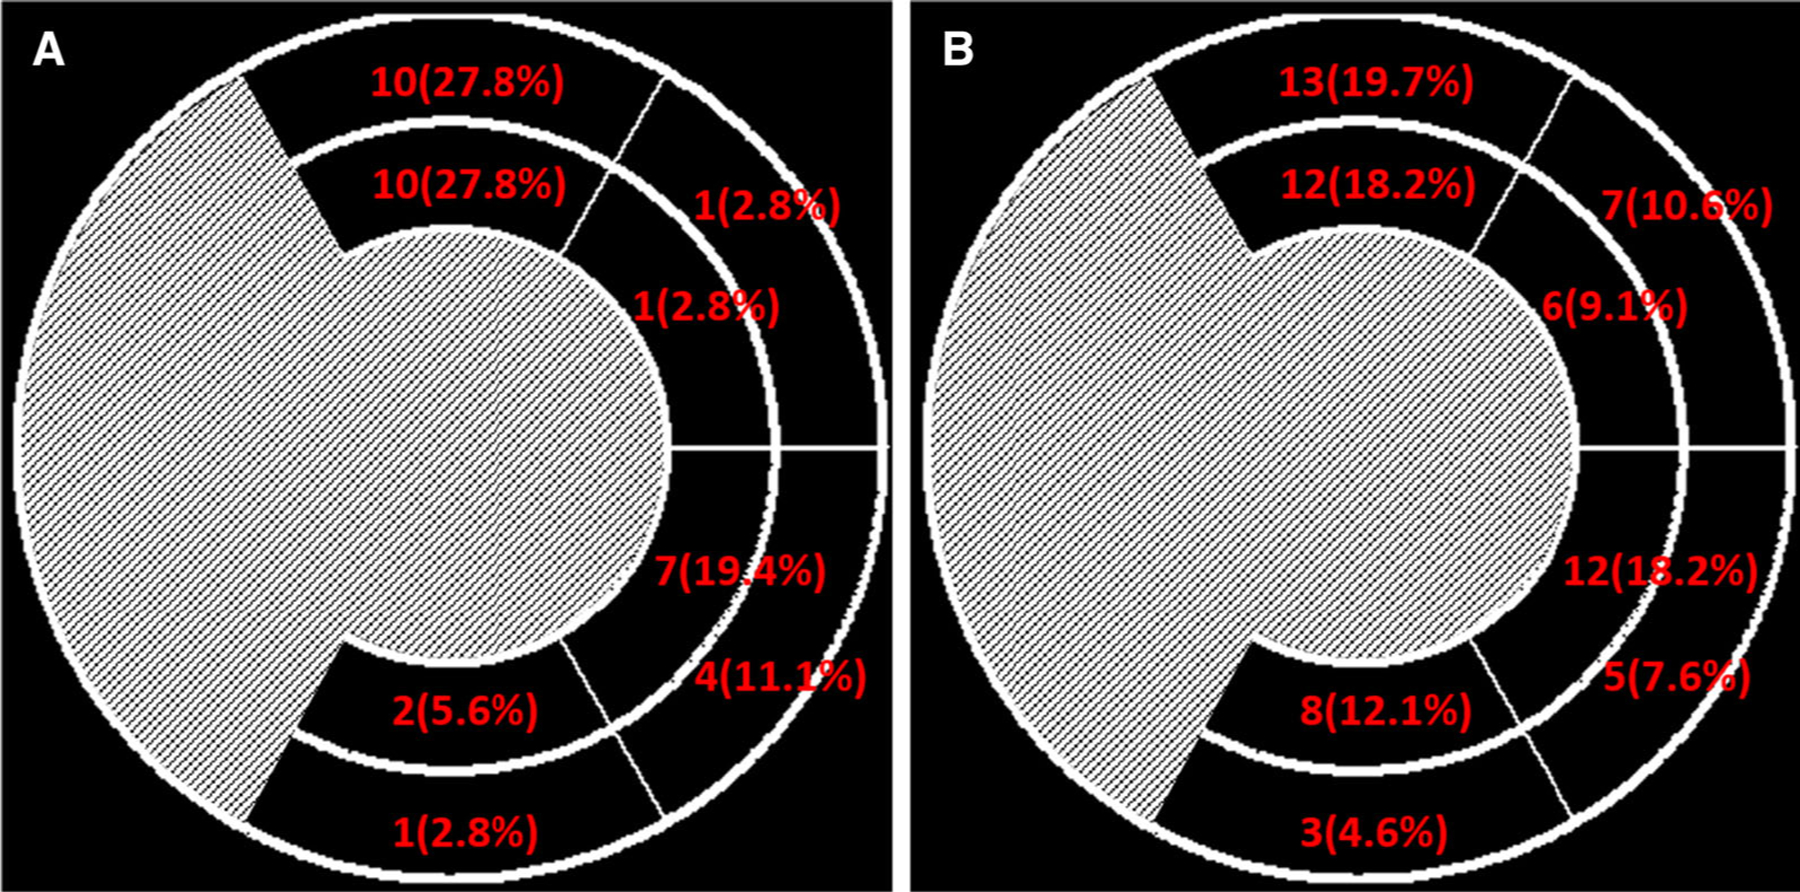
Segmental distribution of the LV lead positions recommended by the first operator. A only the 1st choice; B all the choices.
DISCUSSION
An automatic method to determine the latest contracting viable LV segments from the SPECT MPI has been developed and validated against the visual integration method by experts. It had an agreement of 97.2% when validated against the visual integration method and an overall inter-operator reproducibility of 88.8% in 36 pre-CRT patients.
Our Automatic Method has High Agreement with Experts
In this study, visual integration of LV myocardial viability and mechanical dyssynchrony by experts were used as the reference standard to determine the latest contracting viable LV segments to help guide CRT LV probe placement. Our automatic method showed excellent agreement with the reference standard. When using the same LV parameters, the automatic method’s 1st choice matched the experts’ consensus 1st choice in 97.2% patients.
When the second operator specified the LV parameters and ran the software tool independently, the automatic method’s 1st choice matched the experts’ consensus 1st choice in 66.7% patients, and in 19.4% patients they were adjacent. As a consequence, the automatic method showed a high agreement with the visual integration method by experts. The reason for reduced agreement with the second operator’s processing was that the experts’ consensus reading was performed only from the data generated by the first operator.
Our Automatic Method has Good Inter-operator Reproducibility
Reproducibility is a key factor in detecting the latest contracting viable LV segments to help guide CRT. In a number of single-center clinical trials, echocardiography has showed its clinical value to recommend the LV lead positions. The TARGET clinical trial19 demonstrated that the patients whose LV leads were placed in the viable myocardium with the latest site of contraction onset measured by echocardiography had a higher CRT response than the patients whose LV leads were placed as suggested by the standard guidelines (83% vs. 65%, p = .003). Nevertheless, in the large randomized prospective multi-center PROSEPCT clinical trial guided by echocardiography,20 it was found that the reproducibility arising from technical and interpretative factors influenced the clinical value of guidance parameters measured from echocardiography. As a consequence, the echo-guided technique failed to improve the CRT response beyond the current guidelines.
SPECT MPI has shown good reproducibility in assessing both LV myocardial viability and mechanical dyssynchrony. A reproducibility of 96% was reported in the quantitative analysis of perfusion defect from serial exercise thallium-201 SPECT MPI.21 The technique using gated SPECT to assess LV contraction onset by phase analysis has also shown good reproducibility.22,23 Thereafter, the reproducibility will be promising to recommend the LV lead positions by the integration of myocardial viability and mechanical dyssynchrony from SPECT MPI.
The clinical evaluation in this study confirmed that there was a good inter-operator reproducibility. The second operator’s 1st choice matched the first operator’s 1st choice in 69.4% patients; in 19.4% patients, they were adjacent. There was an overall agreement of 88.8% between these two independent operators.
Factors Which Caused the Disagreement
The major reason causing the disagreements between the visual integration method by experts and automatic methods by two independent operators was the measurement of regional phase angles, which determined the ranking of multiple segmental choices. Figure 5 shows the only patient for whom the automatic method’s 1st choice by the first operator did not match the experts’ consensus 1st choice. The difference of phase angles between the first and second choice, as in Figure 5F, was only 1°, which was too small for the visual integration by experts to differentiate.
Figure 5.

A patient example illustrating the discrepancies between visual integration and automatic methods. The experts integrated quantifications of myocardial viability (A) and contraction delays (B), and recommended segments (C). The automatic method measured regional myocardial perfusion (D) and contraction delays (E), and recommended segments (F).
The inter-operator reproducibility of measuring myocardial viability and mechanical dyssynchrony from gated SPECT MPI has been well investigated in previous studies.21–23 In our study, the regional scar burden caused the inter-operator variation in only 2 of 36 patients (5.6%) and the regional phase angle differences caused the inter-operator variation of the 1st choices in 9 of 36 (25%) patients. It should be noted that 9 of these 11 disagreement patients had more than one choice.
It has been demonstrated that with clinically equivalent counts, the temporal resolution of phase analysis from 8-frame ECG-gated SPECT MPI is 1/64 of a cardiac cycle, corresponding to a phase difference of 5.6°.24 Noteworthy, in the 9 patients whose 1st choices by the first and second operator disagreed, it was found that there was a phase angle difference of smaller than 5.6° in 7 patients (77.8%). Consequently, we conjecture that the limited temporal resolution by ECG-gated SPECT MPI significantly influenced the region-based recommendation of optimal LV lead positions, but it did not influence the global measurement of mechanical dyssynchrony in previous studies.23
The operations which influenced the measurement of scar burden and mechanical dyssynchrony, and thus, the reproducibility was the specification of LV parameters, including LV center, radius, apex, and base. The biggest variation was the selection of base in gated MPI images. An algorithm25 was used to suggest the selection of the LV base, and then the operators could adjust the base slices particularly to optimize the automatic phase analysis.26 Nevertheless, several factors still caused ambiguities during the selection of base slices: (1) the limited resolution of MPI images and the partial volume effect, making the boundary between the LV myocardial base and background unclear; (2) the gating error, patient and heart motion, and perfusion defect near bases.
Clinical Implication of Using Our Automatic Method to Guide CRT
The standard guidelines recommend that CRT LV lead be placed in lateral or posterolateral wall of the LV myocardium.10 However, according to the segmental distribution of the recommended LV lead positions using our automatic determination in Figure 4, based on the recommended 1st choices, the majority was in the anterior wall (55.6%), and there were 36.1% in the lateral wall. Based on all the recommended choices, the majority was in the lateral wall (45.5%) and there were 37.9% in the anterior wall. Thereafter, there was slightly moderate agreement between the current guidelines and our recommendations. Considering 30–40% patients who have CRT do not respond to CRT, it is very important to develop new image-guided strategies to recommend the optimal LV lead positions.
Clinical Significance of Multiple Choices in the Recommendation of LV Lead Positions
Noteworthy, our automatic method may recommend more than one LV lead position. In the results of the automatic method by the first operator, there were only one choice in 19 patients (52.8%), two choices in 8 patients (22.2%), three choices in 5 patients (13.8%), and four choices in 4 patients (11.1%). Recommending multiple choices of the concordant LV lead positions is an important new concept in this study because all the viable segments with the late contraction onsets (within 10° of the largest phase angle) can be recommended for the LV lead placement. As shown in Figure 2, since all the 4 segments have very similar contraction onsets, any of them may allow the patient to respond to CRT. In this situation, the best strategy is to recommend more than one segment. Moreover, it is more important to specifically exclude the segments with severe scar burden in the clinical report.
More importantly, in the current transvenous CRT LV lead placement practice, the optimal LV lead segment may not contain any suitable venous branch for LV lead placement, so multiple choices when recommending LV segments will increase the chance of identifying favorable coronary venous site and thus improve the CRT response rate. This is even more clinically useful when coupled with our image fusion technique,27 which fuses the myocardial surface from SPECT MPI with 3D coronary veins from fluoroscopy venograms.
Nevertheless, it is uncommon to recommend multiple choices for LV lead placement (52.8% vs 11.1% for only one choice and four choices, respectively). The number of the choices depends on the extent of LV dyssynchrony. LV dyssynchrony is an essential parameter for predicting CRT response.15,28 Phase standard deviation (PSD) and phase bandwidth (PBW) are the two commonly used dyssynchrony indices in phase analysis.29 The cut-off values PSD > 43° and PBW > 135° in LV baseline dyssynchrony were recommended to predict CRT response.30 The PSD and PBW of all the 4 patients who had four choices did not meet the selection criteria of LV baseline dyssynchrony. Accordingly, if LV baseline dyssynchrony was added to CRT patient selection, the number of recommended LV lead positions might be reduced.
Study limitations.
There are several limitations. First our automatic method was validated using experts subjective determination of the latest contracting viable segments, albeit with the aid of quantitative tools for determining myocardial viability and delay of the onset of contraction. Second, the inherent technical limitations due to the spatial and temporal resolution in gated SPECT MPI may influence the accuracy of quantifications of myocardial viability and mechanical dyssynchrony, which thus influences the accuracy of recommending the optimal CRT LV lead positions. Third, no CRT leads were actually placed in the viable LV regions with the latest onset of contraction to determine whether the patients would indeed respond to the therapy. Finally, our method was tested retrospectively in a relatively small sample size. A validation in a larger prospective population is needed to establish its clinical usefulness.
NEW KNOWLEDGE GAINED
A new automatic method has been developed to detect the latest contracting viable LV segments to help guide CRT therapy. This method integrates LV myocardial viability and mechanical dyssynchrony from gated SPECT MPI. The clinical study demonstrates that our method has high agreement with the visual integration method by experts and good inter-operator reproducibility.
CONCLUSIONS
An automatic method has been developed to detect the latest contracting viable LV segments to help guide CRT therapy from gated SPECT MPI. The retrospective clinical study with 36 patients suggests that this method has high agreement with the visual integration method by experts and good inter-operator reproducibility. This automatic method promises to be a useful clinical tool to help guide CRT therapy.
Supplementary Material
Acknowledgements
This research was supported by a grant from the American Heart Association (15POST22690035, PI: Weihua Zhou, Ph.D.) and a New Faculty startup grant from the University of Southern Mississippi (Project Number: DE01791). This research was also partly supported by a grant from National Natural Science Foundation of China (Project Number: 81470457, PI: Jiangang Zou, MD).
Abbreviations
- SPECT
Single-photon emission computed tomography
- MPI
Myocardial perfusion imaging/images
- LV
Left ventricle/ventricular
- CRT
Cardiac resynchronization therapy
- OSEM
Ordered subset expectation maximization
Footnotes
Electronic supplementary material The online version of this article (doi:10.1007/s12350-017-0853-8) contains supplementary material, which is available to authorized users.
The authors of this article have provided a PowerPoint file, available for download at SpringerLink, which summarises the contents of the paper and is free for re-use at meetings and presentations. Search for the article DOI on SpringerLink.com.
Dr. Zhou, conducted the technical development. Mr. Tao, enrolled the patients and performed the clinical studies.
Disclosures
Dr. Garcia and Mr. Folks receive royalties from the sale of the Emory Cardiac Toolbox. The terms of this arrangement have been reviewed and approved by Emory University in accordance with its conflict-of-interest practice. All other authors have nothing to declare.
References
- 1.Abraham WT, Fisher WG, Smith AL, Delurgio DB, Leon AR, Loh E, et al. Cardiac resynchronization in chronic heart failure. N Engl J Med 2002;346:1845–53. [DOI] [PubMed] [Google Scholar]
- 2.Young JB, Abraham WT, Smith AL, Leon AR, Lieberman R, Wilkoff B, et al. Combined cardiac resynchronization and implantable cardioversion defibrillation in advanced chronic heart failure: The MIRACLE ICD Trial. JAMA. 2003;289:2685–94. [DOI] [PubMed] [Google Scholar]
- 3.Bax JJ, Bleeker GB, Marwick TH, Molhoek SG, Boersma E, Steendijk P, et al. Left ventricular dyssynchrony predicts response and prognosis after cardiac resynchronization therapy. J Am Coll Cardiol 2004;44:1834–40. [DOI] [PubMed] [Google Scholar]
- 4.Saba S, Marek J, Schwartzman D, Jain S, Adelstein E, White P, et al. Echocardiography-guided left ventricular lead placement for cardiac resynchronization therapy: Results of the Speckle Tracking Assisted Resynchronization Therapy for Electrode Region trails. Circ Heart Fail 2013;6(3):427–34. [DOI] [PubMed] [Google Scholar]
- 5.Singh JP, Klein HU, Huang DT, Reek S, Kuniss M, Quesada A, et al. Left ventricular lead position and clinical outcome in the multicenter automatic defibrillator implantation trial-cardiac resynchronization therapy (MADIT-CRT) trial. Circulation 2011;123:1159–66. [DOI] [PubMed] [Google Scholar]
- 6.Donal E, de Chillou C, Magnin-Poull I, Leclercq C. Imaging in cardiac resynchronization therapy: What does the clinician need? Europace 2008;10:370–2. [DOI] [PubMed] [Google Scholar]
- 7.Bleeker GB, Kaandorp TA, Lamb HJ, Boersma E, Steendijk P, de Roos A, et al. Effect of postero-lateral scar tissue on clinical and echocardiographic improvement after cardiac resynchronization therapy. Circulation 2006;113:969–76. [DOI] [PubMed] [Google Scholar]
- 8.Ypenburg C, van Bommel RJ, Delgado V, Mollema SA, Bleeker GB, Boersma E, et al. Optimal left ventricular lead position predicts reverse remodeling and survival after cardiac resynchronization therapy. J Am Coll Cardiol 2008;52:1402–9. [DOI] [PubMed] [Google Scholar]
- 9.Khan FZ, Virdee MS, Fynn SP, Dutka DP. Left ventricular lead placement in cardiac resynchronization therapy: Where and how? Europace 2009;11:554–61 [DOI] [PubMed] [Google Scholar]
- 10.2012 ACCF/AHA/HRS focused update incorporated into the ACCF/AHA/HRS 2008 guidelines for device-based therapy of cardiac rhythm abnormalities: a report of the American College of Cardiology Foundation/American Heart Association Task Force on Practice Guidelines and the Heart Rhythm Society. Circulation 2013;127:e283–352. [DOI] [PubMed] [Google Scholar]
- 11.Murphy RT, Sigurdsson G, Mulamalla S, Agler D, Popovic ZB, Starling RC, et al. Tissue synchronization imaging and optimal left ventricular pacing site in cardiac resynchronization therapy. Am J Cardiol 2006;97:1615–21. [DOI] [PubMed] [Google Scholar]
- 12.Boogers MJ, Chen J, van Bommel RJ, Borleffs CJW, Dibbets-Schneider P, van der Hiel B, et al. Optimal left ventricular lead position assessed with phase analysis on gated myocardial perfusion SPECT. Eur J Nucl Med Mol Imaging 2011;38:230–8. [DOI] [PMC free article] [PubMed] [Google Scholar]
- 13.Bleeker GB, Kaandorp TA, Lamb HJ, Boersma E, Steendijk P, de Roos A, et al. Effect of postero-lateral scar tissue on clinical and echocardiographic improvement after cardiac resynchronization therapy. Circulation 2006;113:969–76. [DOI] [PubMed] [Google Scholar]
- 14.Kronborg MB, Kim WY, Mortensen PT, Niesen JC. Non-contrast magnetic resonance imaging for guiding left ventricular lead position in cardiac resynchronization therapy. J Interv Card Electrophysiol 2012;33(1):27–35. [DOI] [PubMed] [Google Scholar]
- 15.Zhou W, Garcia EV. Nuclear image-guided approaches for CRT. Curr Cardiol Rep 2016;18:1–11. [DOI] [PMC free article] [PubMed] [Google Scholar]
- 16.Friehling M, Chen J, Saba S, Bazaz R, Schwartzman D, Adelstein EC. A prospective pilot study to evaluate the relationship between acute change in left ventricular synchrony after cardiac resynchronization therapy and patient outcome using a single-injection gated SPECT protocol. Circ Cardiovasc Imaging 2011;4:532–9. [DOI] [PMC free article] [PubMed] [Google Scholar]
- 17.Garcia EV, Cooke CD, Van Train KF. Technical aspects of myocardial SPECT imaging with technetium-99 m sestamibi. Am J Cardiol 1990;66:23E–31E. [DOI] [PubMed] [Google Scholar]
- 18.Chen J, Garcia EV, Folks RD, Cooke CD, Faber TL, Tauxe EL, et al. Onset of left ventricular mechanical contraction as determined by phase analysis of ECG-gated myocardial perfusion SPECT imaging: Development of a diagnostic tool for assessment of cardiac mechanical dyssynchrony. J Nucl Cardiol 2005;12:687–95. [DOI] [PubMed] [Google Scholar]
- 19.Khan FZ, Virdee MS, Palmer CR, Pugh PJ, O’Halloran D, Elsik M, et al. Targeted left ventricular lead placement to guide cardiac resynchronization therapy: The TARGET study: a randomized, controlled trial. J Am Coll Cardiol 2012;59:1509–18. [DOI] [PubMed] [Google Scholar]
- 20.Chung ES, Leon AR, Tavazzi L, Sun JP, Nihoyannopoulos P, Merlino J, et al. Results of the predictors of response to CRT (PROSEPCT) trial. Circulation 2008;117:2608–16. [DOI] [PubMed] [Google Scholar]
- 21.Berman DS, Kang X, Gransar H. Quantitative assessment of myocardial perfusion abnormality on SPECT myocardial perfusion imaging is more reproducible than expert visual analysis. J Nucl Cardiol 2009;16:45–53. [DOI] [PMC free article] [PubMed] [Google Scholar]
- 22.Trimble MA, Velazquez EJ, Adams GL, Honeycutt EF, Pagnanelli RA, Barnhart HX, et al. Repeatability and reproducibility of phase analysis of gated SPECT myocardial perfusion imaging used to quantify cardiac dyssynchrony. Nucl Med Commun 2008;29:374–81. [DOI] [PMC free article] [PubMed] [Google Scholar]
- 23.Lin X, Xu H, Zhao X, Folks RD, Faber TL, Garcia EV, et al. Repeatability of left ventricular dyssynchrony and function parameters in serial gated myocardial perfusion SPECT studies. J Nucl Cardiol 2010;17:811–6. [DOI] [PMC free article] [PubMed] [Google Scholar]
- 24.Chen J, Faber TL, Cooke CD, Garcia EV. Temporal resolution of multiharmonic phase analysis of ECG-gated myocardial perfusion SPECT studies. J Nucl Cardiol 2008;15:383–91. [DOI] [PMC free article] [PubMed] [Google Scholar]
- 25.Zhou Y, Faber TL, Patel Z, Folks RD, Cheung AA, Garcia EV, et al. An automatic alignment tool to improve repeatability of left ventricular function and dyssynchrony parameters in serial gated myocardial perfusion SPECT studies. Nucl Med Commun 2013;34:124–9. [DOI] [PMC free article] [PubMed] [Google Scholar]
- 26.Folks RD, Cooke CD, Garcia EV. Optimizing gated myocardial perfusion imaging processing for phase analysis. J Nucl Cardiol 2016. doi: 10.1007/s12350-016-0503-6. [DOI] [PubMed] [Google Scholar]
- 27.Zhou W, Hou X, Piccinelli M, Tang X, Tang L, Cao K, et al. 3D fusion of LV venous anatomy on fluoroscopy venograms with epicardial surface on SPECT myocardial perfusion images for guiding CRT LV lead placement. JACC Cardiovasc Imaging 2014;7:1239–48. [DOI] [PubMed] [Google Scholar]
- 28.Bleeker GB, Mollema SA, Holman ER, Van De Veire N, Ypenburg C, Boersma E, et al. Left ventricular resynchronization is mandatory for response to cardiac resynchronization therapy: Analysis in patients with echocardiographic evidence of left ventricular dyssynchrony at baseline. Circulation 2007;116:1440–8. [DOI] [PubMed] [Google Scholar]
- 29.Chen J, Garcia EV, Folks RD, Cooke CD, Faber TL, Tauxe EL, et al. Onset of left ventricular mechanical myocardial perfusion SPECT imaging: Development of a diagnostic tool for assessment of cardiac mechanical dyssynchrony. J Nucl Cardiol 2005;12:687–95. [DOI] [PubMed] [Google Scholar]
- 30.Henneman MM, Chen J, Dibbets-Schneider P, Stokkel MP, Bleeker GB, Ypenburg C, et al. Can LV dyssynchrony as assessed with phase analysis on gated myocardial perfusion SPECT predict response to CRT? J Nucl Med 2007;48:1104–11. [DOI] [PubMed] [Google Scholar]
Associated Data
This section collects any data citations, data availability statements, or supplementary materials included in this article.