

Abstract
The oligomeric organization of membrane proteins in native cell membranes is a critical regulator of their function. High-resolution quantitative measurements of oligomeric assemblies and how they change under different conditions are indispensable to understanding membrane protein biology. We report a total internal reflection fluorescence (TIRF) microscopy-based single-molecule photobleaching step analysis technique, Native-nanoBleach, to determine the oligomeric distribution of membrane proteins directly from native membranes at an effective spatial resolution of ~10 nm. We achieved this by capturing target membrane proteins in “native nanodiscs” with their proximal native membrane environment using amphipathic copolymers. We applied Native-nanoBleach to quantify the oligomerization status of structurally and functionally diverse membrane proteins, including a receptor tyrosine kinase (TrkA) and a small GTPase (KRas) under growth-factor binding and oncogenic mutations, respectively. Our data suggests that native-nanoBleach provides a sensitive, single-molecule platform to quantify membrane protein oligomeric distributions in native membranes under physiologically and clinically relevant conditions.
Introduction
The oligomeric organization of membrane proteins in their native membrane environment plays a critical role in regulating their physiological function1,2. Advances in light microscopy have provided insights into the organization of macromolecular assemblies in cells and complex tissues3–5. Yet determining the precise oligomeric distribution of membrane protein assemblies directly from the native cell membrane environment at simultaneously high molecular and nanoscale-spatial resolution remains a challenging problem.
Membrane protein oligomeric states are commonly characterized in cells or on membrane-mimetic platforms by fluorescence correlation/cross-correlation spectroscopy6,7, subunit counting using photobleaching step analysis8,9, single-particle tracking10,11, and single-molecule localization microscopy (SMLM)3,4,12. The spatial resolution in the light microscopy-based techniques listed here is restricted by the diffraction limit of light (~200 nm) with the exception of SMLM that can achieve up to ~20–50 nm3,12,13. A recent localization-based super-resolution technique (MINFLUX) can achieve ~1–6 nm spatial resolution in cells, but uses highly specialized hardware that may restrict easy adoption14,15. Also, the current small field of view in MINFLUX limits collection of sufficient single-particle statistics for detection of heterogeneous or infrequent events on native membranes14. A recent native mass spectrometric study reports determination of oligomeric organization of overexpressed, detergent-solubilized membrane proteins after reconstitution into membrane-mimetic liposomes16. Moreover, the current sensitivity of native mass spectrometry limits its application in determining oligomeric status of membrane proteins at endogenous expression levels. To summarize, most cell-based readouts preserve the native membrane environment but often lack sufficient spatial and molecular resolution to distinguish genuine oligomerization from spatially-proximal colocalization3,4,17. Membrane-mimetic platforms, on the other hand, offer molecular resolution but fail to mimic the complexity of cell membranes, which may influence the oligomeric organization of embedded proteins1,18,19.
The challenge lies in achieving sufficient lateral spatial resolution to distinguish protein subunits forming bona fide oligomeric interfaces from those that are simply in close proximity within the native membrane environment, while using light microscopy that cannot resolve particles closer than ~200 nm13. Another challenge is obtaining single-molecule density of membrane proteins on native membranes. Genetic and other approaches can lower protein concentrations on cell membranes for single-molecule detection9,20. But this could alter physiological oligomeric distributions if the protein concentration is reduced below the required threshold for assembly21. Under-labeling of membrane proteins with fluorescent moieties provides an alternate approach to achieving single-molecule density on native membranes, but ignores the participation of unlabeled subunits in observed oligomeric assemblies20. New methods that afford single-molecule resolution of membrane proteins on native membranes at endogenous expression levels are needed.
Addressing these challenges, we present a total internal reflection fluorescence (TIRF) microscopy-based single-molecule photobleaching step analysis technique, Native-nanoBleach, that directly detects and quantifies the oligomeric distribution of membrane proteins in 8 – 12 nm circular patches of native membranes or “native nanodiscs”. Here, we have established Native-nanoBleach by studying structurally and functionally diverse membrane proteins with well-established oligomeric states. We next applied our method to determine the oligomeric organization of selected members of the receptor tyrosine kinase (RTK)-Ras-MAPK signaling pathway – the nerve growth factor (NGF) receptor TrkA22,23 and the small GTPase KRas4B (called KRas hereafter)24–26. With advances in gene-editing technologies, it has become routine to attach fluorescent tags to endogenous proteins in animal models or patient-derived cells27,28. This portends broad applications of Native-nanoBleach to determine oligomeric organizations of endogenously-tagged membrane proteins in native membrane environments, under various physiologically and clinically-relevant conditions, at ~10 nm spatial and single-molecule resolution.
Results
Native-nanoBleach analysis of membrane protein oligomeric organization
Our approach isolates native nanodiscs by detergent-free solubilization of cell membranes using commercially available amphipathic copolymers (styrene maleic acid (SMA) or styrene acrylic acid (AASTY), Fig. 1a)29–31. The solubilized, monomeric eGFP32-tagged (called GFP hereafter) membrane proteins are surrounded by an annular ring of native lipids and neighboring proteins held together by the copolymers, preserving their proximal membrane environment. We purified native nanodiscs bearing fluorescently-tagged membrane proteins of interest by a combination of affinity and fluorescence-detection size exclusion chromatography (FSEC). We can either use genetically encoded fluorescent tags or biorthogonal conjugation techniques for site-specific labeling of membrane proteins in native nanodiscs33. We used the FSEC profiles to estimate the homogeneity and quality of the native nanodisc-target membrane protein complexes, monitoring the emission of fluorescent tags (Fig. 1b)34. The FSEC profile allows separation of soluble aggregates (void volume fractions) and proteolysis products from the native nanodisc-membrane protein complexes (GFP-positive non-void volume fractions) used in Native-nanoBleach. We used negative-stain electron microscopy to measure the size of these nanodiscs obtained using SMA or AASTY, which displayed narrow distributions with mean diameters of ~8.5 nm (std.dev. 2 nm) and ~12 nm (std.dev. 3 nm), respectively, across diverse samples (Fig. 1c, Fig. S1a–b).
Figure 1:

Native-nanoBleach approach to detect the oligomeric distribution of membrane proteins in their native membrane environments. (a) Schematic diagram of the workflow for Native-nanoBleach sample preparation. Membranes isolated from cells expressing GFP-tagged membrane proteins were solubilized with amphipathic copolymers to generate native nanodiscs. Native nanodiscs undergo either fluorescence detection size exclusion chromatography (FSEC), or affinity purification followed by FSEC. (b) Representative FSEC trace is shown for a native nanodisc encapsulated membrane protein (KRas WT) monitored for GFP fluorescence at 488 nm. (c) Size distribution of native nanodiscs by quantification of negative-stain EM images. Histogram shows the distribution of native nanodisc-KRas diameters (in nm) measured over ~1000 particles. (d) Depiction of the setup for TIRF-based single-nanodisc photobleaching step analysis. The cartoon details the functionalization of glass slides (substrates) to display a GFP nanobody trap for capturing GFP-tagged membrane proteins within native nanodiscs. (e) Representative single-molecule TIRF image where each green spot represents a single native nanodisc encapsulated protein (n > 20 independent experiments). (f) Representative photobleaching traces showing decrease in GFP intensity over time (9.3 frames/sec) for proteins bearing one, two, three, and four mature GFP subunits. The steps in each trace are highlighted using arrows and the background for each trace after photobleaching is reported as mean ± sd (also see Fig. S1d–e). Cartoons in (a, d) created using BioRender.com.
Our method relies on capturing well-separated single particles of GFP-tagged native nanodisc-membrane protein complexes on glass substrates functionalized with biotinylated GFP-nanobody (Fig. 1d, Fig. S2). Other affinity or antibody traps can also be used for capture based on the target protein. These native nanodisc complexes can be diluted in aqueous buffer before capture to achieve single-nanodisc density with no prior adjustments to protein expression at the cellular level (Fig. 1d–e). Each GFP-fluorescent spot in our TIRF images represents a single native nanodisc-membrane protein complex (Fig. 1e, Fig. S1c). We perform single-nanodisc photobleaching step analysis to determine protein oligomeric states (Fig. 1f). Since we count protein subunits within single nanodiscs, the effective lateral spatial resolution of our analysis is imposed by nanodisc diameters (~10 nm). This restricts imaging to ~20-fold smaller region than the diffraction limit of light using commercially available TIRF microscopes4,13. The photobleaching data were acquired by continuously exposing areas on the glass substrate to laser in TIRF mode and analyzed by plotting the time-dependent decrease in GFP-fluorescence intensity for each nanodisc (Fig. 1f, Fig. S1d–e). For each sample, discrete photobleaching steps were counted for a total of 3000–4000 nanodiscs from at least three biological replicates. These data are represented by a distribution ranging from 1 to 4 steps.
We obtained the oligomeric landscape of membrane proteins from this experimentally obtained step-distribution. The number of photobleaching steps underrepresents the number of subunits within an oligomer due to ~70% GFP maturation efficiency9,35. For example, 1-step photobleaching may arise from monomers but also from dimers with only one subunit carrying mature, fluorescent GFP. To account for dark GFP, we first obtained the theoretical probability distribution of how many subunits are GFP fluorescent within a given oligomeric state (monomer-tetramer), assuming 70% maturation. For proteins exhibiting a single stoichiometry (either monomer, dimer, trimer, or tetramer), we can directly match the experimental step distribution with one of these theoretical step distributions to identify their oligomeric status (Fig. 2a). For proteins with oligomeric distributions spanning across monomer to tetramer, we calculated the relative proportions of monomers, dimers, trimers, and tetramers whose combined theoretical distribution best fits the experimentally obtained step distribution (Fig. 2b–d). A detailed description of these calculations is provided in Supplementary Methods (also see code availability statement).
Figure 2:

Establishing Native-nanoBleach analysis using membrane proteins with well-established oligomeric states. (a) GFP-photobleaching step distribution of OMP25trunc (monomer), SemiSWEET (dimer), AmtB (trimer), KcsA (tetramer) in SMA-derived native nanodiscs. Each panel compares the experimentally-observed distribution of 1–4 steps with theoretical step-distribution corresponding to dimer, trimer and tetramer, respectively, assuming 70% maturation efficiency of GFP. (b) Cartoon depiction of the dimeric structure of LeuT (PDB_id: 3GJC). The zoomed panel highlights the mutated residues in the LeuT-AA mutant, F488 and Y489, which stabilize the dimeric interface through pi-stacking interactions. (c) Comparison of experimentally observed step-distribution of LeuT and LeuT-AA in SMA-derived native nanodiscs with the theoretical distribution corresponding to a dimer. (d) Oligomeric distribution of LeuT and the dimer interface mutant (AA) that matches the step distribution in (c), as calculated considering GFP maturation to be 70%. For (c-d), results of two-way ANOVA analysis showing differences in photobleaching step and oligomeric distributions between LeuT and LeuT-AA, with P-values and corresponding summaries, are reported. All photobleaching step-analysis shown in (a, c-d) are from a total of about 3000–4000 spots from n = three biologically independent samples. Data shown as mean ± sd. (e) Plot showing the theoretical probability of two protein subunits randomly colocalizing in a 10 nm × 10 nm area for a range of membrane protein surface densities (or membrane protein expression levels) in molecules/μm2.
Establishing Native-nanoBleach using membrane proteins with well-defined oligomeric states
To establish the broad applicability of Native-nanoBleach, we chose a structurally and functionally diverse set of membrane proteins, expressed in E. coli and mammalian cells, with stoichiometries ranging from monomer to tetramer (Table S1). We used four integral membrane proteins with well-defined stoichiometries to demonstrate the capabilities of Native-nanoBleach – the sugar transporter SemiSWEET (dimer)36, the ammonium transporter AmtB (trimer)37, the potassium ion channel KcsA (tetramer)38, and the amino acid transporter LeuT (monomer-dimer distribution)39. We also quantified the oligomeric state of a widely-used mitochondrial marker, a truncated version of the OMP25 protein (OMP25trunc, with the mitochondrial outer membrane-localizing single transmembrane domain only), a putative monomer40,41. Each protein was tagged with GFP at the N-terminus (for OMP25trunc) or C-terminus (SemiSWEET, AmtB, KcsA, LeuT). OMP25trunc was expressed in Expi293 cells and the other proteins were expressed in E. coli. We isolated these proteins in native nanodiscs (Fig. S3a–e) and performed Native-nanoBleach analysis.
The experimentally obtained photobleaching step distributions for OMP25trunc, SemiSWEET, AmtB, and KcsA closely matched the theoretical distributions for a monomeric, dimeric, trimeric, and tetrameric protein, respectively (Fig. 2a, Fig. S3f). Using these data, we established that the copolymers in native nanodiscs do not interfere with our analysis. We also established that the fraction of multi-step photobleaching events due to coincidental capture of nanodiscs on the same spot on glass substrates is insignificant. Using LeuT, we demonstrated the ability of our platform to identify perturbation-induced redistribution of oligomeric populations for membrane proteins that exist in an equilibrium of different oligomeric states. We showed that LeuT is predominantly dimeric (75%) with a small fraction of monomers (14%) (Fig. 2b–d). We introduced point mutations in LeuT (F488A and Y489A) that is predicted to weaken the LeuT dimer interface (PDB_id: 2A65)42 (Fig. 2b). This mutant (LeuT-AA) exhibited an increased monomeric population (53%) with decreased dimers (36%). These results are in good agreement with previous native mass spectrometry analysis of LeuT oligomerization39. By applying Native-nanoBleach to OMP25trunc, we also demonstrated the effectiveness of our technique in determining the oligomeric distribution of intracellular organellar (mitochondrial) membrane-localized proteins (Fig. 2a, Fig. S3f).
We next calculated the theoretical probability of two or more protein subunits randomly colocalizing within a 10 nm native nanodisc (approximated by 10×10 nm2 area) as a function of a wide range of membrane protein surface densities (in molecules/μm2) (Fig. 2e, see Supplementary Methods). We estimated that for surface density less than 1000 molecules/μm2, there is less than 0.5% probability of coincidental colocalization of subunits within 10×10 nm2 on membranes. At a spatial resolution of 20, 30, or 200 nm, the likelihood for similar coincidental overlap increases to 6%, 22%, and 100%, respectively, for surface density of 1000 molecules/μm2 (Fig. 2e). These data confirm the importance of lateral spatial resolution in determining oligomeric status of membrane proteins at varying expression levels. The estimated surface density of various membrane proteins rarely exceeds 1000 molecules/μm2 (e.g., EGFR-overexpressing A431 cancer cells display 636 molecules/μm2 of EGFR)43,44. Native-nanoBleach, with its ~10 nm effective lateral spatial resolution, is therefore capable of discriminating chance overlap from bona fide oligomerization over a wide range of surface expression levels.
Oligomeric distribution of the NGF receptor TrkA on native membranes
TrkA is an RTK that plays crucial roles in neuronal development and maintenance22. The canonical mechanism of RTK activation involves transition from unliganded monomers to growth factor-induced oligomers23. We analyzed TrkA-GFP oligomeric distribution in native nanodiscs isolated from SH-SY5Y cells in the presence or absence of NGF (Fig. 3a). SH-SY5Y cells show relatively lower basal TrkA-autophosphorylation (pY490) compared to Expi293 expression (Fig. S4) and display neurite outgrowth and increased pY490 in response to NGF.
Figure 3:
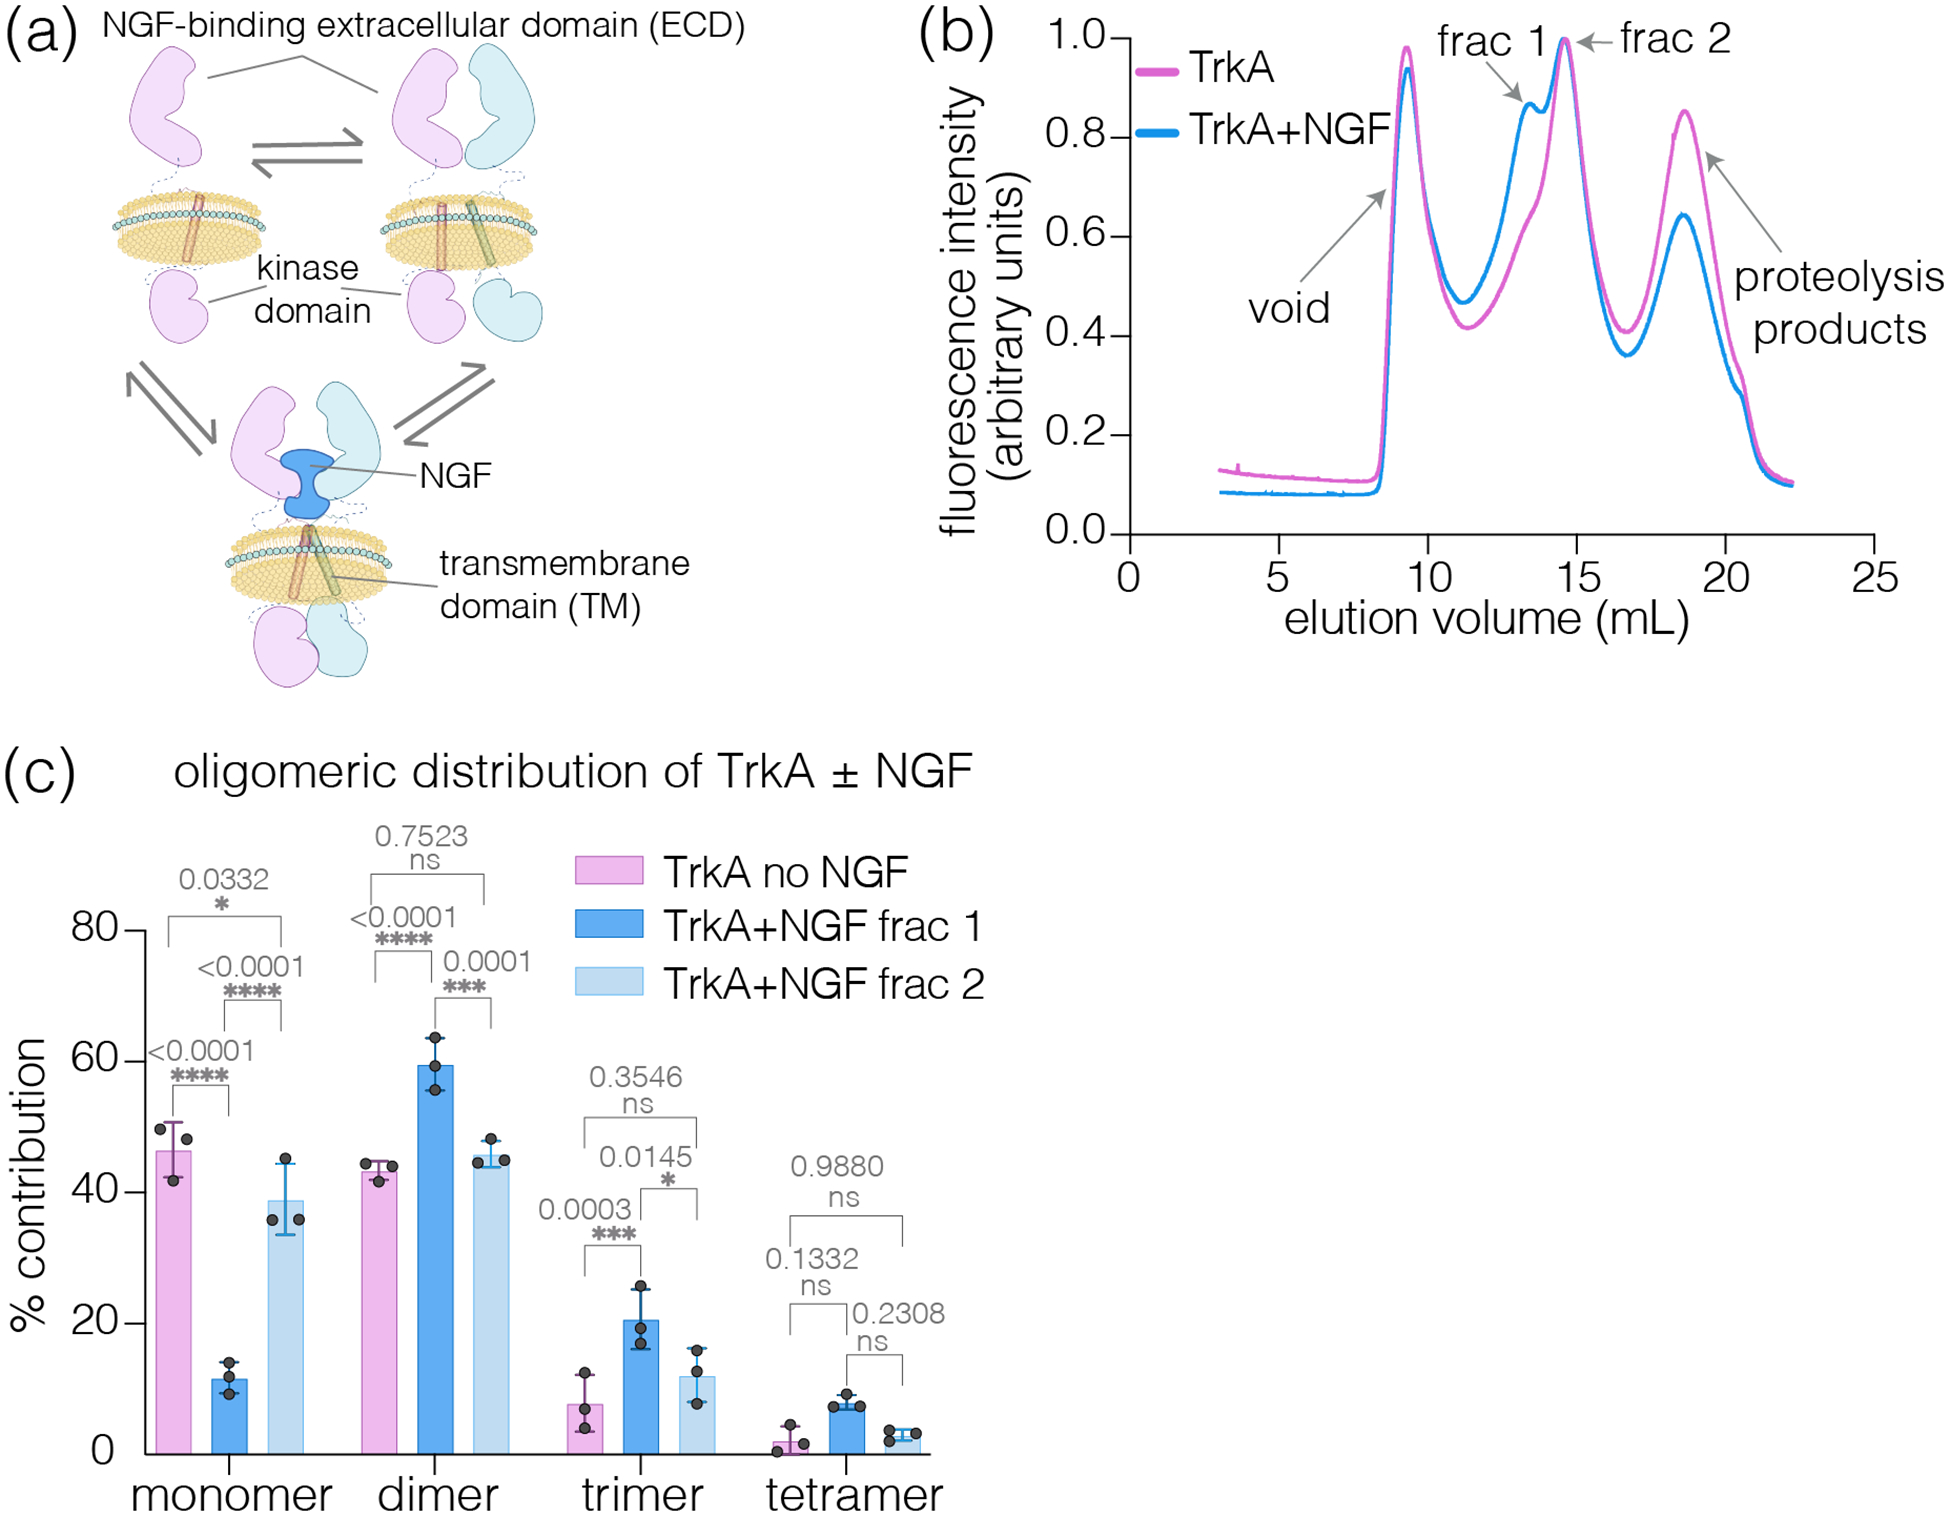
Oligomeric distribution of TrkA in the presence and absence of NGF within native nanodiscs (SMA) isolated from SH-SY5Y cells. (a) Schematic showing various oligomeric states of TrkA, including monomer, ligand-independent dimers, and NGF-mediated dimers (higher-order oligomers are not shown for clarity). Cartoons created using BioRender.com. (b) FSEC profile of native nanodisc encapsulated TrkA isolated from cells treated with NGF or untreated cells monitoring C-terminal GFP. Treatment with NGF leads to the formation of a left peak (fraction 1) in addition to a peak corresponding to that seen in the untreated sample (fraction 2), indicating the emergence of higher order oligomers. The FSEC traces are normalized to have the same area under the curve. (c) Native-nanoBleach analysis of fractions 1 and 2 from untreated and NGF-stimulated samples shows TrkA oligomeric distribution under these conditions. Data in (c) are from a total of about 3000–4000 spots from n = three biologically independent samples represented as mean ± sd. Results of two-way ANOVA analysis showing differences in oligomeric distributions between TrkA with and without NGF treatments, with P-values and corresponding summaries, are reported.
Native-nanoBleach analysis revealed TrkA to exist as 46% monomer, 44% dimer, and 10% higher-order oligomers in the absence of NGF in SMA or AASTY-derived nanodiscs (Fig. 3b–c, Fig. S5a–b). After treatment of TrkA-expressing SH-SY5Y cells with NGF, the FSEC profile showed growth of a peak at lower elution volumes (Fraction 1). This indicated an increased proportion of higher order oligomers in this sample compared to that observed in untreated TrkA (Fraction 2, Fig. 3b). Although we cannot separate these fractions entirely, we studied the representative oligomeric distributions at each peak position. Fraction 1 predominantly exhibited TrkA dimers (~60%) and higher-order oligomers (~30%), whereas fraction 2 showed a distribution similar to that observed in untreated TrkA (Fig. 3c). These results show evidence for ligand-independent dimerization and NGF-induced increase in the relative population of dimers/higher-order oligomers in TrkA45–47.
We next analyzed the contribution of individual domains in TrkA to ligand-independent and dependent formation of dimers/higher-order oligomers. We made two truncation mutants of TrkA – TrkAECD+TM, containing the extracellular and transmembrane domains, and TrkA™, containing only the transmembrane domain, both C-terminally tagged with GFP. Native-nanoBleach analysis of untreated TrkAECD+TM showed 55% monomers, 40% dimers, and 5% higher-order oligomers (Fig. S5c). NGF treatment led to two peaks (Fractions 1 and 2). Fraction 1 showed ~22% monomers, 47% dimers and 30% higher order oligomers, whereas fraction 2 exhibited comparable distribution to the corresponding fraction in untreated sample (Fig. S5c). We also mixed samples from fractions 1 and 2 together and performed Native-nanoBleach. This sample still showed an overall higher proportion of dimers and high-order oligomers as compared to untreated TrkAECD+TM (Fig. S5c). These results further highlight the ability of single-nanodisc analysis to identify subtle changes in oligomeric distribution, even when bulk FSEC analysis cannot separate the populations under the two peaks entirely (Fig. S5c, right panel). TrkA™ exhibited ~60% monomers, 35% dimers, and 2% higher-order oligomers, which, as expected, did not show redistribution upon NGF treatment (Fig. S5d). These results highlight the importance of the TM domain interactions in forming ligand-independent dimers/oligomers, in agreement with recent reports, and the role of the ECD domain in mediating NGF-dependent oligomerization47,48.
Oligomeric status of KRas and its oncogenic mutants on native membranes
Ras forms nanoclusters on the plasma membrane, acting as a regulatory hub for membrane-localized signaling49,50. Whether these nanoclusters are built using Ras dimers/oligomers or spatially-concentrated Ras subunits has remained the subject of intense investigation6,49,51,52. We purified native nanodisc-KRas from Expi293 membranes expressing 8X-His-GFP-tagged KRas and its oncogenic mutants, G12D and Q61H25 (Fig. S6a,c). Native nanodisc-KRas showed 54% monomer, 40% dimer, and ~5% higher-order oligomers (Fig. 4a, Fig. S7a). Introduction of known oncogenic mutations in KRas led to a significant increase in dimers (53% and 48%) and higher-order oligomers (17% and 14%) for G12D and Q61H, respectively, with a concomitant decrease in monomers (Fig. 4a). We also demonstrated that the oligomeric organization remained similar between native nanodisc KRas-G12D purified using SMA or AASTY despite the slightly larger size of the AASTY-nanodiscs (Fig. S8). This result provides additional evidence against possible coincidental localization of KRas subunits on the membrane, as that would lead to increased dimers/higher-order oligomers with increasing nanodisc size.
Figure 4:

Oligomeric distribution of KRas and its oncogenic mutants within native nanodiscs (SMA) isolated from Expi293 cells. (a) Native-nanoBleach analysis of KRas WT, G12D, and Q61H encapsulated in native nanodiscs. (b) FSEC traces for native nanodiscs (SMA) encapsulating KRas-G12D isolated from cells treated with BI-2852 (in DMSO) or DMSO alone. BI-2852 treatment induces appearance of a left-shifted peak on the FSEC trace (fraction 1) in addition to a peak corresponding to that seen in only DMSO-treated cells (fraction 2). The FSEC traces are normalized to have the same area under the curve. (c) Native-nanoBleach analyses of fractions 1 and 2 reveal BI-2852-induced enhancement in KRas dimerization. The left-shifted frac 1 exhibits a high proportion of dimers (>80%), acting as a positive control for our Native-nanoBleach analysis, while frac 2 shows an almost identical distribution to that observed in untreated KRas-G12D. Data shown in (a, c) are from a total of about 3000–4000 spots from n = four and three biologically independent samples, respectively, and represented as mean ± sd. For (a, c), results of two-way ANOVA analyses showing differences in oligomeric distributions, with P-values and corresponding summaries, are reported. (d) Quantification of western blots from co-immunoprecipitation studies to confirm presence of multiple KRas subunits within each native nanodisc. Expi293 cells transiently transfected with combinations of GFP-KRas and FLAG-KRas (+/− BI-2852) were purified using anti-FLAG M2 resin. Band densitometry (using Fiji, ImageJ) was used to quantify GFP-KRas eluted from the anti-FLAG resin, normalized with respect to the total amounts of GFP-KRas in the lysate (equal amounts of protein loaded onto resin as also estimated by Na/K-ATPase levels). The value obtained for the GFP-KRas only sample (negative control) is set to 1.0, accordingly adjusting the values for the other samples for ease of comparison. Data shown for n = three biologically independent samples and results of paired t test analysis (two-tailed) are reported, with corresponding P-values. Cartoons in (d) created using BioRender.com.
We repeated our analyses using BI-285253, a drug proposed to induce non-functional KRas dimerization in structural studies54 (Fig. 4b). We treated Expi293 cells expressing KRas-G12D with BI-2852 and purified native nanodisc-KRas-G12D from them. The FSEC profile for this sample shows an additional left-peak absent in DMSO-treated control samples (Fig. 4b). We studied the individual FSEC fractions using Native-nanoBleach. The shoulder peak corresponded to ~80% KRas dimers, whereas the main peak showed the same oligomeric distribution as observed in DMSO-treated samples (Fig. 4c, Fig. S7b). These data also demonstrate the sensitivity of our method to identify changes in oligomeric distributions of membrane proteins upon small molecule binding, which can be extended to study interactions with antibodies/nanobodies/monobodies or effectors/substrates.
We further corroborated the presence of KRas dimers using an orthologous co-immunopurification analysis in solution. (Fig. 4d, Fig. S9). We transfected Expi293 cells with a 1:1 mixture of FLAG-tagged and GFP-tagged KRas followed by purification of native nanodiscs using anti-FLAG resin. We detected significant GFP-KRas in the fractions eluted from the FLAG-resin (~5-fold higher than samples from cells expressing GFP-KRas alone). Additionally, we treated these cells with BI-2852, which dramatically increased the GFP signal (~10-fold) in the eluate and acts as a positive control (Fig. 4d, Fig. S9). This observed colocalization of GFP-KRas within native nanodiscs encapsulating FLAG-KRas established the presence of multiple KRas subunits within each nanodisc. Together, our data document detection of KRas dimers and higher-order oligomers in the context of their proximal native lipidome and proteome, in agreement with previous reports51,52,55.
KRas forms dimers in PDAC cells at physiological expression levels
Oncogenic KRas mutations drive >90% of pancreatic cancers24,56, making PDAC an ideal model for studying KRas oligomerization in native membranes. We previously used CRISPR/Cas9 to knock out endogenous KRas from 8988T cells (NP10/PDACKRasless cells)57. We lentivirally reintroduced either GFP-tagged KRas or oncogenic variant, KRas-G12V to these cells (Fig. 5a) followed by flow cytometry sorting to generate two stable cell lines. PDACGFP-KRas (low) expressed KRas variants at levels comparable or lower than endogenous KRas in a panel of PDAC cells while PDACGFP-KRas (high) expressed KRas variants at ~3–7 fold higher levels than PDACGFP-KRas(low) (Figs. 5a–b, Fig. S10a). These cell lines encompass the range of KRas expression found across a series of human PDAC lines, provide a disease-relevant membrane environment, and KRas-less background to express the GFP-KRas variants that prevents undercounting of oligomeric states due to endogenous dark KRas subunits.
Figure 5:

Oligomeric distribution of KRas and its oncogenic mutants within native nanodiscs (SMA) isolated from PDAC cells. (a) Schematic depicting the generation of PDACGFP-KRas cells lacking endogenous KRas expression (NP10/PDACKRasless cells). Cartoons created using BioRender.com. (b) Western blot analysis comparing levels of KRas in stable PDACGFP-KRas cells expressing high or low levels of GFP-tagged KRas variants (as sorted by flow cytometry) with endogenous KRas levels in a panel of patient-derived PDAC cell lines (left). KRas expression levels in each cell line were quantified using band densitometry and normalized with respect to the amounts of HSP90 loading control using Fiji (ImageJ, right). The # indicates the cells that were selected for Native-nanoBleach analysis. Data is shown from n = three independent experiments. Results of paired t test analysis (two-tailed), comparing KRas levels in G12V low versus high cells and WT low versus high cells with corresponding P-values, are reported. (c-d) Native-nanoBleach analysis of KRas WT and G12V in native nanodiscs isolated from PDACGFP-KRas (low) and PDACGFP-KRas (high) cells, respectively. Data shown in (c-d) are from a total of about 3000–4000 spots from n = three biologically independent samples represented as mean ± sd. For (c-d), results of two-way ANOVA analyses showing differences in oligomeric distributions between KRas WT and G12V, with P-values and corresponding summaries, are reported.
Native nanodisc-KRas purified from PDACGFP-KRas (low) cells showed ~50% monomer and 43% dimer (Fig. 5c, Figs. S6b, 7c). Native nanodisc-KRas-G12V from these cells exhibited an increased proportion of dimers (62%) with concomitant decrease in monomers (30%). No significant changes were observed in the oligomeric distributions for either KRas or KRas-G12V upon Native-nanoBleach analysis on the corresponding PDACGFP-KRas (high) cells, expressing ~3–7 fold more KRas (Fig. 5b–d, Figs. S7d). Similarly, despite the 5-fold higher KRas levels in Expi293 cells as compared to PDACGFP-KRas (low) (Fig. S10b–c), the oligomeric distributions of KRas variants in native nanodiscs from these cells were almost identical (Figs. 4a, 5c). Together, this demonstrates that Native-nanoBleach is applicable over a wide range of membrane protein surface densities without encountering coincidental overlap (Fig. 2e).
A recent study has estimated ~75,000 endogenous KRas4B molecules/cell in MIA PaCa-2 cells44. We estimate ~7500 KRas4B/cell in PDACGFP-KRas (low) cells, based on ~10-fold lower expression of KRas as compared to MIA PaCa-2 (Fig. 5b). Assuming an approximate cellular diameter of 20 μm and 100% localization of KRas to plasma membrane, the surface density of GFP-KRas in PDACGFP-KRas (low) cells is ~5 molecules/μm2. At this density, the probability of two KRas molecules coincidentally localizing within 10 nm of each other is essentially zero (Fig. 2e).
Conclusions
Native-nanoBleach is a compelling choice for studying the oligomeric organization of diverse classes of membrane proteins in the context of their native membrane environment (Table S1). With an effective spatial resolution of ~10 nm that is comparable to most state-of-the-art technologies3,4,14, Native-nanoBleach allows clear distinction of spatially-proximal protein subunits and coincidental overlaps from bona fide oligomeric interactions over a wide range of membrane protein surface densities. Our approach does not require cell fixation, as with many super-resolution techniques for subunit counting3,4, better preserving the native membrane locale around target proteins. This accounts for the role of native lipids or proximal proteins in supporting formation of macromolecular assemblies on membranes, which is not possible in in vitro reconstituted systems. Additionally, the single-nanodisc analysis allows highly sensitive detection at endogenous expression levels, illustrated by our study of KRas in PDAC cells. This coupled with low sample requirement (typically one 35 – 100 mm tissue culture plate) makes it possible to perform analysis on difficult-to-obtain cells and tissues under various conditions. Other advantages include high single-molecule throughput, the capacity to examine organellar-membrane localized proteins without encountering background problems in microscopy, the ability to obtain single-nanodisc density simply through dilution, and ultimately the ease of adoption for biologists with access to a commercial TIRF microscope without requiring specialized hardware.
Native-nanoBleach can also be implemented with in vitro reconstituted nanodiscs generated through detergent solubilization of membrane proteins, followed by reconstitution into lipid nanodiscs using membrane scaffold proteins (MSP)58. These reconstituted nanodiscs have found wide applications, including interrogation of oligomeric organization58,59. However, application of Native-nanoBleach to reconstituted lipid nanodiscs overrides a crucial benefit – the preservation of the proximal native membrane environment and subsequent native organization that cannot be achieved with use of detergents at any step of the extraction process.
Here, we report the development and application of Native-nanoBleach on diverse membrane proteins. The results of our analysis on TrkA are in agreement with previous studies that show a departure from the canonical mechanism of RTK activation, including ligand-independent dimerization of TrkA45–47. Since previous data on reconstituted supported lipid bilayers showed no intrinsic dimerization properties of KRas6, our result that KRas dimerizes in native nanodiscs highlight the critical contribution of the native membrane environment in aiding this dimerization. The precise molecular mechanisms underlying KRas dimerization, either by direct interactions or indirect interactions mediated by native lipids or neighboring proteins, warrant future investigations. Our data also suggest that native-nanoBleach can be applied to examine the impact of disease-relevant mutations, truncations, ligand/small molecule binding, and changes in membrane lipid composition on the oligomeric distribution of diverse membrane proteins. Our observation of enhanced dimerization in KRas oncoproteins in native nanodiscs implicate the importance of targeting this dimer interface with small molecules or antibodies/monobodies/nanobodies that can be screened for using Native-nanoBleach. Also, pathological mutations, truncations, and oncogenic fusions have been proposed to alter the oligomeric distribution for many RTKs23,60, which can be interrogated. Native-nanoBleach can also be used to decipher the molecular mechanisms of membrane protein oligomerization by observing alterations in stoichiometry upon systematic mutational analysis.
This general technology can be further advanced to broaden the scope of its applications. Our results show no significant differences between SMA or AASTY in Native-nanoBleach (Figs. S3f, 5b), except for the slightly higher population of KRas trimers in the smaller SMA-nanodiscs (Fig. S8a). This may be due to relatively better solubilization of higher-order oligomers by SMA compared to AASTY and will be subsequently investigated. We will synthesize new amphipathic copolymers in-house for membrane protein extraction in larger native nanodiscs (diameters up to100 nm). Using Native-nanoBleach with this extended collection of copolymers will allow insights into macromolecular assemblies over larger areas of the native membrane. Furthermore, specific functional groups on the copolymer itself (e.g., SMA-SH61) can be used to immobilize native nanodiscs on glass.
Native-nanoBleach can be further applied to unravel the heterooligomeric organization of proteins on native membranes by judiciously labeling interacting subunits with different fluorescent tags. The current version of Native-nanoBleach is best suited for detecting up to tetramers with high confidence, due to inherent limitations in clearly identifying beyond four photobleaching steps9. Subunit counting within native nanodiscs can be extended beyond tetramers using multi-color labeling coupled with appropriate downstream analysis in the future. This report showcases a single-molecule experimental platform to identify the oligomeric organization of membrane proteins in their native environment at 10 nm effective spatial resolution while highlighting the future developments that can build upon this method.
Methods
Preparation of plasmids
Bacterial and mammalian expression constructs
The details of all expression constructs used in this study along with their backbones and positions of the GFP and other tags are summarized in Table S2. All GFP coding sequences used in this study are that of monomeric enhanced GFP32 (referred to as GFP). The AcGFP in the GFP-OMPtrunc construct from Addgene was replaced with monomeric GFP. All constructs with large domain insertions and deletions were made using standard protocols for Gibson assembly (New England Biolabs, MA). All point mutants used were generated using the standard Quikchange protocols (Agilent Technologies, Santa Clara, CA). Expected construct sequences were confirmed using Sanger sequencing (Genewiz, Azenta).
The position of GFP tags in each construct was decided based on the information for target proteins when available – structural organization, domains/factors required for optimal protein trafficking to the membranes, and survey of past literature. For example, with KRas, we selected the N-terminus for GFP-tagging as the C-terminus gets farnesylated and leads to KRas membrane association. For TrkA, we put the GFP-tag on the C-terminus based on the presence of a signal sequence on the N-terminus and prior literature on RTKs8. When no such information is available, one can determine the position of the tag ab initio by testing placement of a GFP-tag at either termini and evaluating its effects on the overall folding and behavior of target proteins, which can be determined using FSEC as discussed previously34, monitoring their cellular localization, or doing corresponding functional assays.
Cloning of KRas CRISPR sgRNA and GFP-KRas lentiviral constructs
Lentiviral constructs, LentiCas9-Blast (Addgene 52962) and lentiGuide-Puro (Addgene 52963), for CRISPR/Cas-mediated genome editing were a gift from Dr. Feng Zhang, MIT. sgRNA oligos targeting human KRas exon 2 were designed and cloned into a BsmBI site, as previously described57. To generate lentiviral constructs for N-terminally GFP-tagged KRas variants, we amplified GFP-KRas WT or G12V based templates from the NCI Frederick RAS mutant collection V2.0 (Leidos). We made LV-PGK-GFP-KRAS(WT/G12V) by Gibson assembly (New England Biolabs, MA) into a 5.7 kb lentiviral backbone.
Protein expression and solubilization of membrane proteins in native nanodiscs from E.coli
Plasmids containing C-terminally GFP-tagged membrane proteins, SemiSWEET, AmtB, KcsA, LeuT (WT and interfacial mutant, LeuT-AA) were expressed in 2L of BL21-DE3 cells with appropriate antibiotics. For SemiSWEET, the cultures were induced at OD of 0.8 with 0.2 mM IPTG, and expressed overnight at 22°C (13–15 hours). For LeuT variants, cultures were induced at OD of 0.3–0.4 with 0.1 mM IPTG, and expressed overnight at 18°C (13–16 hours). For AmtB and KcsA, the cultures were induced at OD of 0.6 with 0.5 mM IPTG, and expressed overnight at 18°C (12 hours).
Cell pellets from these cultures were resuspended in lysis buffer (all buffer details summarized in Table S3) supplemented with protease inhibitor tablets (Pierce, Thermo), with PMSF added (0.017 mg/ml) only for KcsA. Cell suspensions were lysed using a microfluidizer (3 passes, 17500 psi), underwent a soft-spin followed by ultracentrifugation to collect membranes. These membranes were resuspended in 1–2% amphipathic copolymers (SMALP 200, Orbiscope or AASTY 6–55, Cube Biotech) in membrane resuspension buffer (Table S3) and incubated at 4°C for 2 hours for solubilization leading to formation of native nanodiscs-protein complexes. These samples were again subjected to ultracentrifugation to isolate soluble native nanodisc-complexes and pellet any insolubilized membranes.
Tissue culture
Culture of adherent cells
Established human PDAC cell lines were sourced from ATCC (MIA PaCa2 and BxPC3), RIKEN (KP-4), and DSMZ-Germany (8988T). All cell lines were confirmed negative for mycoplasma using PCR testing. Cells were maintained in DMEM (Corning Cellgro) supplemented with 10% fetal bovine serum (FBS) (ThermoScientific) and 1% penicillin/streptomycin. PDACKRasless WT low and PDACKRasless G12V low cells were cultured using DMEM (11965–092, Gibco, ThermoFisher) supplemented with 10% FBS (Sigma-Aldrich) and 1% Antibiotic-Antimycotic (AA, Thermo). SH-SY5Y cells were cultured similarly to PDACKRasless cells, except that Advanced DMEM/F12 reduced serum medium (ThermoFisher) supplemented with 10% FBS and 1mM L-Glutamine was used. All cells were maintained at 37°C under 5% CO2.
Culture of suspension cells
Expi293 cells (Thermo) were maintained in Corning polycarbonate Erlenmeyer flasks (Thermofisher) in Expi293 expression media (ThermoFisher). Cells were grown and maintained in a temperature and humidity-controlled shaker incubator at 37°C, 8% CO2, and 80% humidity. Sf9 cells (ATCC) were grown and maintained in Sf-900 III serum-free medium (SFM) (Gibco) at 27°C in a humidified shaker incubator.
Plasmid transfection/transduction
Transient transfection
Transient transfection was performed using standard polyethylenimine (PEI) transfection protocol. Briefly, for adherent cell lines, plasmid and PEI (3 μL PEI/μg DNA) were separately diluted in Opti-MEM Reduced Serum Media (Gibco), mixed together, and incubated at room temperature (RT) for 30 minutes. This mixture was added dropwise to tissue culture plates of ~80–90% adherent cells. For suspension cells, 1 μg plasmid/mL of culture and 3 uL PEI/μg of DNA were separately diluted into Opti-MEM. After incubating separately for 5 minutes at RT, the plasmid and PEI solutions were mixed and incubated at RT for 30 minutes. This mix was added to Expi293 cells that had been diluted to a density of 2–3 million cells/mL with fresh Expi293 media immediately before transfection.
Bacmid preparation and transduction
Bacmid was prepared in DH10Bac E. coli and isolated according to previously described protocol34. Briefly, 50 ng of plasmid was transformed into DH10Bac competent cells and plated on selection LB plates supplemented with kanamycin (50 ug/ml), Gentamycin (7 ug/ml), Tetracycline (10 ug/ml), IPTG (0.17 mM) and Bluo-gal (100ug/ml). Plates were incubated at 37 °C for ~2 d. White colonies were used to purify bacmid DNA. To transfect Sf9 cells with bacmid, 106 Sf9 cells were seeded in 6-well plates in SF-900 SFM medium. Cells were incubated at 27 °C for 20 min. For transfection, two tubes were prepared with 8 μl Cellfectin II (Thermo) in 100 μl SF-900 III SFM medium and 1 μg bacmid DNA in 100 μl SF-900 III SFM medium (Thermo). The contents of these tubes were mixed and incubated for 30 min at RT before adding dropwise to the Sf9 cells. Cells were incubated 27 °C incubator for 72 hours. The supernatant containing the P1 virus was collected and filtered using a 0.2 μm filter. The P1 virus was supplemented with 2% FBS and stored at 4°C. The P1 virus was used to generate P2 virus by inoculating 50 ml Sf9 cells, and later P2 virus was used to make P3 virus to increase the viral titer. The P3 viral titer was determined using Sf9-Easy-titer cells as described previously34.
Lentiviral production and transduction
To produce lentivirus, we transfected plasmids that contained lentiviral backbone, packaging vector (delta8.2 or psPAX2), and envelope vector (VSV-G) into HEK293T cells using TransIT-LT1 (Mirus Bio). Supernatant post-48/72h transfection was collected for transduction in target cells supplemented with 8 μg/mL polybrene (EMD Millipore). Single cell clones of Cas9 and sgKRAS-transduced cells were sorted into 96-well plates using a FACSMelody benchtop sorter (BD Biosciences) and verified for successful knock-out of KRas (NP10/PDACKRasless cells) by western blot analysis and PCR amplicon sequencing. To acquire cell populations with low or high levels of GFP-KRas (and variants) expression, we produced GFP-KRas variant lentivirus and transduced into generated NP10/PDACKRasless clones using the method described above. Cells were sorted based on the fluorescence intensity of GFP by FACSMelody (BD Biosciences). Fusion protein expression was further validated by western blotting. Importantly, reconstitution of GFP-KRas restores morphology, proliferative kinetics, and anchorage-independent growth comparable to that of parental cells57.
Cellular treatments with small molecules and growth factor
For KRas oligomerization studies (Fig. 4b–c), cells were treated with either 10 μM BI-2852 or DMSO for 2 hours immediately before harvesting. 10 μM BI-2852 was maintained throughout the copolymer solubilization and purification. In TrkA oligomerization studies, SH-SY5Y cells were serum starved for 16 hours and then harvested, with or without NGF treatment (NGF was a gift from Genentech, 100 ng/ml for 15 min). For these studies, a TrkA-specific kinase inhibitor (5 μM, GW441756, IC50 = 2 nM)62 was maintained throughout expression.
Protein expression and solubilization of membrane proteins in native nanodiscs from mammalian cells
Solubilization of membrane proteins from Expi293 expression cultures
KRas was expressed in Expi293 for 16 hours before harvesting the cells. Cells were resuspended in lysis buffer (Table S3) supplemented with protease inhibitor cocktail tablets (Pierce, Thermo) and lysed using nitrogen cavitation (600 psi, 20 minutes). The remaining steps of solubilization are similar to E. coli cells, as above. Briefly, the isolated membranes were solubilized using a 1–2% amphipathic copolymer (SMA or AASTY) in membrane resuspension buffer (Table S3) at 4°C. Solubilized membranes were then subjected to further ultracentrifugation to pellet any undissolved membranes, isolating soluble native nanodiscs in the supernatant.
In all our studies, either the commercially available SMALP 200 and/or AASTY 6–55 (from Orbiscope and Cube Biotech, respectively) worked well. However, this may not be the case for all target membrane proteins. In those cases, we recommend the users to first screen for polymers that work best with their target proteins (screening polymers similar to Cube Biotech Catalog#18295), as is common with detergent-based solubilization34. Polymer/s that yields well-behaved, homogenous preparations, as can be assessed by performing FSEC analysis34, can be used for downstream analysis.
Solubilization of membrane proteins from adherent cell cultures
GFP-OMP25trunc was expressed in HEK293 cells for 12–15 hours and harvested. PDACKRasless cells stably expressing KRas WT or G12V were seeded into 15-cm plates to confluency in 24 hours and harvested. For TrkA expression, SH-SY5Y cells transduced with P3 baculovirus were harvested from 10 cm plates (one plate per experimental condition) after ~24 hours of expression. Harvested cells were lysed by resuspending in lysis buffer (Table S3) and using a Dounce homogenizer (20–30 strokes). The remaining steps to generate native nanodiscs were identical to that outlined above.
Native nanodisc purification
Affinity chromatography:
Native nanodiscs containing KRas (isolated from Expi293 cells) were purified using affinity chromatography (Ni-NTA resin, Cube Biotech) at 4°C. Samples were adjusted with imidazole for Ni-binding, washed extensively with wash buffer, and eluted with elution buffer using gravity flow columns. Buffer compositions were the same as membrane resuspension buffer, except they were supplemented with 5 mM imidazole (binding buffer), 15 mM imidazole (wash buffer), and 350 mM imidazole (elution buffer). Purified nanodisc samples were subjected to FSEC analysis.
Fluorescence-detection Size-Exclusion Chromatography:
Each native nanodisc sample was subjected to fluorescence-detection size-exclusion chromatography (FSEC) on a Superose 6 10/300 GL column (Cytiva) either immediately after solubilization (SemiSWEET, AmtB, KcsA, LeuT variants, TrkA variants, and KRas variants from PDACGFP-KRas cells) or following affinity purification (for KRas variants from Expi293 cells) using an AKTA-Pure FLPC (GE). A Shimadzu RF-20AXS fluorescence detector was installed on-line to the FPLC, allowing detection of GFP (488 nm) signal. The recipes of the FSEC buffer for each protein are in Table S3. The FSEC trace allows isolation of the native nanodisc-membrane protein complexes from any soluble aggregates (void volume of the column) and any proteolysis/degradation products that elute at higher elution volumes. Nonvoid fractions containing the full-length target protein can be further identified by SDS gel (samples prepared under non-denaturing conditions) by monitoring in-gel GFP-fluorescence to confirm the molecular weight. These GFP-positive, non-void fractions containing the full-length target protein in native nanodiscs were collected and subjected to Native-nanoBleach analysis. The high sensitivity of FSEC-based fluorescent detection allows assessment of the quality and homogeneity of native nanodisc-membrane protein complexes even from low volumes of cell cultures (Figs. S6a, c).
Single-molecule imaging
Device assembly and glass substrate functionalization
All single-molecule experiments were performed in flow chambers (sticky-Slide VI 0.4, Ibidi, Germany) that were affixed to functionalized glass substrates. Glass substrates were generated by first cleaning glass slides (Ibidi glass coverslips, thickness 170 μm+/−5 μm) by bath sonication in 2% Hellmanex III solution (Hellma Analytics) for 30 min at 37°C. This was followed by extensive washing with ddH2O, and bath sonication for 30 min in a 1:1 mixture (vol/vol) of isopropanol:water. The glass slides were washed again with ddH2O, air dried and plasma-cleaned for 5 min (Harrick Plasma PDC-32 G, Ithaca, NY). Immediately after plasma cleaning, flow chambers were affixed to glass substrates to assemble the device.
After assembly, the glass substrates were treated with a mixture of Poly-L-lysine PEG and PEG-Biotin (PEG-biotin diluted 1:200 in PLL-PEG, stock 1 mg/mL) for 30 min (SuSoS, Switzerland). The glass substrates were then washed with 3 mL of Dulbecco’s phosphate-buffered saline (DPBS, Gibco, ThermoFisher). Streptavidin (1 mg/mL, NEB N7021S) was diluted 1:10 in DPBS and applied to passivated flow chambers for 30 min. Excess streptavidin was washed with 3 mL DPBS. Next biotinylated GFP-nanobody (1:100 dilution in dilution buffer - 25 mM Tris pH 8.0, 150 mM KCl, 1 mM TCEP; stock 1 mg/mL, ChromoTek) were applied to the flow chambers, which had been equilibrated with 3 mL dilution buffer, and incubated for 30 min. Excess nanobody was washed with 3 mL dilution buffer and then 3 mL DPBS. All incubations were done at RT.
Sample capture at single-nanodisc density
Prior to immobilization, native nanodisc samples were diluted in the corresponding FSEC buffer such that the capture on glass substrates results in optimal single-nanodisc density. 200 μL of diluted native nanodisc samples were applied to the functionalized substrate, incubated for 5 minutes at RT, and then washed with 3 mL DPBS.
Image acquisition
Single-particle TIRF images were acquired on a Nikon Eclipse Ti-inverted microscope equipped with Nikon 100X 1.49 numerical aperture oil-immersion TIRF objective, a TIRF illuminator, a Perfect Focus system, and a motorized stage. Images were recorded using an Andor iXon electron-multiplying charge-coupled device camera. The sample was illuminated using the LU-N4 unit (Nikon, Japan) with solid state lasers for the 488 nm, 561 nm and 640 nm channels. Lasers were controlled using a built-in acousto-optic tunable filter (AOTF). The 405/488/561/638 nm Quad TIRF filter set (Chroma Technology Corp., Vermont) was used along with supplementary emission filters of 525/50 m, 600/50 m, 700/75 m for 488 nm, 561 nm, 640 nm channel, respectively.
Samples were imaged using 3-color acquisition to assess the density of molecules within the imaging area, and to confirm the lack of background signal in 561 nm and 640 nm channels for samples containing only GFP-tagged protein. This was performed by computer-controlled change of illumination and filter sets (488 nm, 561 nm, and 640 nm) at 20 different positions from an initial reference frame, so as to capture multiple non-overlapping images. Native nanodiscs were imaged by setting the 488 nm laser to 20 mW, 561 nm laser to 56 mW, and 640 nm laser to 20 mW, respectively using an exposure time of 80 milliseconds for all channels. For photobleaching experiments, the field of view was illuminated in the TIRF mode by laser at 488 nm (GFP fluorescence) and signal was recorded in a stream acquisition mode to collect movies over 1500 frames at ~9.3 frames/sec, with an exposure time of 80 milliseconds and with the 488 nm laser power set to 1.8 mW and 2.7 mW for each sample. All mW values refer to power at laser source. All image acquisition was carried out using the Nikon NIS-Elements software.
Image analysis for GFP-photobleaching step counting
Individual single particles were detected and localized using the single particle tracking plugin TrackMate in ImageJ63–65. The particles were localized with the Difference of Gaussian (DoG) detector with initial diameter set to six pixels, and the detection threshold value set to optimize detection of particles using the Preview function within TrackMate (Fiji, ImageJ). Particles outside the center area of 350 × 350 pixel2 were excluded due to heterogeneous TIRF illumination. No further filtering processes were applied in TrackMate.
Frames from the GFP step-photobleaching movies were analyzed to plot the time-dependent decrease in GFP fluorescence intensities for each tracked particle in the field of view using a custom MATLAB code66. These plots were analyzed manually by scoring them to have 1–4 photobleaching steps or discarded if no clear photobleaching steps were identified. Photobleaching counts corresponding to 1000–1500 individual particles were recorded for each biological replicate, and reported as mean ± sd over three to four biological replicates for each sample. The step counting was also verified through average GFP intensity for each particle. Furthermore, the step sizes (i.e., decrease in fluorescence intensity in going from one step to the next) between different photobleaching steps and the fluorescence background after photobleaching are comparable across different samples (Figs. S1d–e). This step distribution data over 1–4 steps for each sample were converted into a corresponding distribution of monomers, dimers, trimers, and tetramers, considering the GFP maturation efficiency to be 70%, as described below.
Confocal imaging
PDACGFP-KRas (low) WT/G12V cells were plated at 20,000 cells/mL into 35 mm Mattek dishes (P35GC-1.5–14-C) and incubated overnight. After 24 hours, the cells were exchanged into DPBS and imaged with a Dragonfly 505 spinning disc confocal (Andor) mounted into a Ti2-E inverted microscope (Nikon) with a plan apochromat lambda 60X oil, NA 1.42 objective and a SONA 4.2MP camera (SONA-4BV6X; 102nm/pixel; Andor) under the control of Fusion (2.4.0.6, Andor). Images were acquired using 50% 488 nm laser power with 155 milliseconds exposure and with 2×2 binning.
Co-immunoprecipitation
Expi293 cells expressing combinations of GFP-KRas and/or FLAG-KRas, treated with either DMSO or 10 μM BI-2852, were harvested. Cells were lysed and solubilized with copolymers. Native nanodisc samples were subjected to immunoprecipitation using anti-FLAG M2 resin (Sigma) according to manufacturer’s instructions. Briefly, native nanodisc samples were incubated with equilibrated anti-FLAG resin for 2 hours at 4°C. Beads were pelleted by centrifugation and the flow through (supernatant) was collected. The beads were washed 3 × 1 mL with membrane resuspension buffer for KRas before elution with membrane resuspension buffer supplemented with 0.2 mg/mL 3X-FLAG peptide (SAE0194, Sigma). Aliquots of samples were collected at each stage (input to anti-FLAG resin, flow through, and eluate) and analyzed using western blots.
Western blot and in-gel fluorescence
A detailed description of sample preparation for western blots and in-gel fluorescence, western blotting, image acquisition and analysis is provided in the Supplementary Methods along with the details of all primary and secondary antibodies used.
Negative-stain electron microscopy
Negative staining and image acquisition of native nanodiscs (Tecnai-T12 microscope, FEI) were performed according to established protocols (detailed in Supplementary Methods)67.
Statistical analysis
Two-way ANOVA for relevant datasets and paired t test analysis for western blot data were performed using GraphPad Prism 9. These analyses were done to compute a 95% confidence interval for the differences in mean while comparing the different conditions. The P-values and corresponding summaries are indicated in the relevant figures where such analyses are reported.
Supplementary Material
Acknowledgements
We thank members of the Bhattacharyya, Gupta, and Muzumdar labs for helpful discussions. We especially thank Anthony Quinnert (Bhattacharyya lab) for maintenance of our microscopy setup and Felix Rivera-Molina for help with confocal microscopy. We thank Marc Llaguno for help with negative stain EM data collection. We thank Tathagata Das for help with Matlab codes. The pQE60-KcsA construct was a gift from Dr. Crina Nimigean’s lab. The pET16b-LeuT construct was a gift from Dr. Eric Gouaux’s lab. Expi293 cells were a gift from Dr. Karin Reinisch’s lab. SF9 cells were a gift from Dr. Joel Butterwick’s lab. NGF was a gift from Genentech. GW acknowledges support from the PPTP training grant (T32-GM007324), CB acknowledges support from the NSF GRFP fellowship (DGE-2139841) and the P.E.O. Scholar Award. XG was a CSC-Yale Scholar. MDM acknowledges support from an NCI Mentored Clinical Scientist Research Career Development Award (K08-CA208016), a NIH New Innovator Award (DP2-CA248136), a Lustgarten Foundation Therapeutics Focused Research Program award, an American Cancer Society Institutional Research Grant (#IRG 17-172-57), and in part, the Yale Comprehensive Cancer Center Support Grant (P30CA016359). KG acknowledges support from NIGMS (R01GM141192 and RM1GM149406). MB acknowledges support from NIGMS (R00GM126145 and R35GM147095) for funding.
Footnotes
Code availability
The calculations for single-molecule photobleaching step analysis, conversion of step distribution to oligomeric distribution, and the theoretical probability of coincidental overlap as a function of surface expression density, as described above and in Supplementary Methods, have been formulated as Matlab codes that are available via Zenodo at the following link (https://doi.org/10.5281/zenodo.8429321)68.
Competing Interests Statement
The authors declare no competing interests.
Data availability
The data supporting the findings of this study are available within the paper and its Supplementary Information. The source data files are also provided. Other relevant data are available from the corresponding author on request.
References
- 1.Levental I & Lyman E Regulation of membrane protein structure and function by their lipid nano-environment. Nat. Rev. Mol. Cell Biol 24, 107–122 (2023). [DOI] [PMC free article] [PubMed] [Google Scholar]
- 2.Sezgin E, Levental I, Mayor S & Eggeling C The mystery of membrane organization: composition, regulation and roles of lipid rafts. Nat. Rev. Mol. Cell Biol 18, 361–374 (2017). [DOI] [PMC free article] [PubMed] [Google Scholar]
- 3.Liu S, Hoess P & Ries J Super-Resolution Microscopy for Structural Cell Biology. Annu. Rev. Biophys 51, 301–326 (2022). [DOI] [PubMed] [Google Scholar]
- 4.Baddeley D & Bewersdorf J Biological Insight from Super-Resolution Microscopy: What We Can Learn from Localization-Based Images. Annu. Rev. Biochem 87, 965–989 (2018). [DOI] [PubMed] [Google Scholar]
- 5.Jain A et al. Probing cellular protein complexes using single-molecule pull-down. Nature 473, 484–488 (2011). [DOI] [PMC free article] [PubMed] [Google Scholar]
- 6.Chung JK et al. K-Ras4B Remains Monomeric on Membranes over a Wide Range of Surface Densities and Lipid Compositions. Biophys. J 114, 137–145 (2018). [DOI] [PMC free article] [PubMed] [Google Scholar]
- 7.Kaliszewski MJ et al. Quantifying membrane protein oligomerization with fluorescence cross-correlation spectroscopy. Methods 140–141, 40–51 (2018). [DOI] [PMC free article] [PubMed] [Google Scholar]
- 8.Huang Y et al. Molecular basis for multimerization in the activation of the epidermal growth factor receptor. Elife 5, (2016). [DOI] [PMC free article] [PubMed] [Google Scholar]
- 9.Ulbrich MH & Isacoff EY Subunit counting in membrane-bound proteins. Nat. Methods 4, 319–321 (2007). [DOI] [PMC free article] [PubMed] [Google Scholar]
- 10.Low-Nam ST et al. ErbB1 dimerization is promoted by domain co-confinement and stabilized by ligand binding. Nat. Struct. Mol. Biol 18, 1244–1249 (2011). [DOI] [PMC free article] [PubMed] [Google Scholar]
- 11.Kusumi A, Tsunoyama TA, Hirosawa KM, Kasai RS & Fujiwara TK Tracking single molecules at work in living cells. Nat. Chem. Biol 10, 524–532 (2014). [DOI] [PubMed] [Google Scholar]
- 12.Lelek M et al. Single-molecule localization microscopy. Nat. Rev. Methods Primers 1, (2021). [DOI] [PMC free article] [PubMed] [Google Scholar]
- 13.Huang B, Bates M & Zhuang X Super-resolution fluorescence microscopy. Annu. Rev. Biochem 78, 993–1016 (2009). [DOI] [PMC free article] [PubMed] [Google Scholar]
- 14.Balzarotti F et al. Nanometer resolution imaging and tracking of fluorescent molecules with minimal photon fluxes. Science 355, 606–612 (2017). [DOI] [PubMed] [Google Scholar]
- 15.Deguchi T et al. Direct observation of motor protein stepping in living cells using MINFLUX. Science 379, 1010–1015 (2023). [DOI] [PMC free article] [PubMed] [Google Scholar]
- 16.Panda A et al. Direct determination of oligomeric organization of integral membrane proteins and lipids from intact customizable bilayer. Nat. Methods 20, 891–897 (2023). [DOI] [PMC free article] [PubMed] [Google Scholar]
- 17.Sydor AM, Czymmek KJ, Puchner EM & Mennella V Super-resolution microscopy: from single molecules to supramolecular assemblies. Trends Cell Biol. 25, 730–748 (2015). [DOI] [PubMed] [Google Scholar]
- 18.Duncan AL et al. Protein crowding and lipid complexity influence the nanoscale dynamic organization of ion channels in cell membranes. Sci. Rep 7, 16647 (2017). [DOI] [PMC free article] [PubMed] [Google Scholar]
- 19.Kiessling V, Yang S-T & Tamm LK Supported lipid bilayers as models for studying membrane domains. Curr Top Membr 75, 1–23 (2015). [DOI] [PubMed] [Google Scholar]
- 20.Sako Y, Minoghchi S & Yanagida T Single-molecule imaging of EGFR signalling on the surface of living cells. Nat. Cell Biol 2, 168–172 (2000). [DOI] [PubMed] [Google Scholar]
- 21.Coffman VC & Wu J-Q Counting protein molecules using quantitative fluorescence microscopy. Trends Biochem. Sci 37, 499–506 (2012). [DOI] [PMC free article] [PubMed] [Google Scholar]
- 22.Huang EJ & Reichardt LF Trk receptors: roles in neuronal signal transduction. Annu. Rev. Biochem 72, 609–642 (2003). [DOI] [PubMed] [Google Scholar]
- 23.Lemmon MA & Schlessinger J Cell signaling by receptor tyrosine kinases. Cell 141, 1117–1134 (2010). [DOI] [PMC free article] [PubMed] [Google Scholar]
- 24.Waters AM & Der CJ KRAS: the critical driver and therapeutic target for pancreatic cancer. Cold Spring Harb. Perspect. Med 8, (2018). [DOI] [PMC free article] [PubMed] [Google Scholar]
- 25.Hobbs GA, Der CJ & Rossman KL RAS isoforms and mutations in cancer at a glance. J. Cell Sci 129, 1287–1292 (2016). [DOI] [PMC free article] [PubMed] [Google Scholar]
- 26.Simanshu DK, Nissley DV & McCormick F RAS proteins and their regulators in human disease. Cell 170, 17–33 (2017). [DOI] [PMC free article] [PubMed] [Google Scholar]
- 27.Wang JY & Doudna JA CRISPR technology: A decade of genome editing is only the beginning. Science 379, eadd8643 (2023). [DOI] [PubMed] [Google Scholar]
- 28.Cho NH et al. OpenCell: Endogenous tagging for the cartography of human cellular organization. Science 375, eabi6983 (2022). [DOI] [PMC free article] [PubMed] [Google Scholar]
- 29.Smith AAA et al. Lipid nanodiscs via ordered copolymers. Chem (2020). doi: 10.1016/j.chempr.2020.08.004 [DOI] [Google Scholar]
- 30.Esmaili M & Overduin M Membrane biology visualized in nanometer-sized discs formed by styrene maleic acid polymers. Biochim. Biophys. Acta Biomembr 1860, 257–263 (2018). [DOI] [PMC free article] [PubMed] [Google Scholar]
- 31.Knowles TJ et al. Membrane proteins solubilized intact in lipid containing nanoparticles bounded by styrene maleic acid copolymer. J. Am. Chem. Soc 131, 7484–7485 (2009). [DOI] [PubMed] [Google Scholar]
- 32.Zacharias DA, Violin JD, Newton AC & Tsien RY Partitioning of lipid-modified monomeric GFPs into membrane microdomains of live cells. Science 296, 913–916 (2002). [DOI] [PubMed] [Google Scholar]
- 33.Swiecicki J-M, Santana JT & Imperiali B A Strategic Approach for Fluorescence Imaging of Membrane Proteins in a Native-like Environment. Cell Chem. Biol 27, 245–251.e3 (2020). [DOI] [PMC free article] [PubMed] [Google Scholar]
- 34.Goehring A et al. Screening and large-scale expression of membrane proteins in mammalian cells for structural studies. Nat. Protoc 9, 2574–2585 (2014). [DOI] [PMC free article] [PubMed] [Google Scholar]
- 35.Sniegowski JA, Phail ME & Wachter RM Maturation efficiency, trypsin sensitivity, and optical properties of Arg96, Glu222, and Gly67 variants of green fluorescent protein. Biochem. Biophys. Res. Commun 332, 657–663 (2005). [DOI] [PubMed] [Google Scholar]
- 36.Xu Y et al. Structures of bacterial homologues of SWEET transporters in two distinct conformations. Nature 515, 448–452 (2014). [DOI] [PMC free article] [PubMed] [Google Scholar]
- 37.Khademi S et al. Mechanism of ammonia transport by Amt/MEP/Rh: structure of AmtB at 1.35 A. Science 305, 1587–1594 (2004). [DOI] [PubMed] [Google Scholar]
- 38.Kim DM & Nimigean CM Voltage-Gated Potassium Channels: A Structural Examination of Selectivity and Gating. Cold Spring Harb. Perspect. Biol 8, (2016). [DOI] [PMC free article] [PubMed] [Google Scholar]
- 39.Gupta K et al. The role of interfacial lipids in stabilizing membrane protein oligomers. Nature 541, 421–424 (2017). [DOI] [PMC free article] [PubMed] [Google Scholar]
- 40.Nemoto Y & De Camilli P Recruitment of an alternatively spliced form of synaptojanin 2 to mitochondria by the interaction with the PDZ domain of a mitochondrial outer membrane protein. EMBO J. 18, 2991–3006 (1999). [DOI] [PMC free article] [PubMed] [Google Scholar]
- 41.Chen WW, Freinkman E, Wang T, Birsoy K & Sabatini DM Absolute quantification of matrix metabolites reveals the dynamics of mitochondrial metabolism. Cell 166, 1324–1337.e11 (2016). [DOI] [PMC free article] [PubMed] [Google Scholar]
- 42.Yamashita A, Singh SK, Kawate T, Jin Y & Gouaux E Crystal structure of a bacterial homologue of Na+/Cl−-dependent neurotransmitter transporters. Nature 437, 215–223 (2005). [DOI] [PubMed] [Google Scholar]
- 43.Zhang F et al. Quantification of epidermal growth factor receptor expression level and binding kinetics on cell surfaces by surface plasmon resonance imaging. Anal. Chem 87, 9960–9965 (2015). [DOI] [PMC free article] [PubMed] [Google Scholar]
- 44.Hood FE, Sahraoui YM, Jenkins RE & Prior IA Ras protein abundance correlates with Ras isoform mutation patterns in cancer. Oncogene 42, 1224–1232 (2023). [DOI] [PMC free article] [PubMed] [Google Scholar]
- 45.Byrne PO, Hristova K & Leahy DJ EGFR forms ligand-independent oligomers that are distinct from the active state. J. Biol. Chem 295, 13353–13362 (2020). [DOI] [PMC free article] [PubMed] [Google Scholar]
- 46.Shen J & Maruyama IN Nerve growth factor receptor TrkA exists as a preformed, yet inactive, dimer in living cells. FEBS Lett. 585, 295–299 (2011). [DOI] [PubMed] [Google Scholar]
- 47.Ahmed F & Hristova K Dimerization of the Trk receptors in the plasma membrane: effects of their cognate ligands. Biochem. J 475, 3669–3685 (2018). [DOI] [PMC free article] [PubMed] [Google Scholar]
- 48.Franco ML et al. Interaction between the transmembrane domains of neurotrophin receptors p75 and TrkA mediates their reciprocal activation. J. Biol. Chem 297, 100926 (2021). [DOI] [PMC free article] [PubMed] [Google Scholar]
- 49.Van QN et al. RAS nanoclusters: dynamic signaling platforms amenable to therapeutic intervention. Biomolecules 11, (2021). [DOI] [PMC free article] [PubMed] [Google Scholar]
- 50.Abankwa D, Gorfe AA & Hancock JF Ras nanoclusters: molecular structure and assembly. Semin. Cell Dev. Biol 18, 599–607 (2007). [DOI] [PMC free article] [PubMed] [Google Scholar]
- 51.Nan X et al. Ras-GTP dimers activate the Mitogen-Activated Protein Kinase (MAPK) pathway. Proc. Natl. Acad. Sci. USA 112, 7996–8001 (2015). [DOI] [PMC free article] [PubMed] [Google Scholar]
- 52.Ambrogio C et al. KRAS dimerization impacts MEK inhibitor sensitivity and oncogenic activity of mutant KRAS. Cell 172, 857–868.e15 (2018). [DOI] [PubMed] [Google Scholar]
- 53.Kessler D et al. Drugging an undruggable pocket on KRAS. Proc. Natl. Acad. Sci. USA 116, 15823–15829 (2019). [DOI] [PMC free article] [PubMed] [Google Scholar]
- 54.Tran TH et al. The small molecule BI-2852 induces a nonfunctional dimer of KRAS. Proc. Natl. Acad. Sci. USA 117, 3363–3364 (2020). [DOI] [PMC free article] [PubMed] [Google Scholar]
- 55.Sarkar-Banerjee S et al. Spatiotemporal Analysis of K-Ras Plasma Membrane Interactions Reveals Multiple High Order Homo-oligomeric Complexes. J. Am. Chem. Soc 139, 13466–13475 (2017). [DOI] [PMC free article] [PubMed] [Google Scholar]
- 56.Buscail L, Bournet B & Cordelier P Role of oncogenic KRAS in the diagnosis, prognosis and treatment of pancreatic cancer. Nat. Rev. Gastroenterol. Hepatol 17, 153–168 (2020). [DOI] [PubMed] [Google Scholar]
- 57.Muzumdar MD et al. Survival of pancreatic cancer cells lacking KRAS function. Nat. Commun 8, 1090 (2017). [DOI] [PMC free article] [PubMed] [Google Scholar]
- 58.Sligar SG & Denisov IG Nanodiscs: A toolkit for membrane protein science. Protein Sci. 30, 297–315 (2021). [DOI] [PMC free article] [PubMed] [Google Scholar]
- 59.Boldog T, Grimme S, Li M, Sligar SG & Hazelbauer GL Nanodiscs separate chemoreceptor oligomeric states and reveal their signaling properties. Proc. Natl. Acad. Sci. USA 103, 11509–11514 (2006). [DOI] [PMC free article] [PubMed] [Google Scholar]
- 60.Du Z & Lovly CM Mechanisms of receptor tyrosine kinase activation in cancer. Mol. Cancer 17, 58 (2018). [DOI] [PMC free article] [PubMed] [Google Scholar]
- 61.Lindhoud S, Carvalho V, Pronk JW & Aubin-Tam M-E SMA-SH: Modified Styrene-Maleic Acid Copolymer for Functionalization of Lipid Nanodiscs. Biomacromolecules 17, 1516–1522 (2016). [DOI] [PubMed] [Google Scholar]
- 62.Wood ER et al. Discovery and in vitro evaluation of potent TrkA kinase inhibitors: oxindole and aza-oxindoles. Bioorg. Med. Chem. Lett 14, 953–957 (2004). [DOI] [PubMed] [Google Scholar]
- 63.Tinevez J-Y et al. TrackMate: An open and extensible platform for single-particle tracking. Methods 115, 80–90 (2017). [DOI] [PubMed] [Google Scholar]
- 64.Jaqaman K et al. Robust single-particle tracking in live-cell time-lapse sequences. Nat. Methods 5, 695–702 (2008). [DOI] [PMC free article] [PubMed] [Google Scholar]
- 65.Schindelin J et al. Fiji: an open-source platform for biological-image analysis. Nat. Methods 9, 676–682 (2012). [DOI] [PMC free article] [PubMed] [Google Scholar]
- 66.Karandur D et al. Breakage of the oligomeric CaMKII hub by the regulatory segment of the kinase. Elife 9, (2020). [DOI] [PMC free article] [PubMed] [Google Scholar]
- 67.Mi L-Z et al. Simultaneous visualization of the extracellular and cytoplasmic domains of the epidermal growth factor receptor. Nat. Struct. Mol. Biol 18, 984–989 (2011). [DOI] [PMC free article] [PubMed] [Google Scholar]
- 68.Bhattacharyya Moitrayee, Walker Gerard, Brown Caroline, Ge Xiangyu, Kumar Shailesh, Muzumdar Mandar, & Gupta Kallol. (2023). MATLAB codes for Native-nanoBleach (1.0.1). Zenodo. 10.5281/zenodo.8429321. [DOI] [Google Scholar]
Associated Data
This section collects any data citations, data availability statements, or supplementary materials included in this article.
Supplementary Materials
Data Availability Statement
The data supporting the findings of this study are available within the paper and its Supplementary Information. The source data files are also provided. Other relevant data are available from the corresponding author on request.