

Abstract
Genuine concerns are being increased regarding potential health risks associated with the radiation exposure while using mobile devices. To study the effects of mobile phone usage on auditory functions. The detailed history of the patient was obtained with special emphasis on total cumulative usage [in years], average daily use [in minutes]. According to the years of exposure, subjects were divided into Group A (< 5 years of exposure) and Group B (> 5 years of exposure) and according to the average daily usage of mobile phones, subjects were divided into Group 1 (< 60 min daily usage) and Group 2 (> 60 min of daily usage). After that systemic examination was done. Audiological testing included pure tone audiometry (PTA) with extended high frequencies (0.250–12 kHz), Otoacoustic emissions (OAE) and Auditory Brainstem response (ABR) testing and middle latency response (MLR) were performed. Out of 100 subjects, maximum subjects (38%) in the present study were in the age group of 21–30 years with male: female ratio of 1.6:1. The main associated complaints in the subjects at the time of enrolment in the study included ear warmth (34%) followed by aural fullness (20%) and tinnitus (17%). In Group A, mild SNHL was seen in 3 (11.54%) subjects in whom 2 had > 60 min average daily use and 1 had < 60 min daily use. In Group B 19 (25.68%) subjects had mild SNHL out of which 6 were in Group 2 and 13 were in Group 1. In group B 2 (2.7%) subjects had moderate SNHL. Increase in latencies of Na and Pa were noted with prolonged and frequent exposure to mobile phones in MLR. It is advised to limit the usage of mobile phones so as to reduce the damage caused by EMRs to the auditory system.
Keywords: Otoacoustic emissions, Auditory Brainstem response, Middle latency response
Introduction
Mobile telephones have been available since 1983, and their usage has spread widely and rapidly. Mobile phones are the wireless communication system which use electromagnetic waves to transmit the signal from mobile phone to mobile towers and vice versa. General concerns are being increasingly raised regarding potential health risks associated with radiation exposure while using mobile devices [1]. As compared to the ionizing radiations, electromagnetic waves of mobile phones cannot break chemical bonds and damage DNA but these are capable of penetrating the skull and can deposit energy up to 4–6 cm deep into the brain. This can result in the increase in tissue temperature up to 0.1 °C [2] and can affect the human auditory system. The damage in terms of hearing impairment caused by prolonged and persistent noise exposure from chronic mobile use or by electromagnetic waves emitted by the mobile phone is still a matter of controversy [3]. There are various other medical hazards associated with chronic use of mobile phones like dizziness, lack of concentration, skin burns and hypertension [4]. There is a dearth of medical literature on the effects of chronic mobile phone usage on hearing acuity. Only a few studies have been performed to date [5]. In few long-term studies conducted by Panda et al. [6], Philip et al. [7] and Swaroop et al. [8] assessment of auditory functions in long term mobile users was done using tests like Pure tone audiometry (PTA) and Brain stem evoked response (BERA), similarly in few short term studies conducted by Lohitashwa et al. [9], Priya et al. [10], Srinivasa et al. [11] assessment of auditory functions was also done using tests like Pure tone audiometry (PTA) and Brain stem evoked response (BERA). The present study was designed to assess the effect of excessive mobile phone usage on auditory functions in a tertiary care teaching hospital in North India and the rationale was to establish a relationship between long term mobile phone usage and hearing impairment. In our study in addition to PTA and BERA, MLR was also done to assess the auditory functions in long term mobile users.
Methodology
This study was conducted in the Department of Otorhinolaryngology and Head & Neck Surgery, S.M.G.S Hospital, Government Medical College, Jammu which is a tertiary care centre in the Union territory of Jammu & Kashmir in North India w.e.f 1st November 2021 to 31st October 2022. The study was conducted after taking prior approval of Institutional Ethical committee (IEC). Study Group included 100 subjects. Individuals in the age range of 15–50 years who had been using mobile phones for at least a year were included in the study. Patients having history of any systemic and metabolic disorders causing hearing loss, history of ear disease or surgery performed on the ear, history of noise exposure, history of intake of ototoxic medication, history of head trauma and Congenital hearing disorders were excluded. Informed consent was obtained and detailed history of the patient was obtained with special emphasis on total cumulative usage [in number of years], average daily use [in minutes] and any ear symptoms like tinnitus, aural fullness, hearing impairment, sensation of warmth around ear. According to the years of exposure, subjects were divided into group A (< 5 years of exposure) and group B (> 5 years of exposure) and according to the average daily usage of mobile phones, subjects were divided into group 1 (< 60 min daily usage) and group 2 (> 60 min of daily usage). After that systemic examination and complete ear, nose and throat examination were done. Audiological assessment was done in the speech and hearing unit attached to the Department. Audiological testing included pure tone audiometry (PTA) with extended high frequencies (0.250-12 kHz), Otoacoustic emissions (OAE) and Auditory Brainstem response (ABR) testing and middle latency response (MLR). Audiological assessment was conducted in a sound treated room which conforms to American National Standard Institute (ANSI) 1997 and International Organization for Standardization (ISO) standards for Maximum permissible noise level. Pure tone hearing thresholds were tested using Elkon 3N3 multi diagnostic audiometer. Air conduction testing was measured by presenting a pure tone to the ear through an earphone and measuring the lowest intensity in decibels (dB) at which this tone was perceived 50% of the time. The testing procedure was repeated at specific frequencies from 250 to 12,000 Hz for each ear. Bone conduction thresholds were measured by placing an oscillator on the mastoids process and measuring threshold at various frequencies (250–8000). The audiogram was drawn by depicting hearing thresholds in decibels on the ordinate and frequency in hertz. Otoacoustic emission testing was carried out using Neurosoft Neuro-audio device. While measuring the Distortion product Otoacoustic emission (DPOAE), the frequency separation of the primaries was f2/f1 = 1.22, with L1 and L2 set to 65 and 55 db SPL, respectively. The parameters considered in distortion product OAE testing were as follows:
A signal-to-noise ratio of more than 3 dB in three consecutive test frequencies, and
The amplitude of the signal in the 90th percentile of the normal distribution for the frequencies to be tested. (i.e. 357, 499, 704, 1003, 1409, 2000, 2822, 3991 and 5649 Hz)
Auditory evoked potentials were measured using evoked potential system Neurosoft Neuro-audio device in the subjects were made in the supine position with eyes closed. Silver-Silver chloride button electrodes were used. The non-inverting electrode was placed at the vertex, the inverting electrode on either mastoid, and the ground electrode on the forehead, using conduction gel. The surface impedance was adjusted below 5 kΩ to facilitate optimal recording. The following parameters were selected for recording:
The filter bandwidths adjusted to 100–3000 Hz;
The stimulus were the clicks;
The stimulus rate was 19.3/seconds and its duration was 100 micro second/ click;
A minimum of 2000 clicks were presented at each recording, (responses to be repeated at each intensity level to ensure reproducibility);
Waveforms were recorded at a sound intensity of 70–90 dBnHL, in both ears separately.
The absolute latencies of waves 1, III, and V
The interpeak latencies of waves I–III, III–V and I–V.
MLR [Middle Latency Response]
MLR was done using Neurosoft Neuro-audio device, with the active electrodes typically placed on either the high forehead or vertex of the head and the ground electrodes on the lower forehead. When recording the reference electrodes were placed over the mastoid process behind the ear. The parameters studied included Na, Pb latencies. Data regarding pure tone audiometry, otoacoustic emission and auditory brain response, middle latency response was entered in Microsoft excel spread sheet and compared using statistical package for social science (SPSS) software, IBM manufacturer, Chicago, USA, version 21.0. Data was grouped in tables and represented as means with standard deviation and percentages for qualitative variables respectively. Statistical significance of the data was tested on appropriate statistical test. The p value of < 0.05 was considered as statistically significant.
Results
In the present study, maximum subjects (38%) were in the age group of 21–30 years followed by 31% in the age group 31–40 years, 18% in 41–50 years, 8% in 10–20 years and minimum subjects (5%) were in the age group of 51–60 years. (Fig. 1).
Fig. 1.
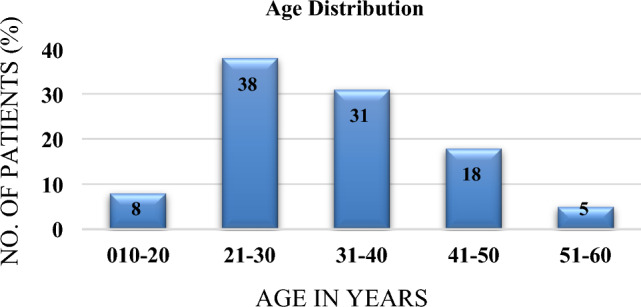
Age distribution
In the study, 62 (62%) subjects were males and 38 (38%) subjects were females as depicted in (Fig. 2) with M:F ratio of 1.6:1.
Fig. 2.

Gender wise distribution
Ear warmth (34%) followed by aural fullness (20%) and tinnitus (17%) were the main associated complaints in the subjects at the time of enrolment in the study. However, 36% of subjects had no complaints. (Fig. 3).
Fig. 3.

Associated complaints of the subjects
On the basis of years of exposure, 26 (26%) were in group A (< 5 years of exposure) while 74 subjects were (74%) were in group B (> 5 years of exposure). The mean age in group A was 21.5 ± 4.98 years and group B was 35.45 ± 7.90 years. (Fig. 4).
Fig. 4.
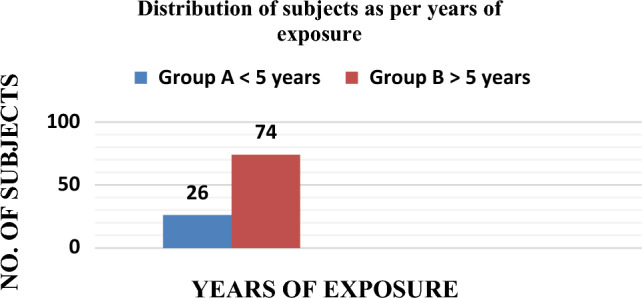
Distribution of subjects as per years of exposure
On the basis of average daily usage of mobile phones, 53 (53%) were in group 1 (< 60 min of average daily use) while 47 subjects were (47%) were in group 2 (> 60 min of average daily use). The mean age in group 1 was 31.26 ± 10.49 years and group 2 was 32.46 ± 8.30 years (Table 1).
Table 1.
Distribution of subjects as per average daily usage
| Average daily usage | Number of subjects | Percentage (%) | Mean age ± SD |
|---|---|---|---|
| Group 1 < 60 min | 53 | 53(%) | 31.26 ± 10.49 |
| Group 2 > 60 min | 47 | 47(%) | 32.46 ± 8.30 |
The difference between mean AC threshold of Group A and Group B at frequencies 250 Hz, 500 Hz, 1 k Hz, 2 k Hz, 4 k Hz was statistically insignificant whereas at higher frequencies (8 k Hz, 10 k Hz, 12 k Hz) was statistically significant. The difference between mean BC threshold of Group A and Group B at frequencies of 1 k Hz, 2 k Hz, 4 k Hz and 8 Hz was statistically significant. This revealed that hearing loss was more at higher frequencies in subjects using mobile phone for > 5 years (Group B) as compared to subjects using mobile phone for < 5 years (Group A) as depicted in (Table 2).
Table 2.
Comparison of auditory thresholds (air and bone conduction) of dominant ear with years of exposure
| Frequency (Hz) | Mean AC threshold (dB) | Mean BC threshold (dB) | ||||
|---|---|---|---|---|---|---|
| Group A mean ± SD | Group B mean ± SD | p- value | Group A mean ± SD | Group B mean ± SD | p value | |
| 250 | 11.73 ± 4.8 | 13.77 ± 4.90 | 0.069 | 11.15 ± 2.93 | 14.38 ± 4.62 | 0.052 |
| 500 | 11.53 ± 5.98 | 14.73 ± 4.79 | 0.007 | 11.53 ± 3.39 | 16.67 ± 4.70 | 0.07 |
| 1000 | 14.97 ± 4.44 | 17.14 ± 4.72 | 0.053 | 14.58 ± 3.94 | 21.5 ± 4.73 | 0.056 |
| 2000 | 19.62 ± 5.27 | 22.26 ± 6.14 | 0.063 | 19.42 ± 4.75 | 23.1 ± 4.11 | 0.045 |
| 4000 | 21.53 ± 5.96 | 24.01 ± 7.27 | 0.137 | 20 ± 6.16 | 23.09 ± 6.19 | 0.03 |
| 8000 | 23.67 ± 6.31 | 27.05 ± 7.88 | 0.037 | 20.9 ± 6.16 | 24.05 ± 6.06 | 0.025 |
| 10,000 | 24.8 ± 6.31 | 27.10 ± 7.88 | 0.037 | NA | NA | NA |
| 12,000 | 24.91 ± 6.24 | 29.65 ± 7.17 | 0.004 | NA | NA | NA |
The difference between mean AC threshold of Group 1 and Group 2 at frequencies 250 Hz, 500 Hz, 1 k Hz, 2 k Hz was statistically insignificant whereas at higher frequencies 8 k Hz, 10 k Hz, 12 k Hz was statistically significant. The difference between mean BC threshold of Group 1 and Group 2 at frequencies 250 Hz, 500 Hz, 1 k Hz, was statistically insignificant and the mean BC threshold at higher frequency 2 k Hz, 4 k Hz, 8 k Hz was statistically significant. This revealed that hearing loss was more at higher frequencies in subjects using mobile phone for > 60 min (Group 2) as compared to subjects using mobile phone for < 60 min (Group 1) as depicted in Table 3.
Table 3.
Comparison of auditory thresholds (air and bone conduction) of dominant ear with average daily use
| Frequency (Hz) | Mean AC threshold (db) | Mean BC threshold (db) | ||||
|---|---|---|---|---|---|---|
| Group 1 mean ± SD | Group 2 mean ± SD | p value | Group 1 mean ± SD | Group 2 mean ± SD | p value | |
| 250 | 13.17 ± 4.29 | 13.29 ± 4.07 | 0.827 | 12.88 ± 4.75 | 13.19 ± 3.95 | 0.68 |
| 500 | 13.75 ± 4.61 | 14.04 ± 4.25 | 0.684 | 13.26 ± 4.81 | 14.04 ± 4.25 | 0.36 |
| 1000 | 16.6 ± 5.09 | 16.53 ± 4.30 | 0.950 | 15.92 ± 4.71 | 16.34 ± 4.51 | 0.56 |
| 2000 | 21.63 ± 7.04 | 21.48 ± 4.65 | 0.987 | 21.25 ± 6.62 | 23.73 ± 4.84 | 0.044 |
| 4000 | 22.98 ± 8.29 | 23.82 ± 5.23 | 0.470 | 21.92 ± 8.38 | 25.19 ± 5.15 | 0.022 |
| 8000 | 24.61 ± 8.30 | 27.66 ± 6.49 | 0.035 | 23.07 ± 8.05 | 26.02 ± 5.48 | 0.037 |
| 10,000 | 26.53 ± 8.30 | 27.66 ± 6.49 | 0.035 | NA | NA | NA |
| 12,000 | 12.88 ± 7.36 | 30.4 ± 6.49 | 0.005 | NA | NA | NA |
DPOAE was present (pass) in maximum subjects in Group A 25(96.15%), however it was absent in 1(3.85%) subject. In Group B, however DPOAE was present in 60(81.08%) subjects while absent in 14 (18.92%) subjects. The difference between DPOAE findings in Group A and Group B was statistically insignificant. (Table 4).
Table 4.
Association of years of exposure with DPOAE
| Year of exposure | DPOAE | Odds Ratio (95% CI) | Chi. Sq. value | p value | |
|---|---|---|---|---|---|
| Refer | Pass | ||||
| Group A (< 5 years) | 1 (3.85%) | 25 (96.15%) | 5.8(0.7–46.7) | 3.43 | 0.06 |
| Group B (> 5 years) | 14 (18.92%) | 60 (81.08%) | |||
DPOAE was present (pass) in 43 (81.13%) subjects in Group 1, however it was absent in 10 (18.87%) subjects. In Group 2, however DPOAE was present in 42 (89.36%) subjects while absent in 5 (10.64%) subjects. The difference between DPOAE findings in Group 1 and Group 2 was statistically insignificant (Table 5).
Table 5.
Association of average daily use with DPOAE
| Average daily use | DPOAE | Odds ratio (95% CI) | Chi. Sq. value | p-value | |
|---|---|---|---|---|---|
| Refer | pass | ||||
| Group 1(< 60 min) | 10 (18.87%) | 43 (81.13%) | 1.95 (0.62–6.20) | 1.32 | 0.25 |
| Group 2(> 60 min) | 5 (10.64%) | 42 (89.36%) | |||
The mean value of Absolute Wave I Latency in the Group A was 1.25 ± 0.49 ms and in group B was 1.34 ± 0.52 ms. The difference between the two was statistically insignificant (p = 0.43). The mean value of Wave III latency was 3.66 ± 0.528 ms and 3.72 ± 0.62 ms for Group A and Group B respectively and the difference was statistically non-significant (p = 0.78). The mean value absolute wave V latency was 6.01 ± 0.22 ms for Group A and 6.11 ± 0.211 ms for group B and the difference was statistically significant (p = 0.043). The mean value of IPL of Wave I–III in the group A was 2.51 ± 0.94 ms and that of group B was 2.39 ± 0.81 ms. The difference was statistically non-significant (p = 0.079). The mean value of IPL of Wave III-V in the group A was 2.41 ± 0.21 ms and that in the group B was 2.51 ± 0.19 ms. The difference was statistically significant (0.026). The mean value of IPL of Wave I–V in the group A was 4.85 ± 0.45 ms and that in the group B was 4.55 ± 0.61 ms. The difference was statistically significant (p = 0.023). (Table 6).
Table 6.
Auditory brain response findings in group A & group B
| BERA | Group A mean ± SD (msec) | Group B mean ± SD (msec) | t value | p value |
|---|---|---|---|---|
| Wave I latency | 1.25 ± 0.49 | 1.34 ± 0.52 | − 0.793 | 0.430 |
| Wave III latency | 3.66 ± 0.528 | 3.72 ± 0.62 | − 0.273 | 0.786 |
| Wave V latency | 6.01 ± 0.225 | 6.11 ± 0.211 | − 0.269 | 0.043 |
| I-III IPL | 2.51 ± 0.94 | 2.39 ± 0.81 | 0.79 | 0.428 |
| III-V IPL | 2.41 ± 0.21 | 2.51 ± 0.19 | − 0.84 | 0.026 |
| I-V IPL | 4.85 ± 0.45 | 4.55 ± 0.61 | 1.5 | 0.023 |
The mean value of Absolute Wave I Latency in the Group 1 was 1.16 ± 0.51 ms and in Group 2 was 1.51 ± 0.45 ms. The difference between the two was statistically significant (p = 0.000). The mean value of Wave III, V was 3.61 ± 0.55 ms, 5.87 ± 0.55 ms for Group 1 and Group 2 was 3.83 ± 0.62 ms, 6.24 ± 0.52 ms, respectively and the difference was statistically significant p = 0.045, (p = 0.001 respectively). The mean value of IPL of Wave I–III in the Group 1 was 2.480 ± 0.51 ms and that of Group 2 was 2.71 ± 0.42 ms. The difference was statistically significant (p = 0.016). The mean value of IPL of Wave III-V in the Group 1 was 2.41 ± 0.37 ms and that in the Group 2 was 2.58 ± 0.48 ms. The difference was statistically significant (0.0048). The mean value of IPL of Wave I–V in the Group 1 was 4.54 ± 0.41 ms and that in the Group 2 was 4.73 ± 0.48 ms. The difference was statistically significant (p = 0.035). The latencies of waves I, III and wave V and interpeak latencies were found to be significantly prolonged in Group 2 using mobile phones for > 60 min/day compared to Group 1 who were using phones for < 60 min/day. (Table 7).
Table 7.
Auditory brain response findings in group 1 & group 2
| BERA | Group 1 mean ± SD(msec) | Group 2 mean ± SD(msec) | t-value | p value |
|---|---|---|---|---|
| Wave I latency | 1.16 ± 0.51 | 1.51 ± 0.45 | − 3.7 | 0.000 |
| Wave III latency | 3.61 ± 0.55 | 3.83 ± 0.62 | − 2.03 | 0.045 |
| Wave V latency | 5.87 ± 0.55 | 6.24 ± 0.52 | − 3.5 | 0.001 |
| I-III IPL | 2.480 ± 0.51 | 2.71 ± 0.42 | − 0.628 | 0.016 |
| III-V IPL | 2.41 ± 0.37 | 2.58 ± 0.48 | − 0.621 | 0.048 |
| I-V IPL | 4.54 ± 0.41 | 4.73 ± 0.48 | − 0.991 | 0.035 |
The MLR parameters were compared between Group A and Group B and it was found that subjects of Group A and Group B had Na latencies of 9.29 ± 1.50 ms and 10.08 ± 1.80 ms respectively. The difference was statistically significant (p = 0.04). The mean Pb latency of Group A and Group B was 29 ± 2.59 and 30 ± 1.53 respectively. The difference was statistically significant (p = 0.02). The MLR parameters were compared between Group 1 and Group 2 and it showed that subjects of Group 1 and Group 2 phone users had Na latencies of 10.06 ± 1.05 ms and 9.72 ± 0.52 ms respectively. The difference was statistically significant (p = 0.04). The mean Pb latency of Group 1 and Group 2 was 30.16 ± 1.07 ms and 29.74 ± 0.75 ms respectively. The difference was also statistically significant (p = 0.02). (Table 8).
Table 8.
MLR findings of dominant ear in group A, group B, group 1 & group 2
| Year of exposure | t value | p value | Average daily use | t value | p value | |||
|---|---|---|---|---|---|---|---|---|
| Group A mean ± SD (msec) | Group B mean ± SD (msec) | Group 1 mean ± SD (msec) | Group 2 mean ± SD (msec) | |||||
| Na latency | 9.29 ± 1.50 | 10.08 ± 1.80 | − 1.182 | 0.04 | 10.06 ± 1.05 | 9.72 ± 0.52 | 0.481 | 0.04 |
| Pb latency | 29 ± 2.59 | 30 ± 1.53 | − 0.63 | 0.02 | 30.16 ± 1.07 | 29.74 ± 0.75 | 0.87 | 0.02 |
In Group A, mild SNHL was seen in 3 (11.54%) subjects in whom 2 subjects had > 60 min average daily usage and 1 had < 60 min daily usage. In Group B, 19 (25.68%) subjects had mild SNHL out of which 6 were in group 2 and 13 were in group 1. In group B, 2(2.7%) subjects had moderate SNHL (Table 9).
Table 9.
Descriptive analysis of SNHL and average daily use as well as years of exposure
| Years of exposure | Average daily use | Pure tone audiometry | ||||
|---|---|---|---|---|---|---|
| Normal | Mild SNHL | Moderate SNHL | Mean hearing threshold | p value | ||
| Group A (< 5yrs) | Group 1 (< 60 min) | 18 | 1 | 0 | 17.98 ± 3.35 | 0.0015 |
| Group 2 (> 60 min) | 5 | 2 | 0 | 20.83 ± 5.10 | ||
| Group B (> 5yrs) | Group 1 (< 60 min) | 20 | 13 | 0 | 19.83 ± 4.30 | 0.932 |
| Group 2 (> 60 min) | 33 | 6 | 2 | 19.89 ± 2.67 | ||
The mean hearing threshold was16.27 ± 3.71 dB in Group A and in Group B was18.8 ± 4.72 dB and the difference was statistically significant (< 0.015), as depicted in (Table 10). This shows an increase in hearing thresholds with increase in years of exposure to the mobile phones.
Table 10.
Mean hearing thresholds on years of exposure
| Group | Mean hearing threshold ± SD | p value |
|---|---|---|
| Group A < 5 years | 16.27 ± 3.71 | 0.015 |
| Group B > 5 years | 18.8 ± 4.72 |
The mean hearing threshold in Group1 was 17.94 ± 5.29 dB and in Group 2 was 18.37 ± 3.70 dB, and the difference was statistically insignificant, as depicted in (Table 11).
Table 11.
Mean hearing threshold as per average daily usage
| Group | Mean hearing threshold ± SD | p value |
|---|---|---|
| Group 1 < 60 min | 17.94 ± 5.29 | 0.646 |
| Group 2 > 60 min | 18.37 ± 3.70 |
Discussion
In the present study, maximum subjects (38%) were in the age group of 21–30 years followed by 31%in the age group of 31–40 years, 18% in 41–50 years, 8% in 10–20 years and minimum subjects (5%) were in the age group of 51–60 years. The mean age of the subjects was 31.83 ± years. 62 subjects were males and 38 subjects were females with male: female ratio of 1.6:1. This is in tune with the study conducted by Kerekhanjarong et al. [12] Das et al. [13] and Youssef et al. [14] On the basis of the years of exposure,26 (26%) subjects were in Group A (< 5 years of exposure) while 74 subjects were (74%) were in Group B (> 5 years of exposure). The mean age in Group A was 21.5 ± 4.98 years and Group B was 35.45 ± 7.90 years. On the basis of average daily usage, 53 (53%) were in Group 1 (< 60 min of average daily usage) while 47 subjects were (47%) were in Group 2 (> 60 min of exposure). The mean age in Group 1 was 31.26 ± 10.49 years and Group 2 was 32.46 ± 8.30. In a study conducted by Malik et al. [15] where categorization of mobile phone users was done as Group A—using mobile for less than 1h/day for 1 year or more and Group B—using mobile for more than 1h/day for1 year or more the mean age was found to be 20.45 ± 1.55 years in Group A and 21.85 ± 2.81 years in Group B. Patel et al. [16] reported mean age to be 26.17 ± 2.65 years in study Group and that of controls to be 26 ± 3.93 years. Velayutham et al. [5] reported mean age to be 27 years. A study by Ramya et al. [17] had mean age in test group as 18.2 ± 1.5 years and in controls as 17.2 ± 2.1 years. Sahoo et al. [18] reported Mean age to be 32 years. In the present study ear warmth (34%) followed by aural fullness (20%) and tinnitus (17%) were the main associated complaints in the subjects at the time of enrolment. However, 36% of the Subjects had no complaints. In a study conducted by Madane et al. [19] heating sensation of ears (27%) was the most common complaint followed by blocked sensation in ears (16%), tinnitus (10%) and difficulty in hearing (4%). In a study done by Sultan et al. [20] about 34.59% of problems were related with impaired hearing, ear ache and/or warmth on the ear, and 5.04% of complaints with the decreased and/or blurred vision. The mean value of air conduction and bone conduction threshold on pure tone audiometry in our study revealed that hearing loss was more at higher frequencies in subjects using mobile phone for > 5 years (Group B) as compared to subjects using mobile phone for < 5 years (Group A). The mean AC threshold at 12,000 Hz for Group A was 24.91 ± 6.24 dB and for Group B was 29.65 ± 7.17 dB. The mean BC threshold at 8000 Hz for Group A was 20.9 ± 6.16 dB and for Group B was 24.05 ± 6.06 dB. The difference between the two groups was statistically significant. Thus, the present study showed that a higher degree of hearing loss is associated with long term exposure to EM field generated by cellular phones. On comparing the AC and BC thresholds in group 1 (< 60 min) and Group 2(> 60 min), it was found that threshold were statistically significantly increased in group 2 as compared to Group 1 at higher frequencies (> 8000 Hz). Thus, hearing loss was found to be worse at higher frequency in frequent mobile phone users in our study. Similar findings are seen in study conducted by Shafique MA et al. [21] which showed significant increase in the thresholds (in dB) at all frequencies in air and bone conduction was noted in left ear except for bone conduction at frequency of 4 and 6 kHz. Shayani-Nasab et al. [22] had found significant increase in the hearing thresholds among mobile phone users comparing with non-users in a cohort study. Another study conducted by Ramaya et al. [17] has also shown a significant rise in the hearing thresholds at all frequencies in air and bone conduction for both right and left ear between test and control group except for bone conduction at higher frequencies like 4 to 6 kHz. However, a study by Oktay et al. [23] no significant difference was observed in moderate phone users (10–20 min per day). In present study DPOAE was present (pass) in maximum subjects in Group A 25(96.15%), however it was absent in 1(3.85%) subjects. In Group B, however DPOAE was present in 60(81.08%) subjects while absent in 14 (18.92%) subjects. DPOAE was present (pass) in 43(81.13%) subjects in Group 1, however it was absent in 10(18.87%) subject. In Group 2, DPOAE were present in 42 (89.36%) subjects while absent in 5 (10.64%) subjects. However, these differences were not statistically significant. Thus present study revealed that prolonged and frequent exposed to EMR from mobile phone did not cause any significant change in DPOAE. In the study conducted by Panda et al. [6] it was revealed that the GSM and CDMA individuals are at higher risk of having absent DPOAE compared with the control population. Kizilay et al. and Aran et al. [24, 25] did not report any changes in OAES secondary to radio frequency exposure. Our ABR findings suggested that the latencies of waves I, III and wave V and interpeaklatencies were found to be significantly prolonged in Group 2 (using mobile phones for > 60 min/day) as compared to Group 1 (using phones for < 60 min/day). Also the wave V latency and IPL III–V and I–V showed statistically significant prolongation in group B (> 5 yrs of exposure) as compared to group A (< 5 yrs of exposure). Our findings are in tune with other studies by Khullar et al. [26] and Panda et al. [6] and contrary to studies by Manhas et al. [27] and Gupta et al. [28]. In the present study, an increase in MLR latencies of Na and Pb were noted in individuals who had prolonged and frequent exposure suggesting a delay in the conduction of auditory impulses. Thus this indicates that prolonged and frequent exposure to mobile phones radiations can significantly affect thalamocortical nervous pathways present in auditory system of brain. Our findings are consistent with the studies conducted by Panda et al. [6] and Priya et al. [29]. However, Arai et al. [30] did not find any such relationship. In the present study in group A, mild SNHL was seen in 3 subjects out of which 2 subjects had > 60 min average daily usage and 1 had < 60 min daily usage. In group B 19 (25.68%) subjects had mild SNHL out of which 6 were in group 2 and 13 were in group 1. In group B, 2 subjects had moderate SNHL. The mean hearing loss threshold in Group A was 16.27 ± 3.71 dBand in group B was 18.8 ± 4.71 dB and the difference was statistically significant. The mean hearing threshold in Group1 was 17.94 ± 5.29 dB and in Group 2 was 18.37 ± 3.70 dB. In a study conducted by Prajapati et al. [3], out of 60 subjects in 22 subjects with mobile usage for 1–2 years, 12 subjects (54.54%) were having mild high frequency hearing loss with mean hearing loss of 4.08 ± 2.65 dB. In 32 subjects with mobile usage for 2–4 years, 28 subjects (87.5%) were having mild to moderate high frequency hearing loss with mean hearing loss of 8.43 ± 4.08 dB. In 6 subjects with mobile usage for > 4 years were having moderate high frequency hearing loss with mean hearing loss of 24.16 ± 5.69 dB. In a study conducted by Swaroop et al. [8], it was observed that the duration of hours and years of exposure to mobile phones had significant impact on HL. Exposure to mobile phones for a stretch of 2–3 h/day for 1–3, 3–6 and > 6 years had significant SNHL and p value turned out to be statistically significant (p < 0.05). Exposure to mobile phones for a stretch of 4–6 h/day for 1–3, 3–6 and > 6 years had significant impact on SNHL and p value turned out to be statistically significant (p = 0.05). Exposure to mobile phones for a stretch of > 6 h/day for 1–3, 3–6 and > 6 years had significant impact on SNHL and p value also turned out to be statistically significant (p < 0.05). A similar study by Das et al. [13] also observed that in terms of hours and years of exposure to mobile phones, the hearing thresholds (bone conduction thresholds) were significantly higher in the exposed ears at all speech frequencies and p value was found to be statistically significant.
Conclusion
The present study shows that the electromagnetic radiations emitted from mobile phones have a deleterious effect on the human auditory system. In our study we found subclinical hearing loss more at higher frequencies especially in individuals with prolonged (> 5 years) and frequency (> 60 min/day) usage. This study also shows that the long-term usage of mobile phones significantly affects the nerve conduction in auditory pathway especially the thalamocortical region. Although the present study shows an increase in hearing threshold of the ear exposed to prolonged to use of mobile phones, it is not known whether this threshold shift is temporary or permanent. Thus, more studies with larger sample size and long term follow up are required to validate our findings. Moreover, scientific data are lacking on molecular and biochemical alterations caused by EMRs in the inner ear and this provides an interesting avenue for further research.
Recommendations
Based on the current study, it is advised to limit the usage of mobile phones so as to reduce the damage caused by EMRs to the auditory system. By using speaker phones or hands-free system, the direct exposure to electromagnetic radiations emitted by mobile phones can be minimized. Regular audiometric screening of all mobile phone users is recommended.
Acknowledgements
The author appreciates the support they received from Management and staff of the hospitals where this study was carried.
Author Contributions
The research concept was given by Dr GK. The research was carried out by Dr PS. Dr. PK was the facilitator to conduct the discussions. Dr PS wrote the manuscript in consultation with Dr GK. All authors iteratively read the manuscript, revised and agreed with the final version of the manuscript.
Funding
The authors did not receive any funding for this study.
Declarations
Conflict of interest
The authors have no conflict of interest to declare.
Consent to Participation
Informed consent was taken from all participants.
Footnotes
Publisher's Note
Springer Nature remains neutral with regard to jurisdictional claims in published maps and institutional affiliations.
References
- 1.Repacholi MH. Health risks from the use of mobile phones. Toxicol Lett. 2001;120:323–331. doi: 10.1016/S0378-4274(01)00285-5. [DOI] [PubMed] [Google Scholar]
- 2.Van Leeuwen GM, Lagendijk JJ, Van Leersum BJ, et al. Calculation of change in brain temperatures due to exposure to a mobile phone. Phys Med Biol. 1999;44:2367–2379. doi: 10.1088/0031-9155/44/10/301. [DOI] [PubMed] [Google Scholar]
- 3.Prajapati V, Makvana BJ, Gami G, et al. Effect of chronic use of mobile phone on hearing of young adult age group: a case control study. Int J Res Med Sci. 2015;3(10):2664–2668. doi: 10.18203/2320-6012.ijrms20150810. [DOI] [Google Scholar]
- 4.Myung SK, Ju W, McDonnell DD, et al. Mobile phone use and risk of tumors: a meta analysis. J Clin Oncol. 2009;27:5565–5572. doi: 10.1200/JCO.2008.21.6366. [DOI] [PubMed] [Google Scholar]
- 5.Velayutham P, Govindasamy GK, Raman R, et al. High-frequency hearing loss among mobile phone users. Indian J Otolaryngol Head Neck Surg. 2014;66(1):169–172. doi: 10.1007/s12070-011-0406-4. [DOI] [PMC free article] [PubMed] [Google Scholar]
- 6.Panda NK, Gupta K, Patro SK, et al. Mobile phones for mobility or morbidity: Is there an evidence for morbidity? Ann Indian Acad Otorhinolaryngol Head Neck Surg. 2017;1:9–14. doi: 10.4103/aiao.aiao_4_16. [DOI] [Google Scholar]
- 7.Philip P, Bhandary SK, Aroor R, et al. The effect of mobile phone usage on hearing in adult population. Indian J Otol. 2017;23:1–6. doi: 10.4103/0971-7749.199510. [DOI] [Google Scholar]
- 8.Swaroop K, Kumar S, Bansal A, et al. Study of the effect of mobile phones on hearing. Int J Otorhinolaryngol Head Neck Surg. 2021;7(3):520–524. doi: 10.18203/issn.2454-5929.ijohns20210688. [DOI] [Google Scholar]
- 9.Lohitashwa R, Soumya BA, Deshpande DV. A cross sectional study of effects of mobile phone exposure on Brainstem evoked response audiometry (BERA) Indian J Clin Anat Physiol. 2019;6(2):205–208. doi: 10.18231/j.ijcap.2019.046. [DOI] [Google Scholar]
- 10.Priya K, Thirunavukarasu P. Assessment of hearing among mobile phone users. Int J Otorhinolaryngol Head Neck Surg. 2019;5:1167–1171. doi: 10.18203/issn.2454-5929.ijohns20193119. [DOI] [Google Scholar]
- 11.Srinivasa V, Subramaniam J, Chakkravathy I, et al. A study on the effect of prolonged mobile phone usage on hearing among students. Int J Otorhinolaryngol Head Neck Surg. 2020;6:493–496. doi: 10.18203/issn.2454-5929.ijohns20200622. [DOI] [Google Scholar]
- 12.Kerekhanjanarong V, Supiyaphun P, Naratricoon J, et al. The effect of mobile phone to audiologic system. J Med Assoc Thai. 2005;88(4):231–234. [PubMed] [Google Scholar]
- 13.Das S, Chakraborty S, Mahanta B. A study on the effect of prolonged mobile phone use on pure tone audiometry thresholds of medical students of Sikkim. J Postgrad Med. 2017;63(4):221–225. doi: 10.4103/0022-3859.201419. [DOI] [PMC free article] [PubMed] [Google Scholar]
- 14.Youssef M, Mansour T, Abdelsalam HA. The impact of smart phones and mobile devices on human health and life. Int J Commun Med Public Health. 2020;7(1):9–15. [Google Scholar]
- 15.Malik P, Singla A, Wadhera R, et al. The effect of mobile phone use on hearing on pure tone audiometry. J Otolaryngol ENT Res. 2020;12(2):54–58. doi: 10.15406/joentr.2020.12.00456. [DOI] [Google Scholar]
- 16.Patel H, Qureshi R. Effects of long term use of mobile phones on hearing status of healthy individuals compared to infrequent mobile phone users in age group of 15–40 years. Int J Sci Res. 2013;2(11):177–179. [Google Scholar]
- 17.Ramya CS, Karthiyanee K, Vinutha S. Effect of mobile phone usage on hearing threshold: a pilot study. Indian J Otol. 2011;17:159–161. doi: 10.4103/0971-7749.94494. [DOI] [Google Scholar]
- 18.Sahoo GC, Sebastian H. Prevalence of sensorineural deafness in habitual mobile phone users. Indian J Otol. 2011;17(3):97–100. doi: 10.4103/0971-7749.91182. [DOI] [Google Scholar]
- 19.Madane V, Kolwadkar N, Rangari P. Cellphone hazards on hearing—an observational study in Mumbai population. Int J Med Sci Diagn Res (IJMSDR) 2019;3(3):65–72. [Google Scholar]
- 20.Sultan M. Association of mobile phone radiation with fatigue, headache, dizziness, tension and sleep disturbance in Saudi population. Saudi Med J. 2004;25(16):732–736. [PubMed] [Google Scholar]
- 21.Shafique MA, Fahim M, Akhtar M, et al. Hearing loss among excessive mobile phone users; a cross sectional study at Bahawal Victoria and civil teaching hospitals Bahawalpur. JBUMDC. 2019;9(1):21–24. doi: 10.51985/JBUMDC2018074. [DOI] [Google Scholar]
- 22.Shayani-Nasab M, Safavi Naiianni SA, Fathol Alolomi MR. Effects of mobile telephones on hearing. Acta Med Iran. 2006;44(1):46–48. [Google Scholar]
- 23.Oktay MF, Dasdag S. Effects of intensive and moderate cellular phone use on hearing function. Electromagn Biol Med. 2006;25(1):13–21. doi: 10.1080/15368370600572938. [DOI] [PubMed] [Google Scholar]
- 24.Kizilay A, Ozturan O, Erdem T, et al. Effects of chronic exposure of electromagnetic fields from mobile phones on hearing in rats. Auris Nasus Larynx. 2003;30:239–245. doi: 10.1016/S0385-8146(03)00054-3. [DOI] [PubMed] [Google Scholar]
- 25.Aran JM, Carrere N, Chalan Y, et al. Effects of exposure of the ear to GSM microwaves: In vivo and in vitro experimental studies. Int J Audiol. 2004;43:545–554. doi: 10.1080/14992020400050069. [DOI] [PubMed] [Google Scholar]
- 26.Khullar S, Sood A, Sood S. Auditory Brainstem responses and EMFs generated by mobile phones. Indian J Otolaryngol Head Neck Surg. 2013;65(Suppl 3):645–649. doi: 10.1007/s12070-013-0676-0. [DOI] [PMC free article] [PubMed] [Google Scholar]
- 27.Manhas M, Mrityunjay KG, et al. A study to evaluate the effects of mobile phone generated EMF in auditory brainstem responses. JK Sci. 2017;19(1):43–47. [Google Scholar]
- 28.Gupta N, Goyal D, Arora KS, et al. Effect of prolonged use of mobile phone on brainstem auditory evoked potentials. J Clin Diagn Res. 2015;9(5):7–9. doi: 10.7860/JCDR/2015/13831.5976. [DOI] [PMC free article] [PubMed] [Google Scholar]
- 29.Priya JA, Kumar MA, Roopakala MS. Does the duration of mobile phone usage affect the human auditory system? A middle latency auditory-evoked potential study in young adults. Natl J Physiol Pharm Pharmacol. 2018;8(4):611–615. [Google Scholar]
- 30.Arai N, Enomoto H, Okabe S, et al. Thirty minutes mobile phone use has no short-term adverse effects on central auditory pathways. Clin Neurophysiol. 2003;114:1390–1394. doi: 10.1016/S1388-2457(03)00124-X. [DOI] [PubMed] [Google Scholar]