

Dear Editor,
To ease the burden of the increasing number of skin cancers, diagnostics using non‐invasive technologies are under development, with some in clinical use. Such include dermoscopy, reflectance confocal microscopy (RCM) and optical coherence tomography (OCT). 1 , 2 , 3 Challenges of these technologies can be a requirement of expertise in image analyses, a user‐dependent result, low specificity, a time‐consuming process, or high costs. 1 , 2 Additionally, active research on combining non‐invasive imaging with artificial intelligence (AI) is ongoing. 4 Most studies have been conducted in the diagnosis of pigmented skin lesions. 5
Hyperspectral (HS) imaging (HSI) is an optical modality combining spectroscopy and digital imaging with the advantages of a large field of view (FOV) and good imaging depth. 1 , 6 Compared to multispectral imaging (MS), 3 , 4 , 5 HSI uses a broader and more continuous range of wavelengths and can document more subtle spectral differences. It has been studied in the diagnosis of both pigmented and non‐pigmented skin lesions (Appendix).
This study aimed to test the diagnostic performance of a novel 3D HSI device, the SICSURFIS Spectral Imager, utilising convolutional neural network (CNN) analysis to discriminate some common, similar‐looking, mainly non‐pigmented skin lesions. Adult patients with histologically proven diagnoses of nodular basal cell carcinomas (nBCC), intradermal nevi (ID), Bowen's disease (BD), and seborrheic keratoses (SK) from the Department of Dermatology, Helsinki University Hospital, were included. Up to three lesions/diagnosis/patient was allowed; however, the lesions had to be located on separate skin areas to avoid overlapping. All 175 lesions were clinically and dermoscopically evaluated, after which photographs, hyperspectral images and biopsies were obtained. After excluding lesions with other histological diagnoses or imaging artefacts, 130 lesions from 73 patients were analysed; 32 nBCC, 28 ID, 30 BD and 40 SK (Appendix, Table 3). The flow‐chart of the study is presented in Figure 1. A minority (25/130, 13 nBCC and 12 BD) of lesions had small punch biopsies taken in mean 51 days before imaging. An analysis that excluded these lesions was conducted, and its outcomes were compared to the primary outcomes (sensitivity analysis).
FIGURE 1.

Flow‐chart of the included, excluded, and analysed lesions in the study.
The SICSURFIS imager, the imaging setup, and waveband selection is described in the Appendix, with references to our two previous detailed proof‐of‐concept studies. In short, we selected 33 wavebands to measure biophysical parameters of human skin. The spatial resolution was 24 × 24 µm/px and the penetration depth varied 0.5−6 mm. 6 The frame‐based imager is designed to capture spectral information in 3D format; thus, we utilised skin surface models of visible light and 33 spectral bands in our analysis.
The image pre‐processing, 3D skin surface depth map calculations, and details of the analysis, are described in the Appendix and our previous studies. HS lesion data cubes were annotated by a physician (VL). For each cube, we randomly selected 500 px from each lesion and 200 px from the healthy skin and formed 30 × 30 × 34 HS‐sub‐cubes around those pixels. The middle pixel, with its spectrum and depth information, was analysed. The results were obtained using a CNN with 2D and 3D branches. The training processes utilised the train‐test‐split by leave‐one‐out cross‐validation (LOO). 7 We had two experimental setups: BCC, ID, and healthy skin, and BD, SK, and healthy skin. For both setups we performed the tests using randomly selected ‘pixel‐wise’ results (Table 1). Majority voting results in Table 1 are calculated from the pixel‐wise classification results as follows: we classified every fifth pixel HS‐sub‐cube of each HS lesion cube and determined the class based on the majority pixels in the whole lesion. The tests were repeated for the same experimental setups, leaving out previously biopsied lesions, and corresponding CNN analyses were also conducted using only three wavebands and depth data (RBG‐CNN analysis, Table 1) to evaluate the benefit of HSI compared to a digital red‐green‐blue (RGB) picture, and the results compared to the main results.
TABLE 1.
Accuracy values of the pixel‐wise analysis and majority voting interpretations of the pixel‐wise results.
| Pixel‐wise | Majority voting | |||||
|---|---|---|---|---|---|---|
| HSI‐CNN a | RGB‐CNN b | Previously biopsied lesions excluded | HSI‐CNN a | RGB‐CNN b | Previously biopsied lesions excluded | |
| BCC, ID, healthy skin, % (95% confidence interval) | ||||||
| Sensitivity | 76 (76.1−76.9) | 71 (70.1−71.9) | 77 (76.1−77.9) | 85 (78.6−91.4) | 83 (76.2−88.4) | 88 (81.4−94.6) |
| Specificity | 88 (87.3−88.7) | 85 (84.3−85.7) | 88 (87.3−88.7) | 92 (87.1−96.9) | 93 (88.4−97.6) | 96 (92−100) |
| positive predictive value (PPV) | 76 (75.1−76.9) | 71 (70.1−71.9) | 77 (76.1−77.9) | 86 (79.7−92.3) | 85 (78.6−91.4) | 91 (85.2−96.8) |
| Accuracy | 76 (75.1−76.9) | 71 (70.1−71.9) | 77 (76.1−77.9) | 85 (78.6−91.4) | 83 (76.2−89.8) | 88 (81.4−94.6) |
| BD, SK, healthy skin, % (95% CI) | ||||||
| Sensitivity | 79 (78.3−79.7) | 76 (75.2−76.8) | 78 (77.3−78.7) | 84 (77.9−90.1) | 83 (76.8−89.2) | 88 (82.0−94.0) |
| Specificity | 89 (88.4−89.6) | 88 (87.4−88.6) | 89 (88.4−89.6) | 94 (90.1−97.9) | 94 (90.1−97.9) | 95 (91.0−99.0) |
| PPV | 79 (78.3−79.7) | 76 (75.2−76.8) | 78 (77.3−78.7) | 88 (82.6−93.4) | 86 (80.3−91.7) | 89 (83.3−94.7) |
| Accuracy | 79 (78.3−79.7) | 76 (75.2−76.8) | 78 (77.3−78.7) | 84 (77.9−90.1) | 83 (76.8−89.2) | 88 (82.0−94.0) |
| p | 8e‐73 | 0.16 | 0.146 | 0.37 | ||
Note: The main HSI‐CNN‐results, including all analysed wavebands and lesions, are bolded. Additionally, an RGB‐CNN analysis on three wavebands resembling a digital picture, and a sensitivity analysis, where all lesions with previous biopsies excluded, are shown. The confidence intervals were calculated assuming that the measurements follow normal distribution, and p‐values comparing the RGB‐CNN‐analysis to HSI‐CNN analysis, were calculated using Kruskal p‐test.
Abbreviations: BCC, basal cell carcinomas; BD, Bowen's disease; HSI‐CNN, hyperspectral imaging system and convolutional neural networks; ID, intradermal nevi; PPV, positive predictive value; RGB‐CNN, red‐green‐blue and convolutional neural networks; SK, seborrheic keratoses.
Red‐Green‐Blue—Convolutional Neural Network‐analysis.
Hyperspectral Imaging—Convolutional Neural Network‐analysis.
In the main results, the set including nBCC, ID and healthy skin, reached 85% sensitivity and 92% specificity in majority voting and the second set including BD and SK, 84% sensitivity and 94% specificity, respectively. All accuracy values of the pixel‐wise, majority voting, RGB‐CNN and sensitivity analyses are presented in Table 1. The detailed positive predictive values (PPVs) in majority voting are presented with confusion matrices (Figure 2) and examples of nBCC and BD classification maps are shown in Figures 3 and 4. The HSI‐CNN results were statistically significantly superior to those of RGB‐CNN in pixel‐wise analyses (p < 0.01) but comparable in majority voting analysis (p = 0.15). No significant difference was observed in the sensitivity analysis, excluding lesions with prior biopsies (p = 0.16/0.27).
FIGURE 2.

The confusion matrix of the majority‐voting interpretations (A) in discriminating nBCC, ID, and healthy skin, (B) in discriminating BD, SK, and healthy skin. As can be seen in (A), 90% of true nBCCs were correctly predicted as nBCCs. 9.7% of true nBCCs were predicted to be healthy skin or ID (false negatives) and were thus missed by our system. Also, 7.1% of true IDs were predicted to be nBCC (false positives) and would thus probably have been biopsied in real life based on the HSI‐CNN analysis. The respective results for BD/SK (B) were 90%, 10% and 12%. BD, Bowen's disease; HSI‐CNN, hyperspectral imaging system and convolutional neural networks; ID, intradermal nevi; nBCC, nodular basal cell carcinomas; SK, seborrheic keratoses.
FIGURE 3.
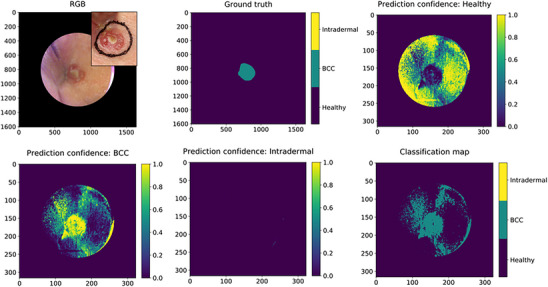
An example of a classification map of a nBCC extracted from the pixel‐wise analyses. The level of confidence of the classifier is described with colours (yellow = 100% confident, green > 50% confident). RGB: digital photograph constructed from the HSI data in the upper right corner and a digital photograph in the corner; Ground truth: the manual lesion annotation; Prediction confidence: Healthy: yellow indicates the area where classifier is confident of healthy skin; Prediction confidence: BCC: yellow indicates the area where classifier is confident of nBCC. Here, some artefacts are visible in the healthy skin area, which probably are related to the concave area of the lesion location in the inner eye corner/lateral dorsum of nose; Prediction confidence: Intradermal: the classifier did not predict any intradermal pixels; Classification map: the map classifies the lesion as a nBCC. BCC, basal cell carcinomas; HSI, hyperspectral imaging system; nBCC, nodular basal cell carcinomas; RGB, red‐green‐blue.
FIGURE 4.

An example of a BD classification map. RGB: digital photograph constructed from the HSI data and a digital photograph in the corner; Ground truth: the manual lesion annotation; Prediction confidence: Healthy: yellow indicates the area where classifier is confident of healthy skin; Prediction confidence: Mb. Bowen: yellow indicates the area where classifier is confident with BD. On the periphery of the lesion the classifier is only about 60% confident. As there is a biological continuum from AK to BD it could be speculated, that there is actinic keratosis on the edges of the lesion, which the CNN was not trained on; Prediction confidence: Seb. keratosis: here it could be speculated, that the spots around the BD marked by the classifier as SK could be actinic keratosis or solar lentigines around the lesion, which are classified falsely as SK. Classification map: the map classifies the lesions correctly as BD; however, the edges possibly falsely as SK. BD, Bowen's disease; CNN, convolutional neural networks; HSI, hyperspectral imaging system; SK, seborrheic keratoses.
This study shows that our system can differentiate skin lesions of both epithelial and melanocyte cell origin. We reached higher specificities than other optical methods, although the values from different data sets may not be directly comparable. For example, RCM achieved 95% specificity but a low 76% sensitivity in a meta‐analysis on BCCs 8 and OCT 89% sensitivity and 60% specificity for BCCs in a quantitative review. 9 Our analyses utilised a CNN in the analysis not requiring expertise from the user, as most imaging methods do.
Locations challenging to image, for example, uneven surfaces of the face, have previously posed a problem with HSI and have led to exclusions. 10 The SICSURFIS imager overcomes this by integrating 3D shape data into the spectral data. In this study, all lesion locations were included, and only 9% (13/143) of lesions were excluded due to low image quality.
Our 3D‐HSI‐CNN shows potential in skin cancer diagnosis, especially in primary health care, as an easy‐to‐use automated analysis method that does not require personal training. It may serve as an add‐on‐tool for specialists in ambiguous cases or for tumour border visualisation with pixel‐wise analyses, where we met narrow 95% confidential intervals in the results and superiority compared to RGB‐CNN analyses. Broad studies with various lesion types and ethnicities are required and head‐to‐head comparisons with other imaging modalities are required to verify the system's performance in clinical practice.
CONFLICT OF INTEREST STATEMENT
None declared.
IRB APPROVAL STATUS
The study was conducted in accordance with the Declaration of Helsinki and approved by the Institutional Review Board of Helsinki University Hospital (protocol code HUS/2089/2019, date of approval 30 July 2019).
Supporting information
Supporting information
This research was funded by the RADDESS program of the Research Council of Finland, consortium grant number 314519.
ACKNOWLEDGEMENTS
We thank Principal Scientist, PhD (Tech), Heikki Saari and his group from VTT for the technical development of the camera, and the staff members of the Department of Dermatology, Helsinki University Hospital, for recruiting patients. The skilful assistance of our registered nurses Emma Martikainen, Milja Manninen and Patrycja Zawislak, is acknowledged. This paper is dedicated to the memory of Professor Annamari Ranki.
Vivian Lindholmand Leevi Annala shared the first authorship.
Ilkka Pölönen, Annamari Ranki, Anna‐Maria Raita‐Hakola, and Mari Salmivuori contributed equally to this study.
DATA AVAILABILITY STATEMENT
Research data are not shared.
REFERENCES
- 1. Cignoni A, Banfi T, Ciuti G. Comparative analysis of diagnostic techniques for melanoma detection: a systematic review of diagnostic test accuracy studies and meta‐analysis. Front Med. 2021;8:637069. [DOI] [PMC free article] [PubMed] [Google Scholar]
- 2. Giuffrida R, Conforti C, Di Meo N, Deinlein T, Guida S, Zalaudek I. Use of noninvasive imaging in the management of skin cancer. Curr Opin Oncol. 2020;32(2):98‐105. [DOI] [PubMed] [Google Scholar]
- 3. Heibel HD, Hooey L, Cockerell CJ. A review of noninvasive techniques for skin cancer detection in dermatology. Am J Clin Dermatol. 2020;21(4):513‐524. [DOI] [PubMed] [Google Scholar]
- 4. Goyal M, Knackstedt T, Yan S, Hassanpour S. Artificial intelligence‐based image classification methods for diagnosis of skin cancer: challenges and opportunities. Comput Biol Med. 2020;127:104065. [DOI] [PMC free article] [PubMed] [Google Scholar]
- 5. Tschandl P, Rosendahl C, Akay BN, et al. Expert‐level diagnosis of nonpigmented skin cancer by combined convolutional neural networks. JAMA Dermatol. 2019;155(1):58‐65. [DOI] [PMC free article] [PubMed] [Google Scholar]
- 6. Lu G, Fei B. Medical hyperspectral imaging: a review. J Biomed Opt. 2014;19(1):010901. [DOI] [PMC free article] [PubMed] [Google Scholar]
- 7. James G, Witten D, Hastie T, Tibshirani R. An Introduction to Statistical Learning: With Applications in R. Springer; 2021. (Springer Texts in Statistics). https://link.springer.com/10.1007/978‐1‐0716‐1418‐1 [Google Scholar]
- 8. Dinnes J, Deeks JJ, Chuchu N, et al. Reflectance confocal microscopy for diagnosing keratinocyte skin cancers in adults. Cochrane Database Syst Rev. 2018;12:CD013191. [DOI] [PMC free article] [PubMed] [Google Scholar]
- 9. Reddy N, Nguyen BT. The utility of optical coherence tomography for diagnosis of basal cell carcinoma: a quantitative review. Br J Dermatol. 2019;180(3):475‐483. [DOI] [PubMed] [Google Scholar]
- 10. Christensen GB, Nagaoka T, Kiyohara Y, et al. Clinical performance of a novel hyperspectral imaging device for cutaneous melanoma and pigmented skin lesions in Caucasian skin. Skin Res Technol. 2021;27(5):803‐809. [DOI] [PubMed] [Google Scholar]
Associated Data
This section collects any data citations, data availability statements, or supplementary materials included in this article.
Supplementary Materials
Supporting information
This research was funded by the RADDESS program of the Research Council of Finland, consortium grant number 314519.
Data Availability Statement
Research data are not shared.