

Abstract
Background.
Percutaneous coronary intervention (PCI) in stable coronary artery disease (CAD) is commonly triggered by abnormal myocardial perfusion imaging (MPI). However, due to the possibilities of multivessel disease, serial stenoses and variability of coronary artery perfusion distribution, an opportunity exists to better align anatomic stenosis with perfusion abnormalities to improve revascularization decisions. This study aims to develop a multimodality fusion approach to assist decision-making for PCI.
Methods and Results.
Coronary arteries from fluoroscopic angiography (FA) were reconstructed into 3D artery anatomy. Left ventricular (LV) epicardial surface was extracted from SPECT. The artery anatomy and epicardial surface were non-rigidly fused. The accuracy of the 3D fusion was evaluated via both computer simulation and real patient data. Simulated FA and MPI were integrated and then compared with the ground truth from a digital phantom. The distance-based mismatch errors between simulated fluoroscopy and phantom arteries were 1.86 ± 1.43 mm for left coronary arteries (LCA) and 2.21 ± 2.50 mm for right coronary arteries (RCA). FA and SPECT images in 30 patients were integrated and then compared with the ground truth from CT angiograms. The distance-based mismatch errors between the fluoroscopy and CT arteries were 3.84 ± 3.15 mm for LCA and 5.55 ± 3.64 mm for RCA. The presence of the corresponding fluoroscopy and CT arteries in the AHA-17-segment model agreed well with a Kappa value of 0.91 (CI 0.89–0.93) for LCA and a Kappa value of 0.80 (CI 0.67–0.92) for RCA.
Conclusions.
Our fusion approach is technically accurate to assist PCI decision-making and is clinically feasible to be used in the catheterization laboratory. Future studies are necessary to determine if fusion improves PCI-related outcomes.
Keywords: Myocardial revascularization, fluoroscopy angiography, myocardial perfusion imaging, image fusion
INTRODUCTION
In stable coronary artery disease (CAD), mortality and morbidity benefits of revascularization by percutaneous coronary intervention (PCI) have not been fully realized in clinical trials.1,2 One hypothesis is revascularization, although visually “successful”, does not improve myocardial perfusion because incorrect lesions and/or vessel(s) are targeted. This is very plausible especially in cases with multivessel disease or serial stenoses. Typically, fluoroscopic angiography (FA) is performed independently of functional data such as myocardial perfusion imaging (MPI) and therefore, the image datasets are clinically segregated. Hypothetically, individualized fusion of FA and MPI datasets could assist and improve revascularization decisions if anatomic and functional abnormalities could be accurately aligned.
To test this hypothesis several processes must be developed. First, 2D FA datasets must be accurately converted into 3D datasets while maintaining anatomic precision. Second, extraction of left ventricular (LV) epicardial surface from MPI datasets must be accurate. Third, and most importantly, fusion of the 3D FA datasets with LV MPI datasets must be accurate. Fourth, the conversion, extraction, and fusion processes must be fast enough such workflow is not compromised and revascularization is not delayed.
Several fusion techniques, landmark-based3,4 and rigid iterative closest points (ICP),5,6 were developed and validated over the past decade. They require a pair of size-matched 3D artery anatomy from fluoroscopy angiograms and LV surface from single-photon emission computed tomography (SPECT) images. These conditions are challenging because of cardiac motion and thus image acquisitions at different cardiac frames impacting the accuracy of the 3D fusion between artery anatomy and LV surface. In order to match the time points, several studies used principal component analysis-based6 or visual estimation-based4 methods to select and fuse the end-diastolic fluoroscopy angiograms and end-diastolic SPECT images. However, all these estimation-based methods cannot guarantee a pair of size-matched artery anatomy and LV surface. A deformable registration algorithm is needed to improve the accuracy of the 3D fusion.
The objective of this study was to develop a deformable 3D fusion approach to integrate 3D coronary artery anatomy from fluoroscopy angiograms with LV epicardial surface from SPECT-MPI to guide revascularization decision-making.
MATERIALS AND METHODS
Patient Data
Thirty patients (21 males, and age = 63.0 ± 8.68 years) were retrospectively enrolled. All patients had either stable or exertional angina before they underwent SPECT-MPI, CT angiography, and FA. The severity of perfusion defects varied among the 30 patients: 14 had normal perfusion and 16 had fixed or reversible defects. The description of coronary lesions can be found in Table 1.
Table 1.
Coronary lesions among the thirty patients
| Artery | # of lesions | % stenosis |
|---|---|---|
| LMA | 3 | 45 ± 12 |
| LAD | 30 | 56 ± 14 |
| LCX | 21 | 43 ± 12 |
| RCA | 19 | 52 ± 13 |
Abbreviations are shown in Table 4
SPECT scan was performed using a dual-headed scanner (CardioMD, Philips Medical Systems, Milpitas, California) with a standard Tc-99 m-based resting and stress protocol and the acquired SPECT images have a voxel size of 6.4 × 6.4 × 6.4 mm3. CT angiography was performed using a 64-slice scanner (Somatom Definition, Siemens Medical Solutions, Forchheim, Germany) with a standard protocol and the acquired CT angiograms have a voxel size of 0.32 × 0.32 × 0.75 mm3. Fluoroscopic coronary arteriography was performed using an interventional angiography system (AXIOM-Artis, Siemens Medical Solutions, Munich, Germany) with a standard protocol and the acquired fluoroscopy angiograms have a pixel size of 0.34 × 0.34 mm2. It is noted that 19 of the 30 patients did not show right coronary artery (RCA) abnormality so each of them only took one RCA angiogram. This study was approved by the ethics committee of The First Affiliated Hospital of Nanjing Medical University.
The Workflow of this Study
First, 3D arterial anatomy was reconstructed from fluoroscopy angiograms. Second, LV epicardial surface was extracted from SPECT-MPI images. Third, the 3D artery anatomy was registered with the LV epicardial surface. A computer simulation was executed to technically evaluate the accuracy of the 3D fusion approach. Real patient data was used to evaluate the clinical feasibility of the 3D fusion approach.
Fluoroscopy Image Processing
Reconstruction of 3D artery anatomy from angiograms
The reconstruction of 3D artery anatomy includes three steps: artery extraction from fluoroscopy angiograms, imaging geometry calibration, and vessel point correspondences and 3D vessel reconstruction.
Artery extraction.
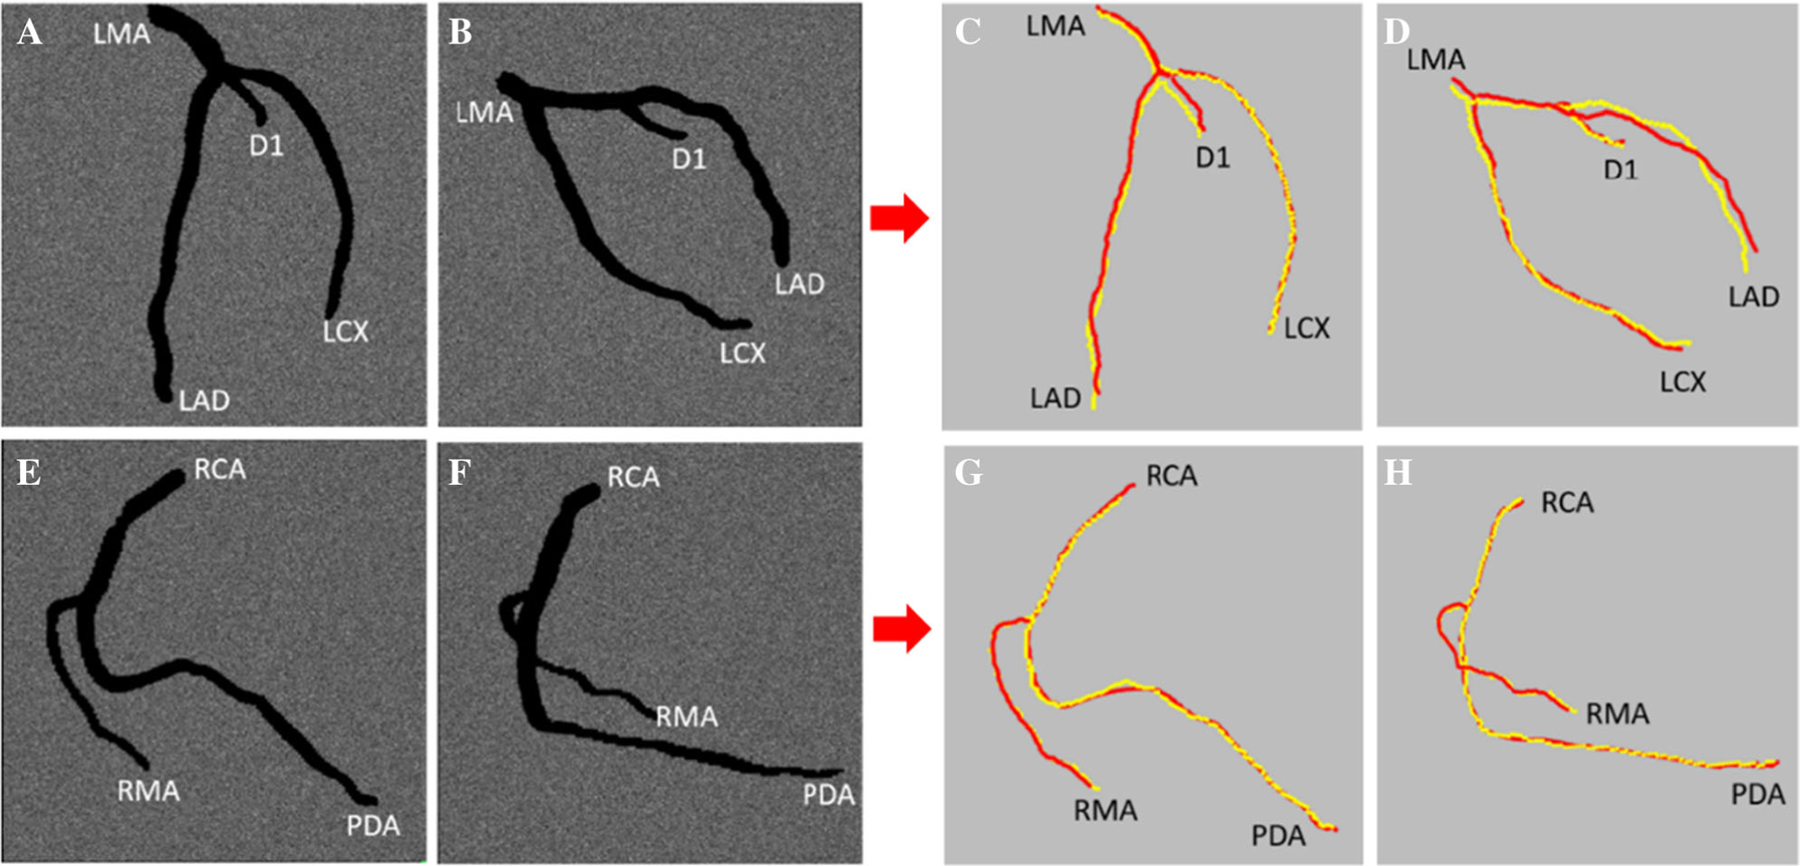
A deep learning model with an improved U-Net++ architecture7,8 was used to extract the coronary arteries on fluoroscopy angiograms (Figure 1B and F). The model completed artery extraction using an encoder-decoder architecture with nested connections and feature pyramids. Based on the extracted artery contours, a morphology thinning-based algorithm9,10 was used to skeletonize the extracted artery tree and then an edge-linking algorithm11 was applied to link the separate skeleton pixel points, where adjacent skeleton pixel points were linked together to form vessel segments till encountering edge junctions or endpoints. The vessel segments were selected via a developed interactive tool to construct complete centerlines of major arteries. Manually drawn segments were involved when the deep learning model performed poorly and therefore failed artery skeletonization. Accordingly, the centerlines on the primary and secondary projection views were extracted and paired (Figure 1C and G). The topology of the artery anatomy was then established and the bifurcations between the arteries were automatically identified. The radii of vessels were obtained by computing the distance between the centerlines and the outer contour of corresponding arteries.
Figure 1.

Reconstruction of 3D fluoroscopy artery anatomy. (A) and (E) Selected angiograms from the primary and secondary projection views; (B) and (F) extracted arteries; (C) and (G) artery skeletonization and generation of topology landmarks (red stars); (D) and (H) reconstructed 3D artery anatomy.
Imaging geometry calibration.
Imaging geometry parameters are key factors for 3D artery reconstruction. However, the parameters obtained from DICOM header may not be able to accurately define the imaging geometry because of several uncertainties, such as unknown image skew parameters, table translation between image acquisitions, and device assembly tolerances. A calibration algorithm was developed to optimize these parameters, as explained in steps i and ii.
A mathematical model was first developed. As shown in Figure 2, a spatial artery bifurcation point Qi is projected at an intersection point q1;i on the primary projection plane and at an intersection point q2;i on the secondary projection plane. Based on the principles of X-ray angiography and pinhole camera models,12 projection matrix mapping spatial point Qi to projection points (q1;i, q2;i) was derived. In the coordinate system of primary view, projection matrix P1 can be expressed as in Eq. 1, where SID is the distance between X-ray source and center of detector, s is the skew parameter in radial direction, uc and vc are the center coordinates of detector. Since the transformation from the primary to the secondary projection systems can be defined as a rotation R and translationt, the projection matrix P2 can be formulated as in Eq. 2. With a preset skew parameter s, all the geometry parameters in the equations can be initialized, though they may be not precise, by the parameters from DICOM header. Therefore, given two projection pointsq1;i(u1; v1) and q2;i(u2; v2), the spatial point Qi(xi; yi; zi) can be obtained by solving an over-determined equation created by the combination of Eqs. 1 and 2, as shown in Eq. 3, where is the bth row of the projection matrix P1 or P2, a= [1, 2], b = [1, 2, 3].
An objective function was then proposed and optimized to calibrate the geometry parameters. The objective function containing 15 geometry parameters were created to minimize the following mismatch errors: (1) Euclidean distance between the artery bifurcations and the corresponding back projections of reconstructed 3D bifurcations on each image; (2) difference between the directional vectors defined by artery bifurcations and the corresponding back projections of reconstructed 3D bifurcations on each image. A nonlinear optimization algorithm, Levenberg-Marquardt,13 was used to optimize the objective function to obtain the calibrated geometry parameters.
Figure 2.
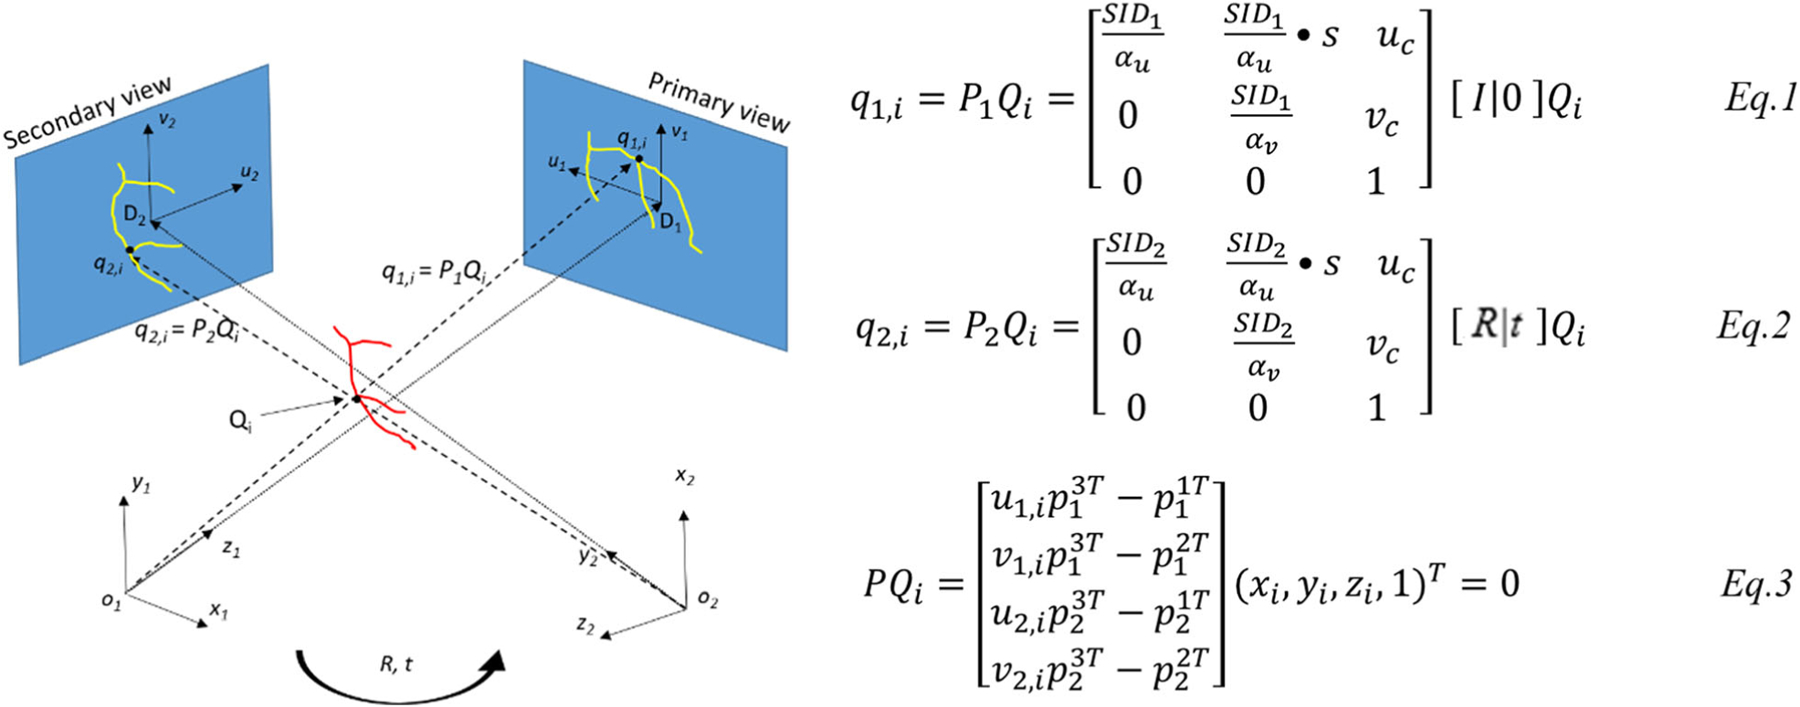
Mathematical model of the fluoroscopy angiography system. q1;i and q2;i are the projection points of a 3D arterial bifurcation on the primary and secondary planes. Rotation R and translation t establish the relationship of the primary and secondary coordinate systems. Eqs. 1, 2, and 3 denote the mathematic model.
Vessel points correspondence and 3D reconstruction.
With the calibrated parameters, an epipolar constraint-based method14 was used to pair the vessel centerline points on the primary and secondary images. Given a point on one of the images, there should be at least one corresponding point lying on the epipolar line on the other image. To avoid multiple correspondences, a dynamic programming-based method was used to find the optimal corresponding point. This method minimizes the error defined by the distance of the corresponding point from epipolar line. After establishing the correspondence of the centerline points on the primary and secondary images, 3D artery centerlines were then reconstructed using the mathematical model mentioned above, and then the artery surface was meshed with quadrangles to reconstruct 3D artery anatomy, as shown in Figure 1 D&H.
Evaluation of Artery Reconstruction
A computer simulation was implemented to evaluate the accuracy of the artery reconstruction algorithm. Fluoroscopy angiograms were simulated using GATE simulator15 and X-CAT phantom.16 A digital system of fluoroscopy angiography was created in GATE based on Philips system for human body. Fluoroscopy angiograms of left coronary arteries (LCA) from two regular views, LAO45°&CRA30° and RAO30°&CAU35°, were simulated. Two regular views of RCA, LAO1°&CRA29° and RAO33°&CAU5°, were simulated. All the simulated images have a pixel size of 0.34 × 0.34 mm2 and a resolution of 512 × 512.
With the simulated angiograms (Figure 3A, B, E, F), LCA and RCA centerlines were reconstructed using the proposed reconstruction algorithm. The 3D LCA and RCA centerlines from X-CAT phantoms were extracted using a 3D thinning algorithm.17 To evaluate the accuracy of 3D artery reconstruction, the mean distances between reconstructed centerlines and the corresponding phantom centerlines (ground truth) were paired and computed (Figure 3C, D, G, H).
Figure 3.
Computer simulation of fluoroscopy angiography (A, B, E, F) and comparison between reconstructed centerlines and the ground truth centerlines extracted from X-CAT phantom (C, D, G, H). (A) and (B) are simulated LCA fluoroscopy angiograms; (C) and (D) are the comparisons between reconstructed LCA artery centerlines (red lines) and ground truth(yellow lines); (E) and (F) are simulated RCA angiograms; (G) and (H) are the comparisons between RCA centerlines (red lines) and ground truth(yellow lines).
SPECT Image Processing
LV epicardial surface extraction from SPECT images
A graphical user interface was developed to identify LV parameters including LV center, apex, base, anterior and inferior grooves (Figure 4A). Once the parameters were determined, a dynamic programming-based (DP) algorithm18 was used to extract LV epicardial surface from SPECT images. This algorithm first transformed long-axis SPECT images from Cartesian to polar coordinates and then calculated the gradients of the polar image by the differences in horizontal and vertical directions. LV epicardial contour in the polar image was identified via searching for the maximal gradients with a preset constraint using a dynamic programming algorithm and thereafter transformed back to Cartesian coordinates. LV epicardial contour points were triangulated and then smoothed using a triangulation mesh smoothing algorithm.19 The surface was then rendered with myocardial perfusion data, as shown in Figure 4B. After extracting the LV epicardial surface, the anterior and inferior grooves were generated and used as landmarks for the initial alignment of 3D artery anatomy and LV epicardial surface.
Figure 4.

User interface to identify LV parameters and landmarks. (A) Identification of LV parameters. LV center, apex, and base were used to extract LV epicardial surface. Anterior and inferior grooves were used to generate landmarks for 3D fusion. (B) Extracted LV epicardial surface from SPECT images.
Evaluation of LV Surface Extraction
The accuracy of LV surface extraction was evaluated via a computer simulation. A digital Siemens ECAT system20,21 for the human body was built in GATE, and a heart phantom generated with X-CAT was loaded into the simulation system. Standard physics processes for nuclear imaging were included. With the simulated coincidence data, nuclear images were reconstructed with a voxel size of 3.2 × 3.2 × 3.2 mm3, as shown in Figure 5A.
Figure 5.

Simulated nuclear images and LV epicardial surface evaluation. (A) Simulated nuclear images using GATE; (B) manually extracted LV epicardial surface (ground truth); (C) LV epicardial surface extracted with DP-based approach; (D) sampling points comparison between (B) and (C).
The nuclear images were then processed using our DP-based approach to extract the LV epicardial surface (DP-LV surface), as shown in Figure 5C. For comparison, an experienced operator who was blinded from DP-LV surface manually extracted the LV epicardial surface (ME-LV surface) in Figure 5B. The sampling points of DP-LV and ME-LV surfaces were paired (Figure 5D). The mean distance of DP-LV surface from ME-LV (ground truth) surface was computed to evaluate the accuracy of the surface extraction.
Image Fusion
Fusion between 3D artery anatomy and SPECT LV epicardial surface
Three steps were implemented to complete the 3D fusion: (1) landmark-based initial alignment, (2) fine registration using S-ICP, and (3) vessel-surface overlay.
Landmark-based initial alignment.
According to the characteristics of coronary anatomy, left anterior descending artery (LAD) travels in the anterior interventricular groove, proximal left circumflex artery (LCX) travels in the left atrioventricular groove, and posterior descending artery (PDA) travels in the inferior interventricular groove. The grooves obtained from SPECT images (“LV epicardial surface extraction from SPECT images” section) were used as landmarks (as the white arrow shown in Figure 6A) to complete rough alignment of arteries and LV surface. A cost function was created by minimizing the sum of squared distance between the following three curve pairs: (a) between LAD and anterior interventricular groove, (b) between proximal LCX and LV base, (c) between PDA and inferior interventricular groove.
Figure 6.

Fusion of artery anatomy and LV epicardial surface. (A) Rough registration by landmarks (green line as illustrated as white arrow); (B) fine registration using S-ICP; (C) vessel overlay and vessel contour rendering.
S-ICP fine registration.
Based on the initial alignment, scaling iterative closest points algorithm (S-ICP)22 was implemented to refine the alignment. It introduced a scaling factor into standard ICP to form a quadric constraint optimization problem concerning a transformation with respect to scale S, rotation R, and translation t. Two steps were iteratively executed to solve this optimization problem. The first step was to create correspondences between LV epicardial sampling points and artery centerline points in current status, which is completed by a Delaunay triangulation-based algorithm.23 The second step was to optimize an objective function that minimizes the distance between artery centerline points and the corresponding epicardial sampling points. A singular value decomposition (SVD)-based method was used to optimize the objective function. Therefore, the transformation parameters were obtained until the iteration reaches a preset threshold. Figure 6B shows the result of S-ICP fine registration.
Vessel-surface overlay.
After the fine registration by the S-ICP algorithm, all the arteries were overlaid onto the SPECT LV epicardial surface using a vessel-surface overlay algorithm,5 and then artery contours were created using quadrangles as shown in Figure 6C.
Evaluation of the 3D fusion
The accuracy of the 3D fusion was evaluated using both computer simulation and real patient data.
Computer simulation.
The artery anatomies from simulated angiograms (“Evaluation of Artery Reconstruction” section) and DP-LV surface (“Evaluation of LV Surface Extraction” section) were fused using the 3D fusion approach. The LV epicardial surface extracted from the X-CAT phantom was manually registered with the DP-LV surface, and then the phantom arteries were overlaid onto the DP-LV surface. The mean distances of fluoroscopy arteries from phantom arteries (ground truth) were computed to technically evaluate the accuracy of the 3D fusion, as shown in Figure 7.
Figure 7.

Comparison between simulated fluoroscopy and phantom centerlines. (A) and (B) are artery centerlines and LV&RV epicardial surfaces extracted from X-CAT phantom. (C) and (D) are the simulated fluoroscopy artery centerlines (red lines) and ground truth from X-CAT phantom (yellow lines) overlaid on SPECT epicardial surface. Abbreviations are shown in Table 4.
Real patient data.
Fluoroscopy angiograms and SPECT images in 30 patients were integrated using the 3D fusion approach. Their CT angiograms were manually processed by experienced operators who were blinded from the fluoroscopy angiograms and SPECT images. They manually extracted major arteries and LV&RV epicardial surfaces on the CT angiograms using an open-source tool (3D slicer),24 and then registered the CT LV epicardial surface with SPECT epicardial surface via aligning the landmarks (LV base, frontier, and inferior grooves) on both epicardial surfaces. The transformation parameters of registration were also applied to the extracted CT arteries which travel on the LV epicardial surface, and therefore the CT arteries were closely aligned to the SPECT epicardial surface. The aligned CT arteries were overlaid onto the SPECT epicardial surface and regarded as the ground truth to evaluate the accuracy of the 3D fusion. Figure 8 is an example illustrating the comparison of the fluoroscopy and aligned CT arteries.
Figure 8.

Comparison of fluoroscopy and CT artery anatomy. (A) Coronary arteries (yellow lines) on the CT LV epicardial surface; (B) coronary arteries from CT and fluoroscopy angiograms (red lines) overlaid on the SPECT LV epicardial surface. The mean distance of fluoroscopy and CT arteries on the SPECT epicardial surface, as illustrated by the blue arrow, was used to evaluate the accuracy of the 3D fusion. Abbreviations are shown in Table 4.
Metrics to Evaluate the Accuracy of 3D Fusion.
Two metrics were used to evaluate the accuracy of 3D fusion. The first one is distance-based mismatch error between CT and fluoroscopy arteries on the SPECT LV epicardial surface. It stands for the mean distance between paired CT and fluoroscopy artery points, as the black line illustrated by the blue arrow in Figure 8. If the fluoroscopy and CT artery lengths were different, the distances were only computed for the paired points. The second metric is a segment-based Kappa agreement rate using the AHA 17-segment model. The segments that both fluoroscopy and artery arteries present were recorded and used to compute the Kappa agreement rate.
RESULTS
Accuracy of Artery Reconstruction
Table 2 lists the mean distances between simulated fluoroscopy and phantom arteries (ground truth). In LCA system, a total of 368 fluoroscopy-phantom artery point pairs were evaluated with an overall mismatch error of 1.67 ± 1.07 mm (min: 0.13, max: 4.85). In RCA system, a total of 392 point pairs were evaluated with an overall mismatch error of 1.22 ± 1.06 mm (min: 0, max: 8.12).
Table 2.
Mean distances between simulated fluoroscopy arteries and phantom arteries (ground truth)
| Point pairs | Mean ± SD (mm) | Minimum | Maximum | |
|---|---|---|---|---|
| LCA system | ||||
| LMA | 11 | 1.97 ± 0.52 | 0.65 | 2.50 |
| LAD | 163 | 2.32 ± 1.14 | 0.22 | 4.85 |
| D1 | 34 | 1.99 ± 0.65 | 0.32 | 2.78 |
| LCX | 160 | 0.93 ± 0.43 | 0.13 | 2.08 |
| Overall | 368 | 1.67 ± 1.07 | 0.13 | 4.85 |
| RCA system | ||||
| RCA | 157 | 1.94 ± 1.68 | 0.17 | 8.12 |
| RMA | 93 | 0.27 ± 0.40 | 0 | 2.02 |
| PDA | 142 | 0.27 ± 0.43 | 0 | 1.99 |
| Overall | 392 | 1.22 ± 1.06 | 0 | 8.12 |
Abbreviations are shown in Table 4
Accuracy of LV Surface Extraction
A total of 4200 DP-ME-LV sampling point pairs were evaluated. The mean distance between DP-LV and ME-LV surfaces (ground truth) was 2.82 ± 1.53 mm (min: 0.02, max: 14.5), which is smaller than the pixel size of the simulated nuclear image (3.2 mm).
Accuracy of 3D Fusion
In the technical evaluation with computer simulation, Table 3 lists the distance-based mismatch errors between simulated fluoroscopy and phantom arteries (ground truth) after registered and overlaid on the DP-LV surface. In the LCA system, the overall mismatch error is 1.86 ± 1.43 mm (min: 0.04, max: 6.87). In the RCA system, due to the absence of posterolateral branch (PLB), only PDA was evaluated. PDA had a mismatch error of 2.21 ± 2.25 mm (min: 0.05, max: 10.74).
Table 3.
Distance-based mismatch errors between simulated fluoroscopy arteries and phantom arteries (ground truth) on the simulation LV surface
| Point pairs | Mean ± SD(mm) | Minimum | Maximum | |
|---|---|---|---|---|
| LCA system | ||||
| LMA | 11 | 3.47 ± 2.17 | 0.72 | 6.85 |
| LAD | 163 | 2.30 ± 1.74 | 0.04 | 6.87 |
| D1 | 34 | 2.48 ± 0.42 | 1.67 | 3.27 |
| LCX | 160 | 1.18 ± 0.61 | 0.04 | 3.15 |
| Overall | 368 | 1.86 ± 1.43 | 0.04 | 6.87 |
| RCA system | ||||
| PDA | 104 | 2.21 ± 2.50 | 0.05 | 10.74 |
Abbreviations are shown in Table 4
In the clinical validation, Table 4 lists the distance-based mismatch errors between fluoroscopy and CT arteries on the SPECT surface in 30 patients’ data. In the LCA system, the overall mismatch error was 3.84 ± 3.15 mm (min: 0, max: 20.46). In the RCA system, the overall mismatch error was 5.55 ± 3.64 mm (min: 0.11, max: 24.25). Moreover, Table 5 lists the segment-based mismatch error between fluoroscopy and CT arteries on the SPECT surface. In the LCA system, the overall Kappa agreement rate was 0.91 (CI 0.89–0.93). In the RCA system, the overall Kappa agreement rate was 0.80 (CI 0.67–0.92).
Table 4.
Distance-based mismatch errors between fluoroscopy arteries and CT arteries (ground truth) on SPECT LV epicardial surface
| Point pairs | Mean ± SD(mm) | Minimum | Maximum | |
|---|---|---|---|---|
| LCA system | ||||
| LMA | 545 | 4.91 ± 2.65 | 0.33 | 10.46 |
| LAD | 9005 | 3.52 ± 2.80 | 0 | 19.41 |
| RI | 1104 | 3.12 ± 2.54 | 0.03 | 18.39 |
| D1 | 3608 | 3.43 ± 2.95 | 0 | 20.46 |
| D1_b1 | 132 | 3.78 ± 3.40 | 0.07 | 11.73 |
| D2 | 1696 | 3.58 ± 3.13 | 0.01 | 13.65 |
| D3 | 264 | 5.70 ± 2.13 | 0.12 | 9.05 |
| SEP1 | 130 | 5.17 ± 2.02 | 3.20 | 12.71 |
| LCX | 6192 | 4.72 ± 3.40 | 0 | 18.86 |
| OM1 | 2029 | 3.06 ± 2.42 | 0 | 9.61 |
| OM2 | 1926 | 3.69 ± 2.76 | 0 | 16.97 |
| OM3 | 965 | 4.81 ± 3.12 | 0.02 | 20.25 |
| OM4 | 156 | 3.88 ± 2.80 | 0.09 | 9.81 |
| Overall | 27,752 | 3.84 ± 3.15 | 0 | 20.46 |
| RCA system | ||||
| PDA | 855 | 5.90 ± 3.92 | 1.02 | 24.25 |
| PLB | 574 | 4.83 ± 2.89 | 0.01 | 21.66 |
| PLB_b1 | 152 | 7.80 ± 2.84 | 2.69 | 13.52 |
| Overall | 1581 | 5.55 ± 3.64 | 0.11 | 24.25 |
LMA, left main artery; LAD, left anterior descending; RI, ramus intermedius artery; D1, the first diagonal artery; D1_b1, branch of the first diagonal artery, D2, the second diagonal artery; D3, the third diagonal artery; SEP1, the first septal perforator artery; LCX, left circumflex; OM1, the first obtuse marginal artery; OM2, the second obtuse marginal artery; OM3, the third obtuse marginal artery; OM4, the fourth obtuse marginal artery; PDA, posterior descending artery; PLB, posterolateral branch artery; PLB_1, the first branch of posterolateral branch artery
Table 5.
Segment-based mismatch errors between the fluoroscopy arteries and CT arteries (ground truth) on the SPECT LV epicardial surface
| LCA system | CT-Y | CT-N | LCA system | CT-Y | CT-N | ||
|---|---|---|---|---|---|---|---|
| LAD | Fluoro-Y | 115 | 12 | SEP1 | Fluoro-Y | 5 | 0 |
| Fluoro-N | 12 | 371 | Fluoro-N | 0 | 29 | ||
| Kappa (95%CI) | 0.87 (0.83–0.92) | Kappa (95%CI) | 1.00 (1.00–1.00) | ||||
| RI | Fluoro-Y | 13 | 1 | LCX | Fluoro-Y | 92 | 7 |
| Fluoro-N | 1 | 138 | Fluoro-N | 7 | 404 | ||
| Kappa (95%CI) | 0.92 (0.81–1.03) | Kappa (95%CI) | 0.91 (0.87–0.96) | ||||
| D1 | Fluoro-Y | 55 | 5 | OM1 | Fluoro-Y | 29 | 1 |
| Fluoro-N | 5 | 394 | Fluoro-N | 1 | 275 | ||
| Kappa (95%CI) | 0.92 (0.87–0.98) | Kappa (95%CI) | 0.96 (0.91–1.01) | ||||
| D1_b1 | Fluoro-Y | 5 | 0 | OM2 | Fluoro-Y | 24 | 2 |
| Fluoro-N | 0 | 29 | Fluoro-N | 2 | 210 | ||
| Kappa (95%CI) | 1.00 (1.00–1.00) | Kappa (95%CI) | 0.91 (0.83–1.00) | ||||
| D2 | Fluoro-Y | 28 | 3 | OM3 | Fluoro-Y | 14 | 1 |
| Fluoro-N | 3 | 205 | Fluoro-N | 1 | 120 | ||
| Kappa (95%CI) | 0.91 (0.82–0.99) | Kappa (95%CI) | 0.93 (0.82–1.02) | ||||
| D3 | Fluoro-Y | 4 | 0 | OM4 | Fluoro-Y | 2 | 0 |
| Fluoro-N | 0 | 30 | Fluoro-N | 0 | 15 | ||
| Kappa (95%CI) | 1.00 (1.00–1.00) | Kappa (95%CI) | 1.00 (1.00–1.00) | ||||
| CT-Y | CT-N | ||||||
| LCA Overall | Fluoro-Y | 386 | 30 | ||||
| Fluoro-N | 31 | 2222 | |||||
| Kappa (95%CI) | 0.91 (0.89–0.93) | ||||||
| RCA system | CT-Y | CT-N | RCA system | CT-Y | CT-N | ||
|
| |||||||
| PDA | Fluoro-Y | 11 | 3 | PLB_b1 | Fluoro-Y | 3 | 1 |
| Fluoro-N | 3 | 119 | Fluoro-N | 1 | 63 | ||
| Kappa (95%CI) | 0.76 (0.57–0.95) | Kappa (95%CI) | 0.73 (0.37–1.10) | ||||
| PLB | Fluoro-Y | 7 | 2 | ||||
| Fluoro-N | 2 | 108 | |||||
| Kappa (95%CI) | 0.88 (0.71–1.05) | ||||||
| CT-Y | CT-N | ||||||
| RCA Overall | Fluoro-Y | 22 | 5 | ||||
| Fluoro-N | 5 | 291 | |||||
| Kappa (95%CI) | 0.80 (0.67–0.92) | ||||||
CI, confidence interval; CT-N, total number of segments without CT arteries; CT-Y, total number of segments with CT arteries; Fluoro-N, total number of segments without fluoroscopy arteries; Fluoro-Y, total number of segments with fluoroscopy arteries; other abbreviations as in Table 4
Processing Time
All the images were processed with a personal computer: Core I5 CPU (2.8 GHz), 8 GB memory, and Microsoft Windows 10 operating system. In fluoroscopy angiogram processing, the artery extraction required ~ 5 s for each image after loading the deep learning model into the system memory and the 3D artery reconstruction consumed approximately 13 ± 4 s. In the SPECT image processing, the LV epicardial surface extraction required 6 ± 3 s. The 3D fusion between them consumed 7 ± 2 s.
The interactive identification of artery centerlines on the fluoroscopy angiograms was approximately 4 minutes, which is the time barrier.
DISCUSSIONS
The primary objective of this study was to develop and validate an approach that integrates 3D fluoroscopy artery anatomy with SPECT LV epicardial surface to guide PCI decision-making. The 3D fusion approach showed high accuracy in technical evaluation with computer simulation. Besides, in clinical evaluation with 30 real patients’ data, 3D fusion had mismatch errors of 3.84 ± 3.15 mm for LCA and 5.55 ± 3.64 mm for RCA, which is much smaller than the segment size of the AHA 17-segment model (~ 30 × 30 mm2); the Kappa test showed good agreement rates of the fluoroscopy and CT artery locations on the SPECT epicardial surface: 0.91 for LCA, 0.80 for RCA. Accordingly, the 3D fusion approach showed clinical feasibility to integrate fluoroscopy angiography and SPECT-MPI for guiding revascularization decision-making.
Clinical Significance of 3D Fusion
SPECT-MPI stress testing is considered a “gatekeeper” prior to invasive angiography and/or PCI in patients with stable CAD. Commonly, revascularization is determined based on visual assessment of a coronary vessel taken in context with perfusion abnormalities described in a written report. Several studies have demonstrated that SPECT-guided PCI improves morbidity compared to anatomic assessment or medical therapy alone.25,26
However, SPECT-MPI guided revascularization without fusion is suboptimal. First, the specificity of SPECT-MPI is limited by attenuation artifacts. Second, standard polar map distorts the size, shape, and locations of perfusion defects.27 Third, vascular territories often overlap and do not necessarily follow standard ascribed distributions. Fourth, although human coronary anatomy is generally similar, each patient’s coronary tree is unique with variations of branch vessels and dominance. These limitations lead to 50–60% mismatches between standard segment-based myocardial perfusion territories and the distribution of patient-specific anatomic coronary trees.28 Finally, in patients with multivessel disease, SPECT-MPI may not demonstrate perfusion abnormalities in each significant vessel. All these factors decrease the diagnostic sensitivity and specificity and in turn, reduce the utility of SPECT-guided revascularization in clinical practice.
Despite the challenges with SPECT-MPI, our data clearly demonstrates the feasibility of real-time 3D fusion of SPECT-MPI and fluoroscopic coronary angiography, which offers an opportunity to improve revascularization decisions and outcomes. Further studies will be required to gauge the potential impact of fusion vs. standard of care for clinical decisions.
Fusion Techniques of Coronary Vessel Anatomy and LV Epicardial Surface
Over the past decade, several fusion techniques for coronary vessels (arteries or veins) and LV surface were developed and validated. These techniques are in three categories: (1) Landmark-based methods. Zhou et al.4 and Faber et al.3 proposed landmark-based methods to integrate LV epicardial surface with 3D coronary vessel anatomy. In both studies, the landmark-based method can only align the major landmark points, however, the branches and extensions of the major vessels may not be accurately aligned. (2) Rigid ICP methods. Babic et al.29 and Toth et al.6 used standard ICP or Go-ICP to fuse LV epicardial surface with coronary vessel trees. Although these two studies completed the fusion by taking advantage of all the vessel points rather than only landmark points, these fusions are rigid transformation and may fail when two models have scale mismatches caused by the separate image acquisitions at different time points of cardiac beating. Therefore, a non-rigid registration has important advantages. (3) Deep learning-based methods. Toth et al.30 used the imitation learning method to register 2D coronary vessels with 2D projection of CT epicardial surface. Due to the complex overlaps of vessels on 2D coronary angiograms, doctors prefer a 3D artery anatomy fusion with LV surface to better exhibit the stenosis of arteries from any views.
The S-ICP algorithm in our study non-rigidly registered 3D coronary artery anatomy with SPECT epicardial surface when scale mismatches existed between them. S-ICP adjusted the scale of 3D artery anatomy up to or down to the optimal scale and then registered it with the SPECT epicardial surface for higher fusion accuracy, which enhances the clinical applicability of 3D fusion. The small distance-based mismatch error and high Kappa agreement rate between fluoroscopy and CT arteries affirmed the accuracy of the 3D fusion approach.
Clinical Applicability
Two essential factors may affect the applicability of the 3D fusion technique. First, for 3D artery reconstruction, the spatial angle gap between the primary and secondary projection views preferably ranges from 45 to 145°. LCA and RCA angiography usually meets this condition from standard views. Second, clear interventricular groove landmarks on the short-axis image (Figure 4A) are needed for the initial registration of 3D fusion. Fortunately, these landmarks constantly exist and can be identified for most of the enrolled 30 CAD patients.
Two interactive operations, artery centerline identification on fluoroscopy angiograms and landmark selection on short-axis images, may affect the reproducibility of the 3D fusion approach differently. In the first operation, based on the artery contour from the deep learning model, the extracted centerline segments are usually clear except those with overlaps on angiograms. Manual selection for the clear segments maintains relatively high consistency, which barely impacts the reproducibility. For the centerline segments with complicated overlaps, manually drawn segments for correction vary among operators; however, the reproducibility can still be well guaranteed because (1) overlap is relatively limited compared to the entire artery tree, (2) experienced operators can distinguish the overlaps through observing dynamic cine of coronary arteries from different views, and (3) centerline points from the primary and secondary views that meet epipolar geometry constraints are paired in the 3D artery reconstruction, whereas the incorrectly drawn centerline points by the operators will not be paired. In the operation of landmark selection, a small number of CAD patients who show blurry interventricular grooves on short-axis images, the identification of landmarks among operators may be different. In the 3D fusion approach, the landmarks are used to initialize the S-ICP registration. As mentioned above, S-ICP registers all artery centerlines rather than landmarks with LV surface based on their morphological features. Therefore, the variation in landmarks identification among operators barely impacts final registration.
The clinical validation with the 30 patients confirmed the applicability of the 3D fusion technique. The overall small distance-based mismatch error and high Kappa agreement rate ensure the accuracy of the 3D fusion. The average processing time of 5 mins is short compared to the procedural time of PCI (approximately 60 minutes), which guarantees the feasibility of this technique.
Limitations
First, the technical accuracy and clinical feasibility of the 3D fusion approach were tested in a relatively small sample size. Prospective validation in a large population with a control group is needed to establish the clinical usefulness of the technique. Second, the diameters of reconstructed arteries were not quantitatively evaluated. A quantitative assessment is needed to further evaluate the artery diameters. Third, the interactive operations affect the reproducibility of the 3D fusion approach, especially the arteries with complicated overlaps. An improved semantic artery extraction is needed to enhance the reproducibility for broader clinical applications. Finally, stress testing (not necessarily SPECT-MPI) prior to FA is a Class IIa indication in patients with symptomatic suspected CAD. As such, if patients have not had a SPECT-MPI prior to FA, an additional SPECT with associated additional radiation and cost would be necessary for fusion.
NEW KNOWLEDGE GAINED
A novel technique, which maintains anatomic accuracy, for reconstructing 2D fluoroscopic angiography data into 3D datasets has been developed. The 3D angiographic datasets can accurately and quickly be fused with MPI datasets.
CONCLUSIONS
The developed fusion approach is technically accurate to guide revascularization decision-making and clinically feasible to be used in the catheterization laboratory. Future studies are necessary to determine if fusion improves PCI-related outcomes.
Supplementary Material
Acknowledgment
This research was supported by a Grant from The American Heart Association (Project Number: 17AIREA33700016, PI: Weihua Zhou), a Grant from Ochsner Hospital Foundation (PI: Weihua Zhou), and a new faculty Grant from Michigan Technological University Institute of Computing and Cybersystems (PI: Weihua Zhou). Besides, Shenzhen Raysight Intelligent Medical Technology, Ltd. provided technical support for the centerline extraction of coronary arteries from CT angiograms.
Abbreviations
- CAD
Coronary artery disease
- FA
Fluoroscopy angiography
- LV
Left ventricle
- LCA
Left coronary arteries
- LAD
Left anterior descending
- MPI
Myocardial perfusion imaging
- PCI
Percutaneous coronary intervention
- RCA
Right coronary arteries
- SPECT
Single-photon emission computed tomography
- S-ICP
Scaling iterative closest points
Footnotes
Supplementary Information The online version contains supplementary material available at https://doi.org/10.1007/s12350-021-02574-1.
The authors of this article have provided a PowerPointfile, available for download at SpringerLink, which summarises thecontents of the paper and is free for re-use at meetings andpresentations. Search for the article DOI on SpringerLink.com.
Disclosures
None of the authors have any conflicts of interest to disclose.
References
- 1.Boden WE, O’Rourke RA, Teo KK, Hartigan PM, Maron DJ, Kostuk WJ, et al. Optimal medical therapy with or without PCI for stable coronary disease. N Engl J Med. 2007;356:1503–16. [DOI] [PubMed] [Google Scholar]
- 2.Maron DJ, Hochman JS, Reynolds HR, Bangalore S, O’Brien SM, Boden WE, et al. Initial Invasive or Conservative Strategy for Stable Coronary Disease. N Engl J Med. 2020;382:1395–407. [DOI] [PMC free article] [PubMed] [Google Scholar]
- 3.Faber TL, Klein JL, Folks RD, Hoff JG, Peifer JW, Malveaux EJ, et al. Automatic unification of three-dimensional cardiac perfusion with three-dimensional coronary artery anatomy. Computers in Cardiology; 1996. IEEE; p. 333–36. [Google Scholar]
- 4.Zhou W, Hou X, Piccinelli M, Tang X, Tang L, Cao K, et al. 3D fusion of LV venous anatomy on fluoroscopy venograms with epicardial surface on SPECT myocardial perfusion images for guiding CRT LV lead placement. J Am Coll Cardiol Img. 2014;7:1239–48. [DOI] [PubMed] [Google Scholar]
- 5.Faber TL, Santana CA, Garcia EV, Candell-Riera J, Folks RD, Peifer JW, et al. Three-dimensional fusion of coronary arteries with myocardial perfusion distributions: clinical validation. J Nucl Med. 2004;45:745–53. [PubMed] [Google Scholar]
- 6.Toth D, Panayiotou M, Brost A, Behar JM, Rinaldi CA, Rhode KS, et al. 3D/2D Registration with superabundant vessel reconstruction for cardiac resynchronization therapy. Med Image Anal. 2017;42:160–72. [DOI] [PubMed] [Google Scholar]
- 7.Zhao C, Tang H, Tang J, Zhang C, He Z, Wang Y-P, et al. Semantic segmentation to extract coronary arteries in fluoroscopy angiograms. medRxiv. 2020. 10.1101/2020.05.26.20103440. [DOI] [Google Scholar]
- 8.Zhou Z, Siddiquee MMR, Tajbakhsh N, Liang J. UNet ++: redesigning skip connections to exploit multiscale features in image segmentation. IEEE Trans Med Imaging. 2020;39:1856–67. [DOI] [PMC free article] [PubMed] [Google Scholar]
- 9.Lee TC, Kashyap RL, Chu CN. Building skeleton models via 3-D medial surface axis thinning algorithms. CVGIP Graph Model Image Process. 1994;56:462–78. [Google Scholar]
- 10.Kerschnitzki M, Kollmannsberger P, Burghammer M, Duda GN, Weinkamer R, Wagermaier W, et al. Architecture of the osteocyte network correlates with bone material quality. J Bone Miner Res J Bone Miner Res. 2013;28:1837–45. [DOI] [PubMed] [Google Scholar]
- 11.Kovesi PD. MATLAB and Octave functions for computer vision and image processing. Australia: School of Earth and Environment, The University of Western Australia, Centre for Exploration Targeting; 2000. p. 230. [Google Scholar]
- 12.Yang J, Wang Y, Liu Y, Tang S, Chen W. Novel approach for 3-D reconstruction of coronary arteries from two uncalibrated angiographic images. IEEE Trans Image Process. 2009;18:1563–72. [DOI] [PubMed] [Google Scholar]
- 13.Press WH. Numerical recipes: the art of scientific computing. Cambridge: Cambridge University Press; 2007. [Google Scholar]
- 14.Delaere D, Smets C, Suetens P, Marchal G, Van de Werf F. Knowledge-based system for the three-dimensional reconstruction of blood vessels from two angiographic projections. Med Biol Eng Comput. 1991;29:NS27–36. [DOI] [PubMed] [Google Scholar]
- 15.GATE. http://www.opengatecollaboration.org/ (17 April 2020) [Google Scholar]
- 16.4D Extended Cardiac-Torso (XCAT) Phantom Version 2.0 – Duke OLV. https://olv.duke.edu/technologies/4d-extended-cardiac-torso-xcat-phantom-version-2-0/ (17 April 2020) [Google Scholar]
- 17.Kollmannsberger P Skeleton3D - File Exchange - MATLAB Central. https://de.mathworks.com/matlabcentral/fileexchange/43400-skeleton3d (12 April 2020) [Google Scholar]
- 18.Tang S, Huang J, Hung G, Tsai S, Wang C, Li DF, et al. Dynamic programming-based automatic myocardial quantification from the gated SPECT myocardial perfusion imaging – fully 3D 2017 Proceedings, p. 462–67. [Google Scholar]
- 19.Kroon DJ. Smooth triangulated mesh (https://www.mathworks.com/matlabcentral/fileexchange/26710-smooth-triangulated-mesh), MATLAB Central File Exchange. Retrieved June 15, 2020. [Google Scholar]
- 20.Wienhard K, Dahlbom M, Eriksson L, Michel C, Bruckbauer T, Pietrzyk U, et al. The ec at exact hr: Performance of a new high resolution positron scanner. J Comput Assist Tomogr. 1994;18:110–8. [PubMed] [Google Scholar]
- 21.Jan S, Comtat C, Strul D, Santin G, Trébossen R. Monte Carlo simulation for the ECAT EXACT HR ? system using GATE. IEEE Trans Nucl Sci. 2005;52:627–33. [Google Scholar]
- 22.Tang H, Bober RM, Zhang C, He Z, Zou J, Zhou W. Scale ratio ICP for 3D registration of coronary venous anatomy with left ventricular epicardial surface to guide CRT lead placement. SPIE Med Imaging; 2019. p. 75. [Google Scholar]
- 23.Nearest point search - MATLAB dsearchn - MathWorks Deutschland. https://de.mathworks.com/help/matlab/ref/dsearchn.html (23 April 2020) [Google Scholar]
- 24.3D Slicer. https://www.slicer.org/ (13 April 2020) [Google Scholar]
- 25.Sharir T, Hollander I, Hemo B, Tsamir J, Yefremov N, Bojko A, et al. Survival benefit of coronary revascularization after myocardial perfusion SPECT: The role of ischemia. J Nucl Cardiol. 2019. 10.1007/s12350-019-01932-4. [DOI] [PubMed] [Google Scholar]
- 26.Yandrapalli S, Malik A, Jain D. SPECT myocardial perfusion imaging-based ischemia-guided early coronary revascularization improves survival: More fuel to the fire. J. Nucl. Cardiol; 2019. Dec 19. 10.1007/s12350-019-02006-1 [DOI] [PubMed] [Google Scholar]
- 27.Nakagawa Y, Nakagawa K, Sdringola S, Mullani N, Gould KL. A precise, three-dimensional atlas of myocardial perfusion correlated with coronary arteriographic anatomy. J Nucl Cardiol. 2001;8:580–90. [DOI] [PubMed] [Google Scholar]
- 28.Schindler TH, Magosaki N, Jeserich M, Oser U, Krause T, Fischer R, et al. Fusion imaging: combined visualization of 3D reconstructed coronary artery tree and 3D myocardial scintigraphic image in coronary artery disease. Int J Card Imaging. 1999;15:357–68. [DOI] [PubMed] [Google Scholar]
- 29.Babic A, Odland HH, Olivier G, Innovation C, Ultrasound GEV, Blindern POB. Left-ventricle to coronary venous tree 3D fusion for cardiac resynchronization therapy applications. IEEE ISBI; 2017;164–168. [Google Scholar]
- 30.Toth D, Miao S, Kurzendorfer T, Rinaldi CA, Liao R, Mansi T, et al. 3D/2D model-to-image registration by imitation learning for cardiac procedures. Int J Comput Assist Radiol Surg. 2018;13:1141–9. [DOI] [PMC free article] [PubMed] [Google Scholar]
Associated Data
This section collects any data citations, data availability statements, or supplementary materials included in this article.