

Abstract
We investigated the effects of interannual El Niño Southern Oscillation (ENSO) events on local weather, Ae. aegypti populations, and combined cases of dengue (DENV), chikungunya (CHIKV), and Zika (ZIKV) viruses in two communities with mass mosquito trapping and two communities without mosquito control in southern Puerto Rico (2013–2019). Gravid adult Ae. aegypti populations were monitored weekly using Autocidal Gravid Ovitraps (AGO traps). Managing Ae. aegypti populations was done using three AGO traps per home in most homes. There were drought conditions in 2014–2015 concurrent with the emergence of a strong El Niño (2014–2016), wetter conditions during La Niña (2016–2018), a major hurricane (2017), and a weaker El Niño (2018–2019). The main factor explaining differences in Ae. aegypti abundance across sites was mass trapping. Populations of Ae. aegypti reached maximum seasonal values during the wetter and warmer months of the year when arbovirus epidemics occurred. El Niño was significantly associated with severe droughts that did not impact the populations of Ae. aegypti. Arbovirus cases at the municipality level were positively correlated with lagged values (5–12 mo.) of the Oceanic El Niño Index (ONI), droughts, and abundance of Ae. aegypti. The onset of strong El Niño conditions in Puerto Rico may be useful as an early warning signal for arboviral epidemics in areas where the abundance of Ae. aegypti exceeds the mosquito density threshold value.
Keywords: ENSO, El Niño, Aedes aegypti, dengue, chikungunya, Zika
Mosquitoes and the pathogens they transmit are known to be influenced by seasonal changes in landscape and weather, such as vegetation, temperature, rainfall, and humidity (Gubler et al. 2001; Barrera 2010; Morin et al. 2013; Anyamba et al. 2019). Local weather affecting transmission cycles may depart from average conditions every few years, depending on interannual climate variability such as El Niño-Southern Oscillation events (ENSO) (Kovats et al. 2003). Warm ENSO events are characterized by anomalous, semi-periodic (2–7 years) increases in sea surface temperature in the eastern Pacific (El Niño) that tend to peak between November and January (Philander 1983). The interactions between oceanic (El Niño) and atmospheric systems (Southern Oscillation) propagate temporal climate change effects in the form of atypical regional temperature or precipitation changes throughout the globe (teleconnections; Ropelewski and Halpert 1987). Those climate effects can vary depending on geographical location. For example, El Niño is associated with higher-than-normal precipitation in the southeastern Unites States and southeastern South America but brings drier-than-normal conditions to northeastern South America. Warm ENSO events in the Caribbean bring drier conditions during the year it develops (boreal summer) but wetter conditions during the following spring (Ropelewski and Halpert 1987). The opposite phase of El Niño, La Niña brings cooler and wetter conditions associated with increased occurrence of tropical storms and hurricanes in the Atlantic (Pielke and Landsea 1999). Thus, the warm phase of ENSO (El Niño) can bring above average drier or wetter or conditions depending on location, and the cool phase of ENSO (La Niña) that frequently follows El Niño, has an opposite effect. These contrasting effects can be better understood by observing what local impacts each ENSO phase has on local weather.
ENSO events have been associated with periodic epidemics of mosquito-borne pathogens that cause dengue, malaria, and Rift Valley fever (Kovats et al. 2003; Stewart-Ibarra and Lowe 2013; Anyamba et al. 2001). Epidemics of malaria in various countries and Rift Valley fever in East Africa seem to be favored by above average rainfall associated with strong ENSO events that generate many extensive aquatic habitats where mosquito vectors undergo immature development (Anyamba et al. 2019). In southern California, populations of the nuisance mosquito Culiseta incidens (Thomson) and the West Nile virus vector Culex tarsalis Coquillett significantly increased following above normal warmer and wetter conditions during the ENSO 1997–1998 (Heft and Walton. 2008). Depending on the phase of ENSO conditions at given localities, populations of ground water mosquitoes may also be adversely affected. For example, a drought associated with La Niña phase of the ENSO 2016–2017 event in Tanzania drastically reduced the populations of Anopheles arabiensis Patton and An. funestus Giles (Kreppel et al. 2019). In Kalutara District, Sri Lanka where Aedes albopictus (Skuse) is the main dengue vector, El Niño conditions that brought warmer and wetter weather were correlated with increased dengue cases and immature mosquito indices (Liyanage et al. 2016, 2022). These authors suggested that Ae. albopictus should be more directly impacted by rainfall increases than Ae. aegypti (L.) because the latter species is mainly associated with human habitation.
ENSO-related epidemics of dengue and other arboviruses such as chikungunya and Zika viruses have also been associated with strong ENSO events, but in this case such events were associated with warmer and drier conditions (Gagnon et al. 2001; Anyamba et al. 2019). How warmer and drier weather conditions associated with ENSO influence the population dynamics of Aedes aegypti, and in turn, dengue virus transmission is not well understood. Under these conditions Ae. aegypti, the main mosquito vector of dengue viruses should experience reductions in its population because they undergo immature development in rain-filled natural and artificial containers around homes. However, because of the domestic nature of Ae. aegypti, its population dynamics are quite often also influenced by human activity, whereby water is added to containers such as water storage vessels, animal drinking pans, and a variety of other containers such as plant trivets and rooting plants in water (Barrera et al. 2006; 2011). Thus, it is likely that the domestic populations of Ae. aegypti could increase during drought conditions in areas where people store water.
Previous analyses of ENSO and dengue in the Caribbean have shown a stronger correlation of dengue epidemics with inter-annual above-average temperature than rainfall (Amarakoon et al. 2007; Jury 2008). Above-average, non-lethal temperature (> 27°C and < 37°C; Rueda et al. 1990; Carrington et al. 2013) speeds up the development of immature Ae. aegypti, promoting a greater rate of population increase, as well as other aspects of the mosquito physiology such as increased frequency of blood meal uptakes, reduced duration of gonotrophic cycles, and reduced extrinsic incubation periods of arboviruses (Tun-Lin et al. 2000; Morin et al. 2013). All these processes should contribute to increased arboviral transmission, including possible interactions of temperature, rainfall, and relative humidity. For example, a study in Taiwan (Tran et al. 2020) showed significant increases in a prevalence index of Ae. aegypti with temperature, and that the effects of rainfall and relative humidity on the index were more important when temperature was above certain thresholds.
The purpose of this study was to analyze a time series of female Ae. aegypti captured in Autocidal Gravid Ovitraps (AGO traps, Mackay et al. 2013) in two managed and two unmanaged mosquito populations in southern Puerto Rico from 2013–2019. The objective was to explore how intra- and inter-annual changes in weather affected mosquito abundance. Interannual climate events during this study in Puerto Rico were drought conditions in 2014–2015 resulting from the emergence of a strong El Niño event in 2014–2016, La Niña conditions from August 2016-April 2018, a major hurricane in 2017, and another although weaker El Niño event from September 2018–June 2019. During that period, Puerto Rico experienced epidemics of dengue (2013), chikungunya (2014–15), and Zika (2016–17; Adams et al. 2019). Dengue transmission in Puerto Rico had an unprecedented declined in 2014 until it resurfaced at the end of 2019.
This study provides the opportunity to examine how inter-annual climate variability may impact domestic populations of Ae. aegypti that were managed by applying sustained, area-wide mass trapping. We previously reported on the effectiveness of mass trapping with sticky gravid ovitraps on reductions of Ae. aegypti populations and arbovirus prevalence in both mosquitoes and people (Barrera et al. 2014a, b; 2017, 2019a; Sharp et al. 2019). Data from 2014 and 2016 during the outbreaks of chikungunya and Zika viruses, respectively were previously analyzed to compare mosquito densities, weather, and infection rates of Ae. aegypti (Barrera et al. 2019a). Results from these studies showed that the densities of Ae. aegypti per trap per week in unmanaged sites were significantly greater than in managed sites (Barrera et al. 2019a). Although 2016 was a wetter year (30–43 mm/week) than 2014 (16–32 mm/week), there were no significant changes in the Ae. aegypti populations or in infection rates with chikungunya (1.75–2.48 per thousand) or Zika (1.20–2.06 per thousand) viruses. However, vector index values (proportion of infected mosquitoes x mosquito abundance) for chikungunya (24–43) or Zika (13–42) virus in managed sites were greater than in unmanaged sites for both chikungunya (2–3) or Zika (0–3) (Barrera et al. 2019a). We also reported on the impact of category four hurricanes Irma and Maria that hit Puerto Rico in September 2017 on Ae. aegypti populations and arbovirus circulation in the study areas. These results showed heterogeneity of impacts on Ae. aegypti density in unmanaged study sites, limited effects in managed sites, and absence of arboviruses in Ae. aegypti before and after the hurricanes in 2017 (Barrera et al. 2019b). This study expands published knowledge by examining long term trends in mosquito populations and the impact of climate in managed and unmanaged scenarios.
Material and Methods
Study area.
The study sites were lowland (3–20 m elevation) residential neighborhoods in adjacent Salinas and Guayama municipalities in southern Puerto Rico (Fig. 1): Arboleda (AR; 17° 58’ 46” N; 66° 17’ 23” W; 398 buildings); La Margarita (LM; 17° 58’ 18” N; 66° 18’ 10” W; 327 buildings), Playa (PL; 17° 57’ 59” N; 66° 18’ 10” W; 269 buildings), and Villodas (VI; 17° 58’ 13” N; 66° 10’ 48”W; 241 buildings). Most buildings were one-story houses with adequate public services (piped water supply, domestic garbage pickup, sewerage), although sewerage was more recently built in PL where some septic tanks remained. Arboleda and La Margarita communities had higher median property values, higher proportion of residents with high school diplomas, and lower levels of poverty, revealing higher socioeconomic status than Playa and Villodas (Hemme et al. 2021). Meteorological stations (HOBO Data Loggers, Onset Computer Corporation, Bourne, MA) were placed and monitored in the center of LM, AR, and VI to record daily rainfall (mm), temperature (° C), and relative humidity (%) throughout the study. The LM’s meteorological data were used to represent weather in PL because both communities were next to each other.
Figure 1.
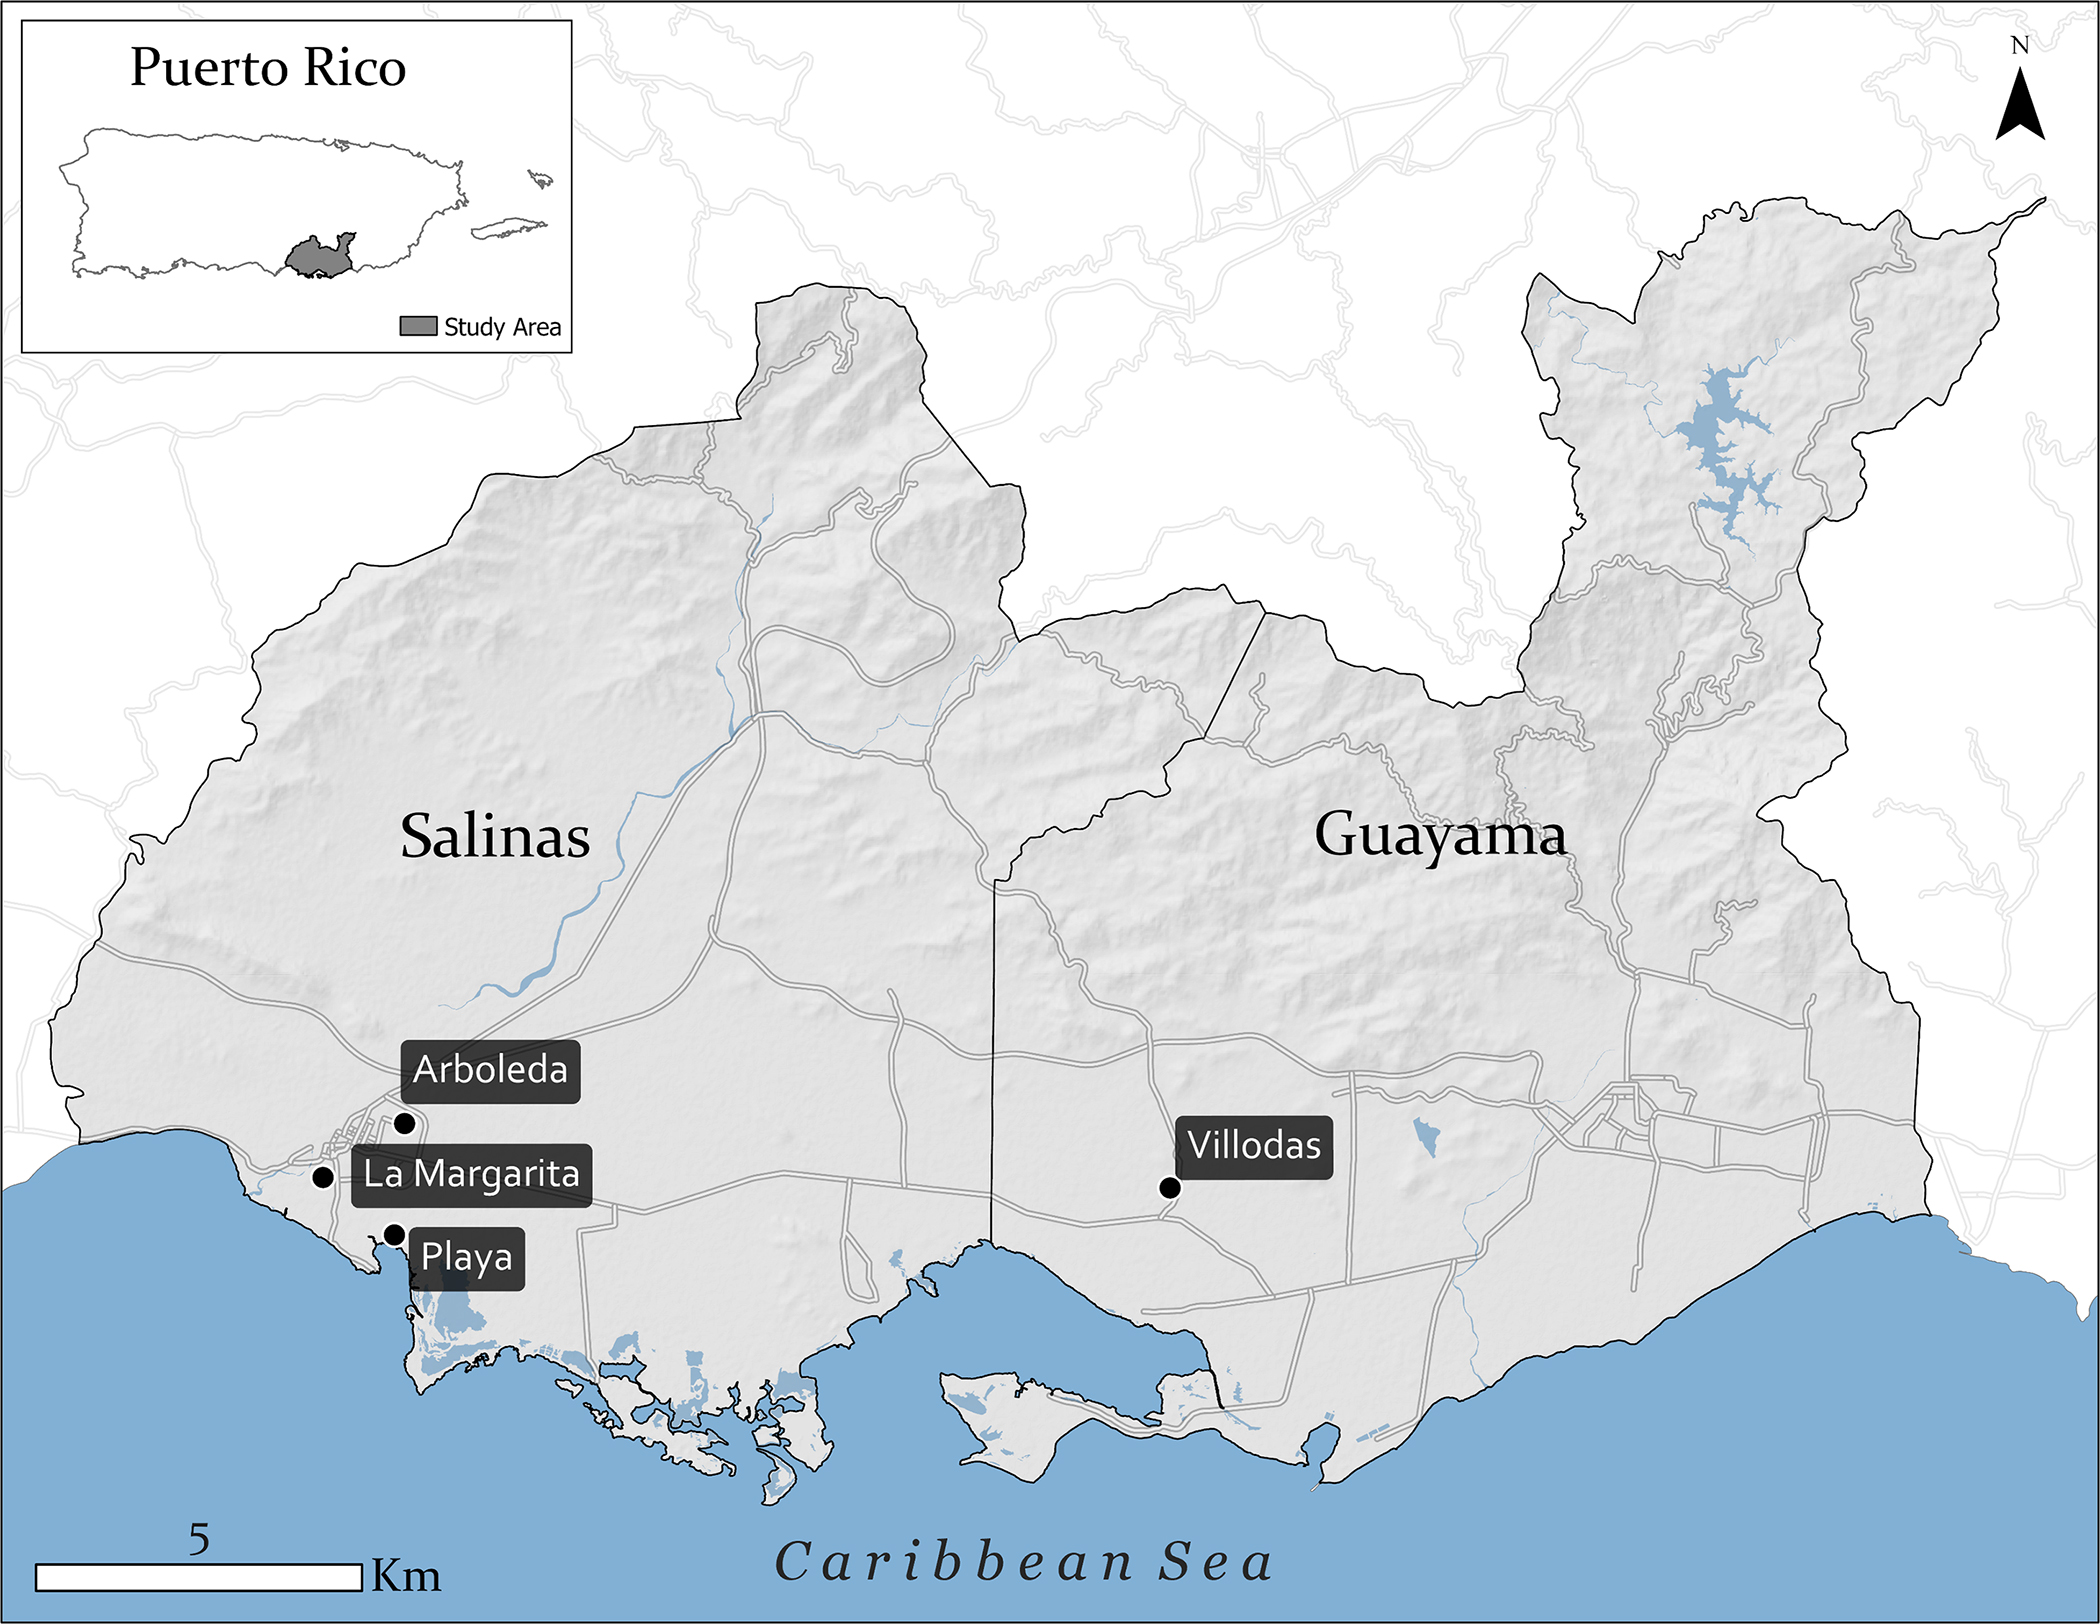
Map of southern Puerto Rico, showing the location of the study sites in Guayama and Salinas municipalities. Data sources: NASA DEM Height (https://lpdaac.usgs.gov/products/nasadem_hgtv001/), US Census Administrative Areas, and Puerto Rico’s government geospatial data (https://gis.pr.gov/descargaGeodatos/Pages/default.aspx).
Monthly Oceanic El Niño Index (ONI) was obtained from the NOAA’s National Weather Service (NOAA 2022). It indicates the 3-month running mean of the extended reconstructed sea surface temperature (ERSST.v3b SST) anomalies in the EL Niño 3.4 region (5°N-5°S, 120°-170°W). ONI values were recoded for analyses into three classes (1, −1, 0) to reflect El Niño (ONI ≥ 0.5), La Niña (ONI ≤ − 0.5), and neutral conditions (−0.5 < ONI < 0.5), respectively. We used data from the US Drought Monitor webpage database and maps to improve our understanding of the relationship between ONI and droughts in Puerto Rico during the study period (USDM 2022). We extracted the variable drought intensity as the sum of percentages of the area of Puerto Rico under drought conditions per month (e.g., 0% as no drought to 100% as drought over all the islands, with a range of 0–92.1%).
Aedes aegypti management.
We managed the populations of Ae. aegypti in LM and VI using mass trapping with AGO traps from December 2011-June 2019 in LM and from February 2013–June 2019 in VI and did not conduct mosquito control in AR or PL. Data analyzed here are from March 2013–June 2019. Data collected after June 2019 were not analyzed in this study because we initiated a community involvement intervention in LM after that date.
The AGO trap attracts ovipositing females of Ae. aegypti to water with a hay packet and the mosquitoes are retained inside the trap on a sticky glue board. Mass trapping consisted of placing three intervention-AGO traps per building (IAGO traps) in over 80% of the buildings. AGO traps used for mass-trapping (IAGO traps) are identical to the AGO traps used for surveillance (SAGO traps), we differentiate them because we did not count mosquitoes in IAGO traps, so that reported results from monitoring female Ae. aegypti are derived only from SAGO traps, as explained below. We used 793 IAGO traps in LM and 570 in VI. However, during May–October 2015, we temporarily reduced the number of IAGO traps per home in VI from three to two, and we again increased to three IAGO traps per home for the rest of the study. The temporary reduction of the number of traps was done to check if we were using an adequate trap density. Before installing the IAGO traps, we conducted an initial and one-time source reduction and larviciding activity in each study site (Natular spinosad T30 and XRT; Clarke, Roselle, IL), following the recommendation of Chan et al. (1977) about reducing the availability of alternate ovipositing sites before mass trapping (Barrera et al. 2014a). Changes in the female adult populations of Ae. aegypti were monitored every week using SAGO traps (SAGO traps; 44 in LM, 27 in VI, 30 in AR, and 28 in PL). SAGO traps were uniformly deployed in the study neighborhoods keeping a minimum distance of 30m between traps. Following this rule, the total number of SAGO traps per study site resulted from the size of each area. SAGO traps were placed in houses whose residents gave us permission to access the property every week to count captured mosquitoes. SAGO traps were placed near the entrance of houses in shaded places (Barrera et al. 2014b).
Container habitats.
To better understand how rainfall may interact with containers that produce Ae. aegypti in the study sites, we conducted a one-time survey of container types in the study sites. For example, if most containers are filled with water by rains (e.g., discarded containers in backyards) we would expect a closer relationship with rainfall as compared with areas where most containers are filled with water by people (e.g., water-storage containers, plant pots). We visited houses in each of the study sites (117 AR, 118 LM, 93 PL, 103 VI) in August 2017 to determine the types and abundance of containers that were known to produce Ae. aegypti in the study areas (Barrera et al. 2006). We grouped the containers found in houses into eleven classes: animal drinking pan, boat, cleaning (buckets), discarded (bottles, can, plastic food containers), ornamental (plant pots, water fountains), septic tank, structure (fence poles, broken bricks), tarp, toy, water meter, and water storage (water tanks, drums, pails; Table 1). This assessment was not useful to determine quantitative differences in pupal production among sites because of its short duration; it only provided information about the prevalence of containers that are typically filled with water by people or rains.
Table 1.
Percentages of container types and total (in parenthesis) number of containers found in houses of the study sites in southern Puerto Rico 2017.
| Containers/Sites | Arboleda (1858) | La Margarita (1780) | Playa (1544) | Villodas (1675) |
|---|---|---|---|---|
|
| ||||
| Animal drinking pan | 5.0 | 3.5 | 17.7 | 7.9 |
| Boat | 0.1 | 0.1 | 0.3 | 0.1 |
| Cleaning | 17.4 | 15.8 | 18.6 | 18.9 |
| Discarded | 13.4 | 12.8 | 26.9 | 25.5 |
| Ornamental | 32.2 | 40.1 | 11.7 | 15.8 |
| Septic tank | 0.0 | 0.0 | 4.5 | 3.3 |
| Structure | 8.8 | 7.8 | 3.8 | 6.3 |
| Tarp | 1.2 | 0.8 | 1.2 | 1.2 |
| Toy | 1.9 | 1.0 | 1.1 | 1.4 |
| Water meter | 6.6 | 6.5 | 3.7 | 6.0 |
| Water storage | 13.4 | 11.6 | 10.5 | 13.6 |
Arboviral cases.
Confirmed human cases of dengue (DENV), chikungunya (CHIKV), and Zika (ZIKV) were detected by serology (IgM capture enzyme-linked immunoassay; Lanciotti et al. 2007; Martin et al. 2000) or molecular (real time RT-PCR; Santiago et al. 2013, 2018) assays in the municipalities of Salinas and Guayama. Data came from the passive surveillance system of the Puerto Rico Department of Health and hospital sentinel surveillance from the Dengue Branch, Centers for Disease Control and Prevention. For analysis purposes, we aggregated monthly human case data to Salinas and Guayama municipalities.
Data analyses
Container types.
We ran Kendall’s W coefficients of concordance to determine if the order of abundance of the 28 types of containers found in the study sites was similar among the four sites. We also used Spearman correlation analyses to determine similarities in the order of abundance of container types between pairs of study sites. The Kendall coefficient uses ranks to produce a measure of concordance or rank correlation between two or more rank lists and varies between 0 (lack of agreement or concordance) and 1 (agreement or concordance). In this case, this index was used to indicate the similarity of rank order of abundance of containers among all four study sites. A significant test would indicate that the composition of types of containers in all four sites was similar. The Sperman rank correlation analysis was used to answer the question whether the rank order of container type abundance between pairs of sites was similar or not.
Intra-annual or seasonal variability.
We calculated averages (± standard errors) of the relative abundance of Ae. aegypti in sentinel AGO traps (females/trap/week), weekly rainfall, and daily temperature and relative humidity to describe seasonal changes in these variables. Pearson correlation coefficients were calculated to explore associations between pairs of these variables. To evaluate seasonality of Ae. aegypti abundance and arbovirus cases per month we calculated the seasonal component of the time series by averaging the de-trended series values for each month of the year. The de-trended series was obtained by subtracting the moving average series (12 mo.) from the series of original observations.
Oceanic El Niño Index (ONI), local weather, and Ae. aegypti populations.
We calculated partial correlation coefficients between monthly ONI and drought intensity while controlling for weather variables (rainfall, temperature, relative humidity). Partial correlation analyses were also conducted between ONI and Ae. aegypti abundance (log10+1 transformed) and between drought intensity (percentage of island area under drought conditions) and Ae. aegypti abundance (log10+1 transformed). Pearson correlation analyses were performed between pairs of variables (monthly rainfall, drought intensity, averages of relative humidity, temperature, and log-transformed Ae. aegypti abundance). We also examined the effect of drought intensity on the abundance of Ae. aegypti using a Generalized Linear Model (GLM) while simultaneously considering rainfall, temperature, and relative humidity and study sites as covariates. We accounted for repeated measures using an order-one autoregressive covariance structure and a negative binomial with log link.
Interaction between dry/wet seasons and ONI on weather and Ae. aegypti.
The effects of El Niño/La Niña on weather and mosquito populations are difficult to understand because these inter-annual climate phenomena occur across seasons. For example, above normal air temperature due to El Niño typically reaches a maximum in December/January, at a time when air temperatures over Puerto Rico tend to be the lowest of the seasonal cycle because the islands are in the northern hemisphere. Increased rainfall that characterizes La Niña can affect seasonality by causing wetter/cooler dry seasons and intensification of tropical storms.
To investigate how these inter-annual climate processes interacted with seasonality, we used a GLM to test for the effects of coded ONI (La Niña= −1, neutral conditions= 0, El Niño= 1), dry/wet seasons (dry= December-May; wet= June-November) and their interaction on average monthly local rainfall, temperature, relative humidity, and numbers of Ae. aegypti females. We accounted for repeated measures using an order-one autoregressive covariance structure and a negative binomial with log link. The GLM for Ae. aegypti females also included the indicator of mosquito management for the study sites (no IAGO traps/home= 0, two IAGO traps/home= 2, and three IAGO traps/home= 3).
Cross-correlation analyses.
To investigate past or lagged effects of ONI, drought, mosquitoes, and weather parameters (rainfall, temperature, relative humidity), we conducted cross-correlations with total arboviral cases per month. We used the sum of cases of each virus (DENV, CHIKV, ZIKV) because they are all transmitted by Ae. aegypti in the same urban areas in Puerto Rico. We also cross-correlated mean Ae. aegypti abundance with the above-mentioned variables. Total cases and mosquito time series were pre-whitened by fitting Auto Regressive Integrated Moving Averages (ARIMA; Vandaele 1983) time series models to eliminate auto-correlations. Residuals of the pre-whitened time series were used to calculate the cross-correlations and time lags with weather variables. Statistics analyses were conducted using IBM SPSS Statistical Subscription ver. 28.0.1.1 (IBM Corporation).
Results
Container types.
We identified 28 types of containers and found similar average (± 95 % C.I.) number of containers per house in all four study sites (15.75 ± 2.42 AR, 15.08 ± 2.0 LM, 16.43 ± 3.6 PL, 15.84 ± 1.33 VI). The two sites with higher socio-economic status (AR, LM) showed higher percentage of containers whose water content was managed by residents, such as those used for ornamental purposes (plant pots, ornamental fountains, bromeliads), cleaning (buckets, trash cans), and water storage (barrels, tanks) purposes (Table 1). The two communities with lower socio-economic status (PL, VI) had a higher proportion of discarded containers, animal drinking pans, and septic tanks (Table 1).
The Kendall’s W coefficient of concordance of the abundance of each type of container among the four study sites was not significant (W= 0.09; P> 0.05), indicating poor overall concordance of container type composition across the four study sites. Results from the Spearman correlation analyses comparing container type composition between pairs of study sites showed that the composition of containers in the two neighborhoods with the higher socio-economic status was highly correlated (rs= 0.96; P< 0.001) and similarly, the two neighborhoods with the lower socio-economic status was also highly correlated (rs= 0.90; P< 0.001). Correlations between higher and lower socio-economic status were also significant but with lower values, ranging 0.68–0.83 (P< 0.01).
Intra-annual or seasonal variability.
The highest mean daily temperatures were recorded in all sites between May and October (22 – 31°C), whereas rainfall and relative humidity peaked later, from August–November (Fig. 2). Rainfall and relative humidity were significantly correlated in all sites (LM, PL r= 0.60; VI r= 0.66; AR r= 0.56; N= 76 months; P< 0.01). Rainfall was bimodal, with a smaller peak around May and a larger, more extended one from August–November (Fig. 2). Relative humidity, although highly correlated with rainfall, showed lower values during the first seven months of the year in all sites (Fig. 2). The correlation between rainfall and temperature was significant only in VI (r= 0.27; P< 0.05). Relative humidity and temperature were not significantly correlated in any site (P> 0.05). Thus, seasonal weather in the study sites reflects a drier and cooler season from December–April, a smaller rainfall peak around May in most years, and warmer and wetter conditions from August–November. Temperature and rainfall were lower in AR than in the other study sites (Table 2).
Figure 2.
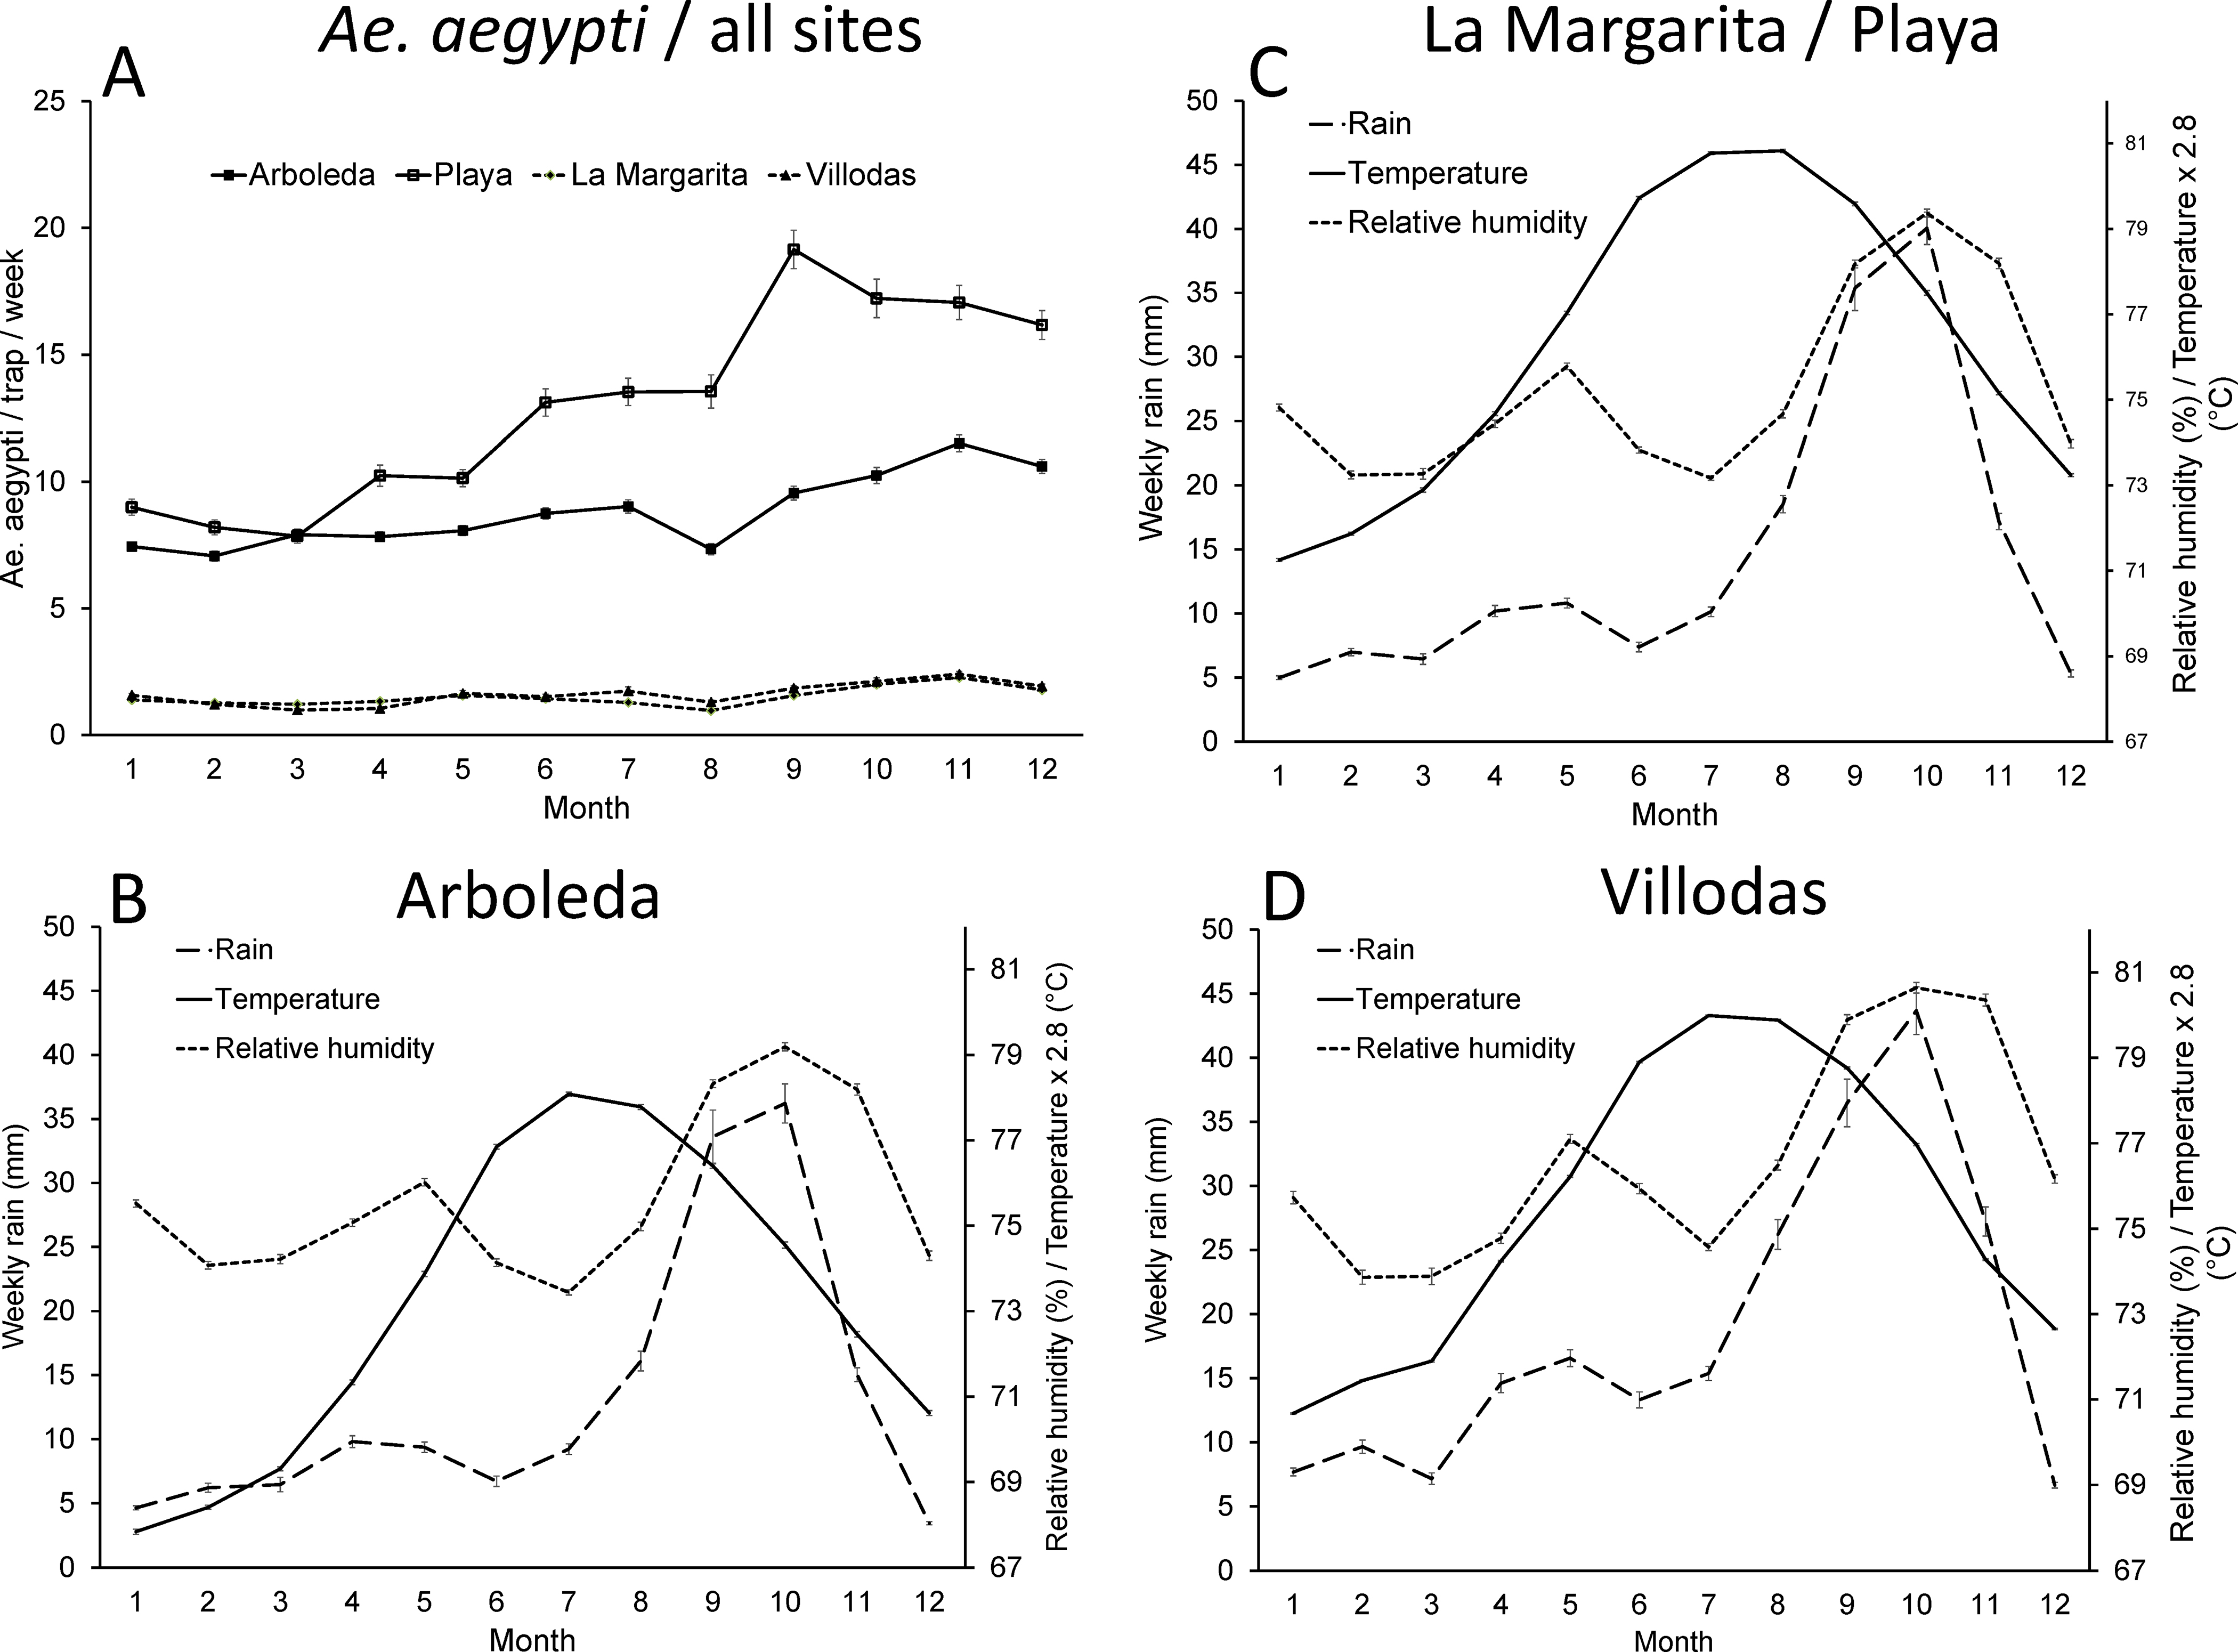
A- Average monthly numbers of female Ae. aegypti / trap / week in the four study sites, B- monthly averages of accumulated weekly rainfall and daily air temperature and relative humidity in Arboleda, C- La Margarita/Playa, and D- Villodas study sites. La Margarita and Villodas were the study sites with mass IAGO trapping, whereas Arboleda and Playa sites were unmanaged. Only one meteorological station reflects data from La Margarita and Playa given their spatial proximity.
Table 2.
Monthly averages and standard errors of daily temperature and relative humidity (March 2013 – June 2019) and average annual rainfall (2014–2018) registered in meteorological stations located in the study sites, southern Puerto Rico.
| Site/weather variable | Temperature (°C) | Rainfall (mm) | Relative humidity (%) |
|---|---|---|---|
|
| |||
| Arboleda | 26.11 ± 0.01 | 683.5 ± 147.4 | 75.60 ± 0.03 |
| La Margarita / Playa | 27.20 ± 0.01 | 737.3 ± 128.3 | 75.21 ± 0.03 |
| Villodas | 26.95 ± 0.01 | 929.5 ± 116.3 | 76.55 ± 0.05 |
The overall mean (± SE) number of female Ae. aegypti/trap/week was larger in unmanaged (PL= 12.80 ± 0.16; AR= 8.74 ± 0.07) than in managed sites (LM= 1.50 ± 0.02; VI= 1.60 ± 0.03; Fig. 2). The analysis of seasonality using seasonal components showed that the populations of Ae. aegypti reached maximum seasonal values during the wetter and warmer months of the year (September–November; Fig. 3). Aedes aegypti populations in unmanaged sites and arbovirus cases at municipal level showed clear seasonal signals. Seasonality in managed sites was less pronounced. Numbers of mosquitoes and arbovirus cases reached their lowest values during the first months of the years when weather conditions are typically drier and cooler (Figs. 2, 3). It is interesting to note that arbovirus cases reached maximum values in September as an average, before Ae. aegypti populations reached their maximum values in September-November (Fig. 3).
Figure 3.
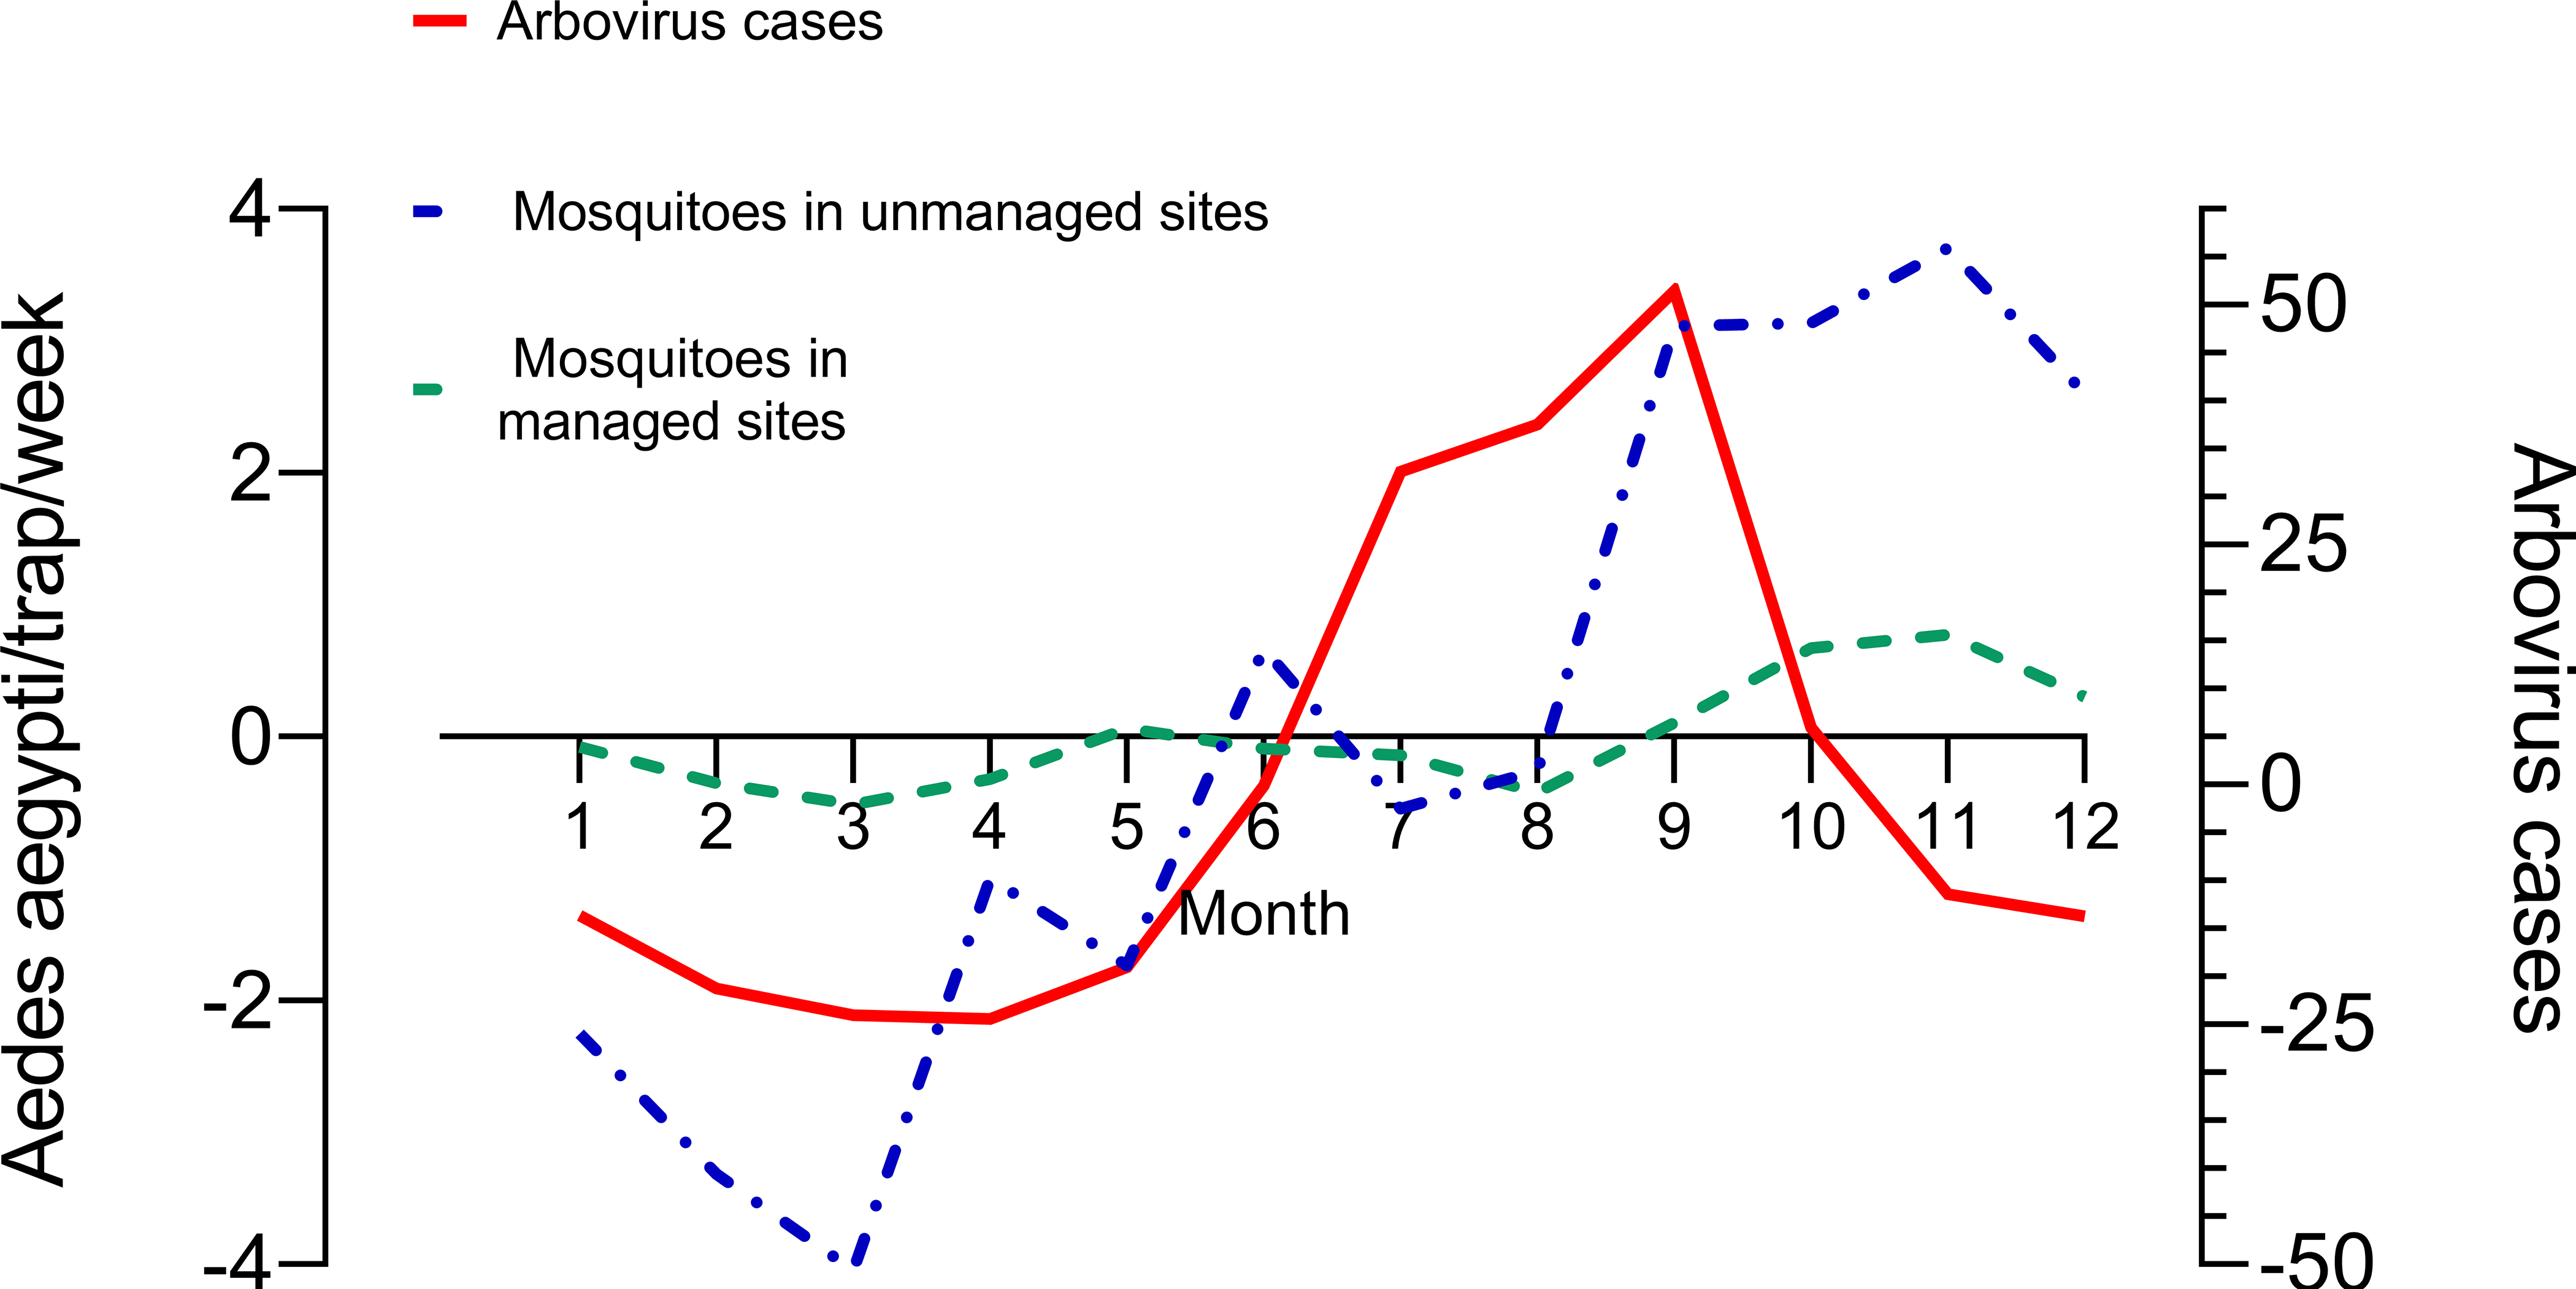
Seasonal components of Ae. aegypti / trap / month in the four study sites. Monthly seasonal components result from averaging for each month the differences between the original time series and the 12-mo. moving average, reflecting the time-series trend.
Weekly fluctuations of Ae. aegypti/trap showed a trend of decreasing abundance in unmanaged AR since the beginning of the study in 2013 until hurricane Maria hit the island in September 2017 (Fig. 4). Fluctuations of Ae. aegypti/trap/week in unmanaged PL showed a steady and clear seasonal pattern since the beginning of the study until Hurricane Maria and declined afterwards (Fig. 4). Steep but short-lived increases in mosquito populations were recorded around five weeks after Hurricane Maria in all study sites (Fig. 4).
Figure 4.
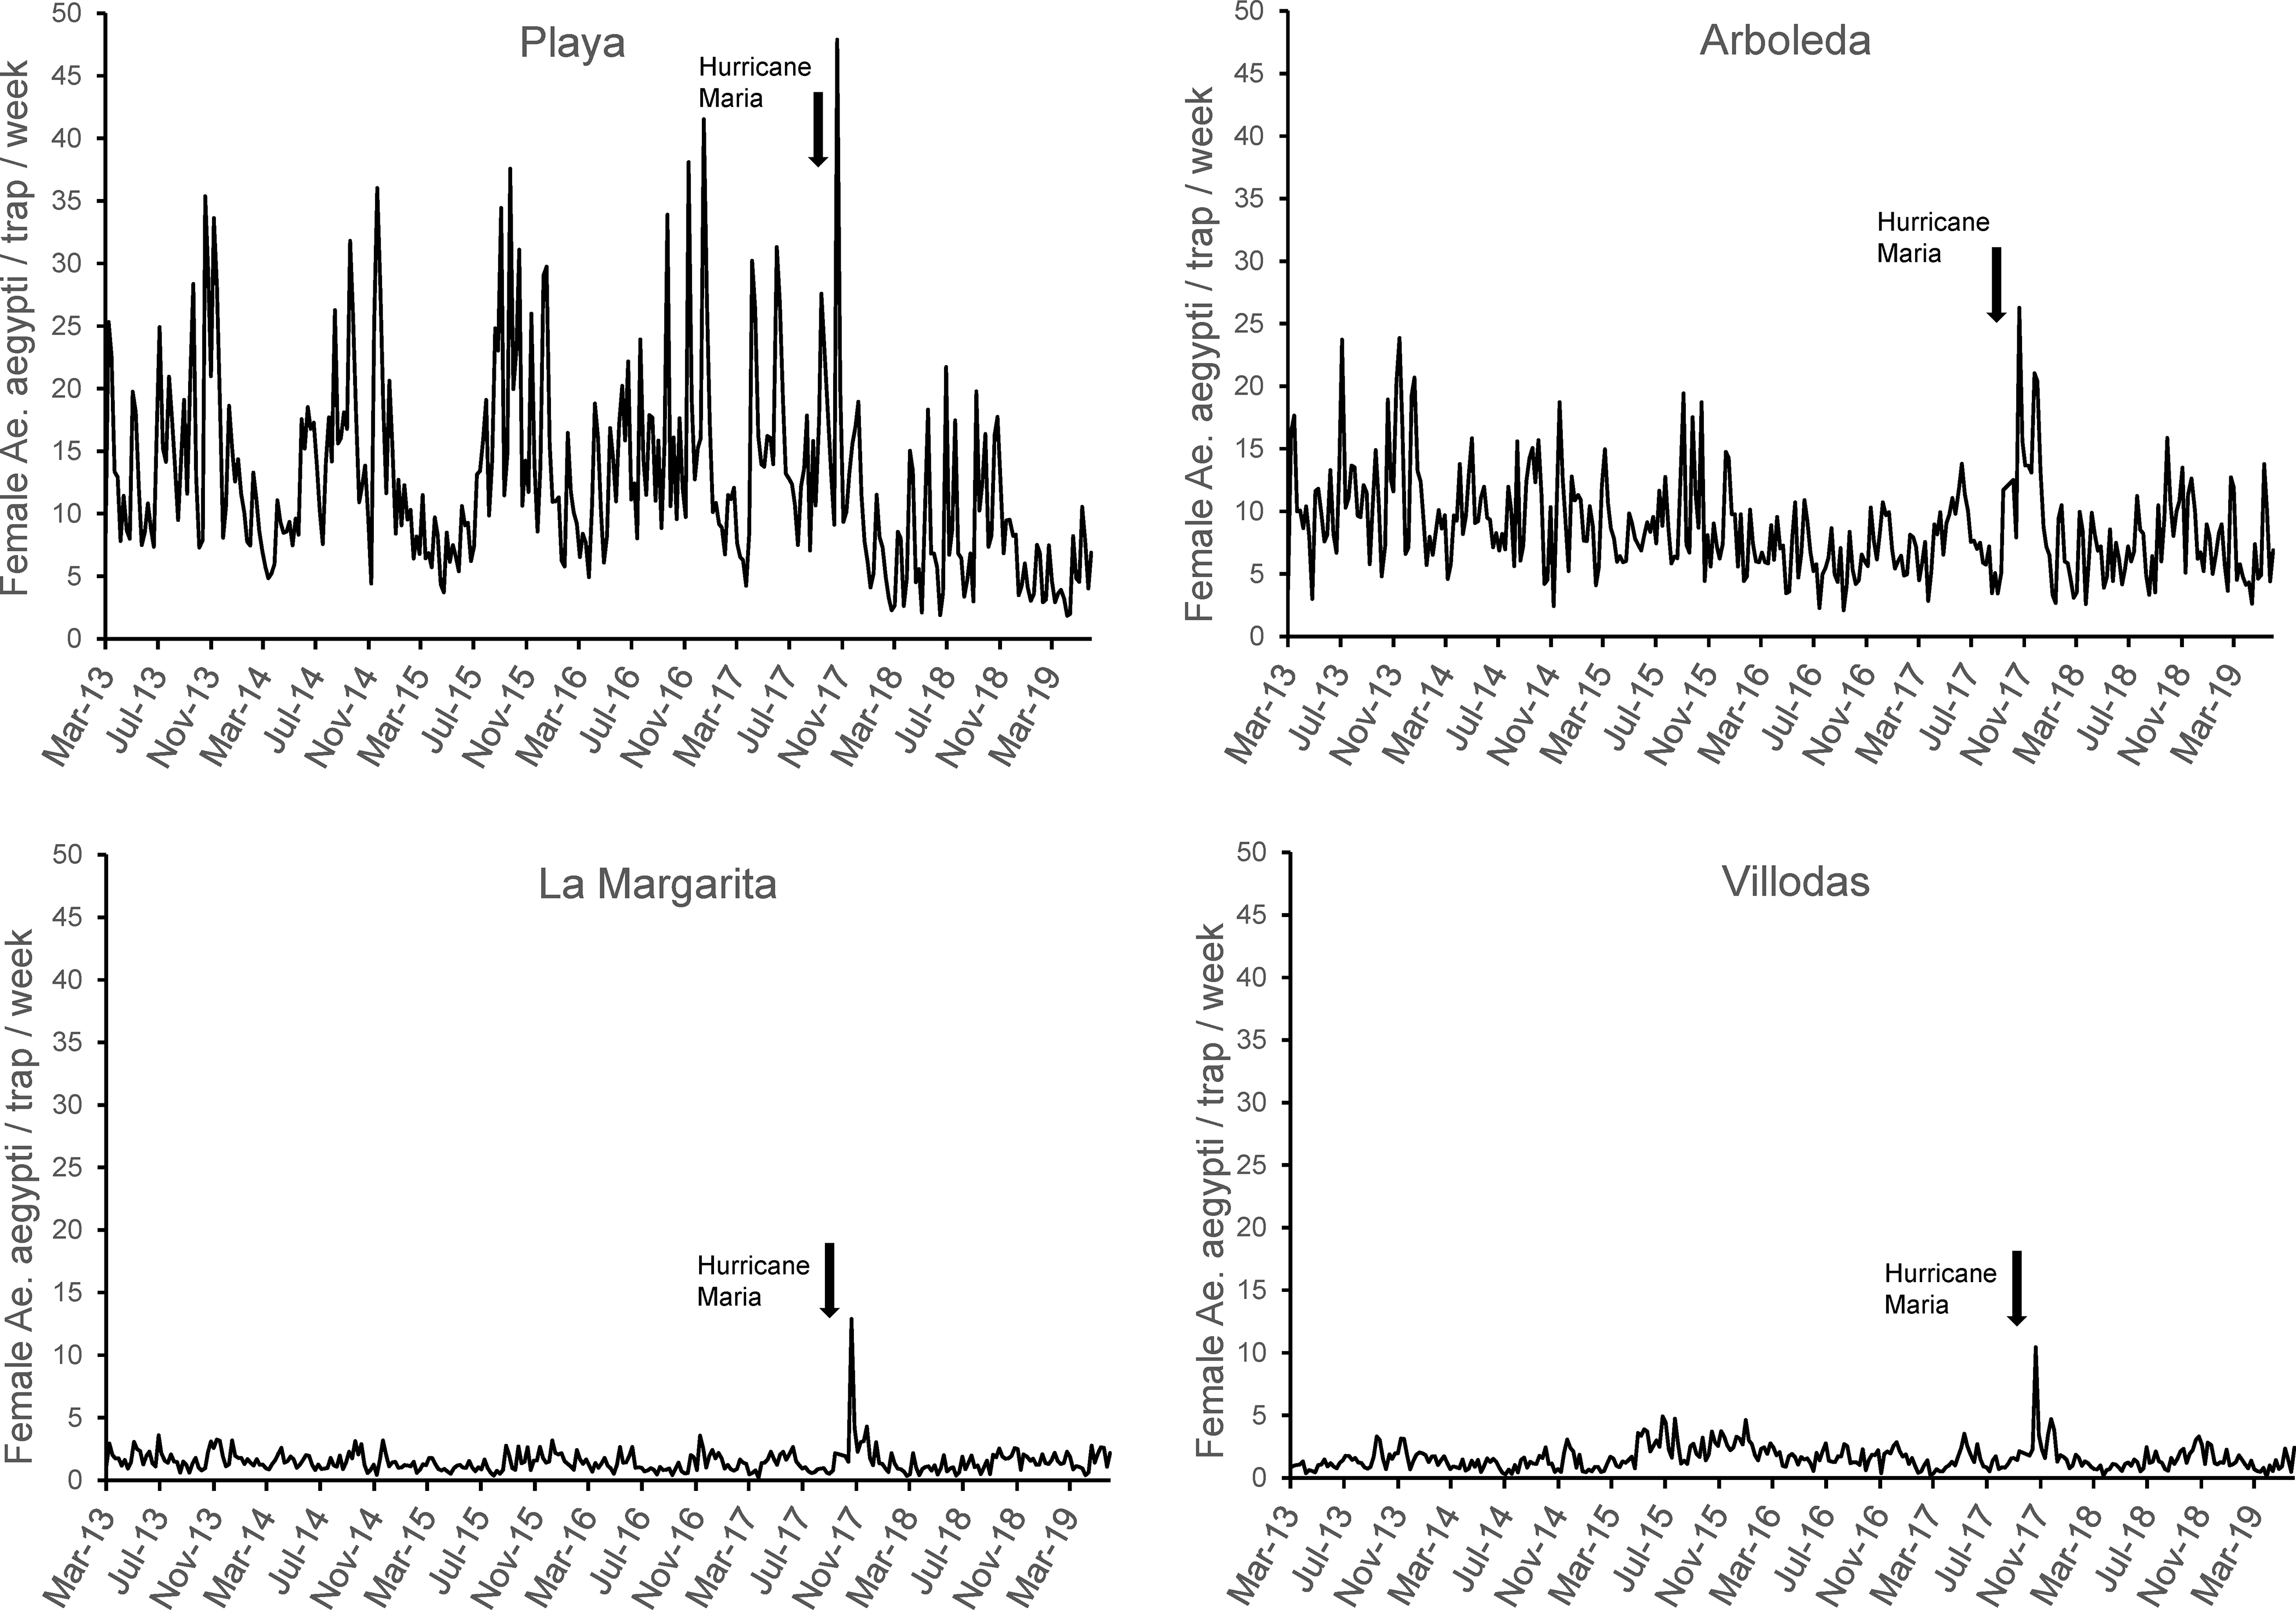
Weekly abundance of female Ae. aegypti / trap in unmanaged study sites Arboleda and Playa and in managed study sites La Margarita and Villodas from March 2013 – June 2016 in southern Puerto Rico.
Relationship between Oceanic El Niño Index (ONI), local weather, and Ae. aegypti populations.
There were two El Niño events during the study (ONI values ≥ 0.5): one very intense (ONI Max: 2.6) and long from October 2014–April 2016 and a lesser, shorter one (ONI Max: 0.9) from September 2018-June 2019 (Fig. 5, panel B). La Niña conditions (ONI values ≤ − 0.5) followed EL Niño 2014–2016 in September–December 2016 and October 2017–April 2018. There was a significant and positive partial correlation between ONI and monthly drought intensity (percentage of Puerto Rico area under drought conditions; r=0.78; d.f.= 299; P< 0.001; Fig. 5, panel A). Severe and extreme drought conditions were observed in eastern Puerto Rico from May 2015–2016, affecting the study areas (Fig. 6). Less severe droughts were reported in 2014 and 2018; the latter associated with El Niño 2018–2019 (Fig. 5). No droughts occurred during La Niña events. Drought intensity was negatively correlated with monthly rainfall (r= −0.21; d.f.= 302; P< 0.001) and relative humidity (r= −0.11; d.f.= 302; P< 0.05), but not with temperature (r= 0.02; d.f.= 302; P> 0.05). The partial correlations between log-transformed Ae. aegypti captures and drought intensity (r= −0.03; d.f.= 299; P> 0.05) or ONI (r=0.08; d.f.= 298; P> 0.05) were not significant. To further examine the possible effect of drought intensity on the abundance of Ae. aegypti while simultaneously considering other weather variables, we ran a GLM analysis on mean Ae. aegypti abundance as outcome that was significant (F7, 296= 70.1; P< 0.001), with significant effects of rainfall (b= 0.003; 0.002 – 0.004), temperature (b= 0.080; 0.035 – 0.126), and study site (AR, b= 1.795; 1.519 – 2.070; LM, b= −0.012; −0.369 – 0.346; PY, b= 2.095; 1.828 – 2.362; VI, reference ), but no significant effects of relative humidity (b= 0.018; −0.001 – 0.037) or drought intensity (b= −0.002; −0.004 – 0.001).
Figure 5.
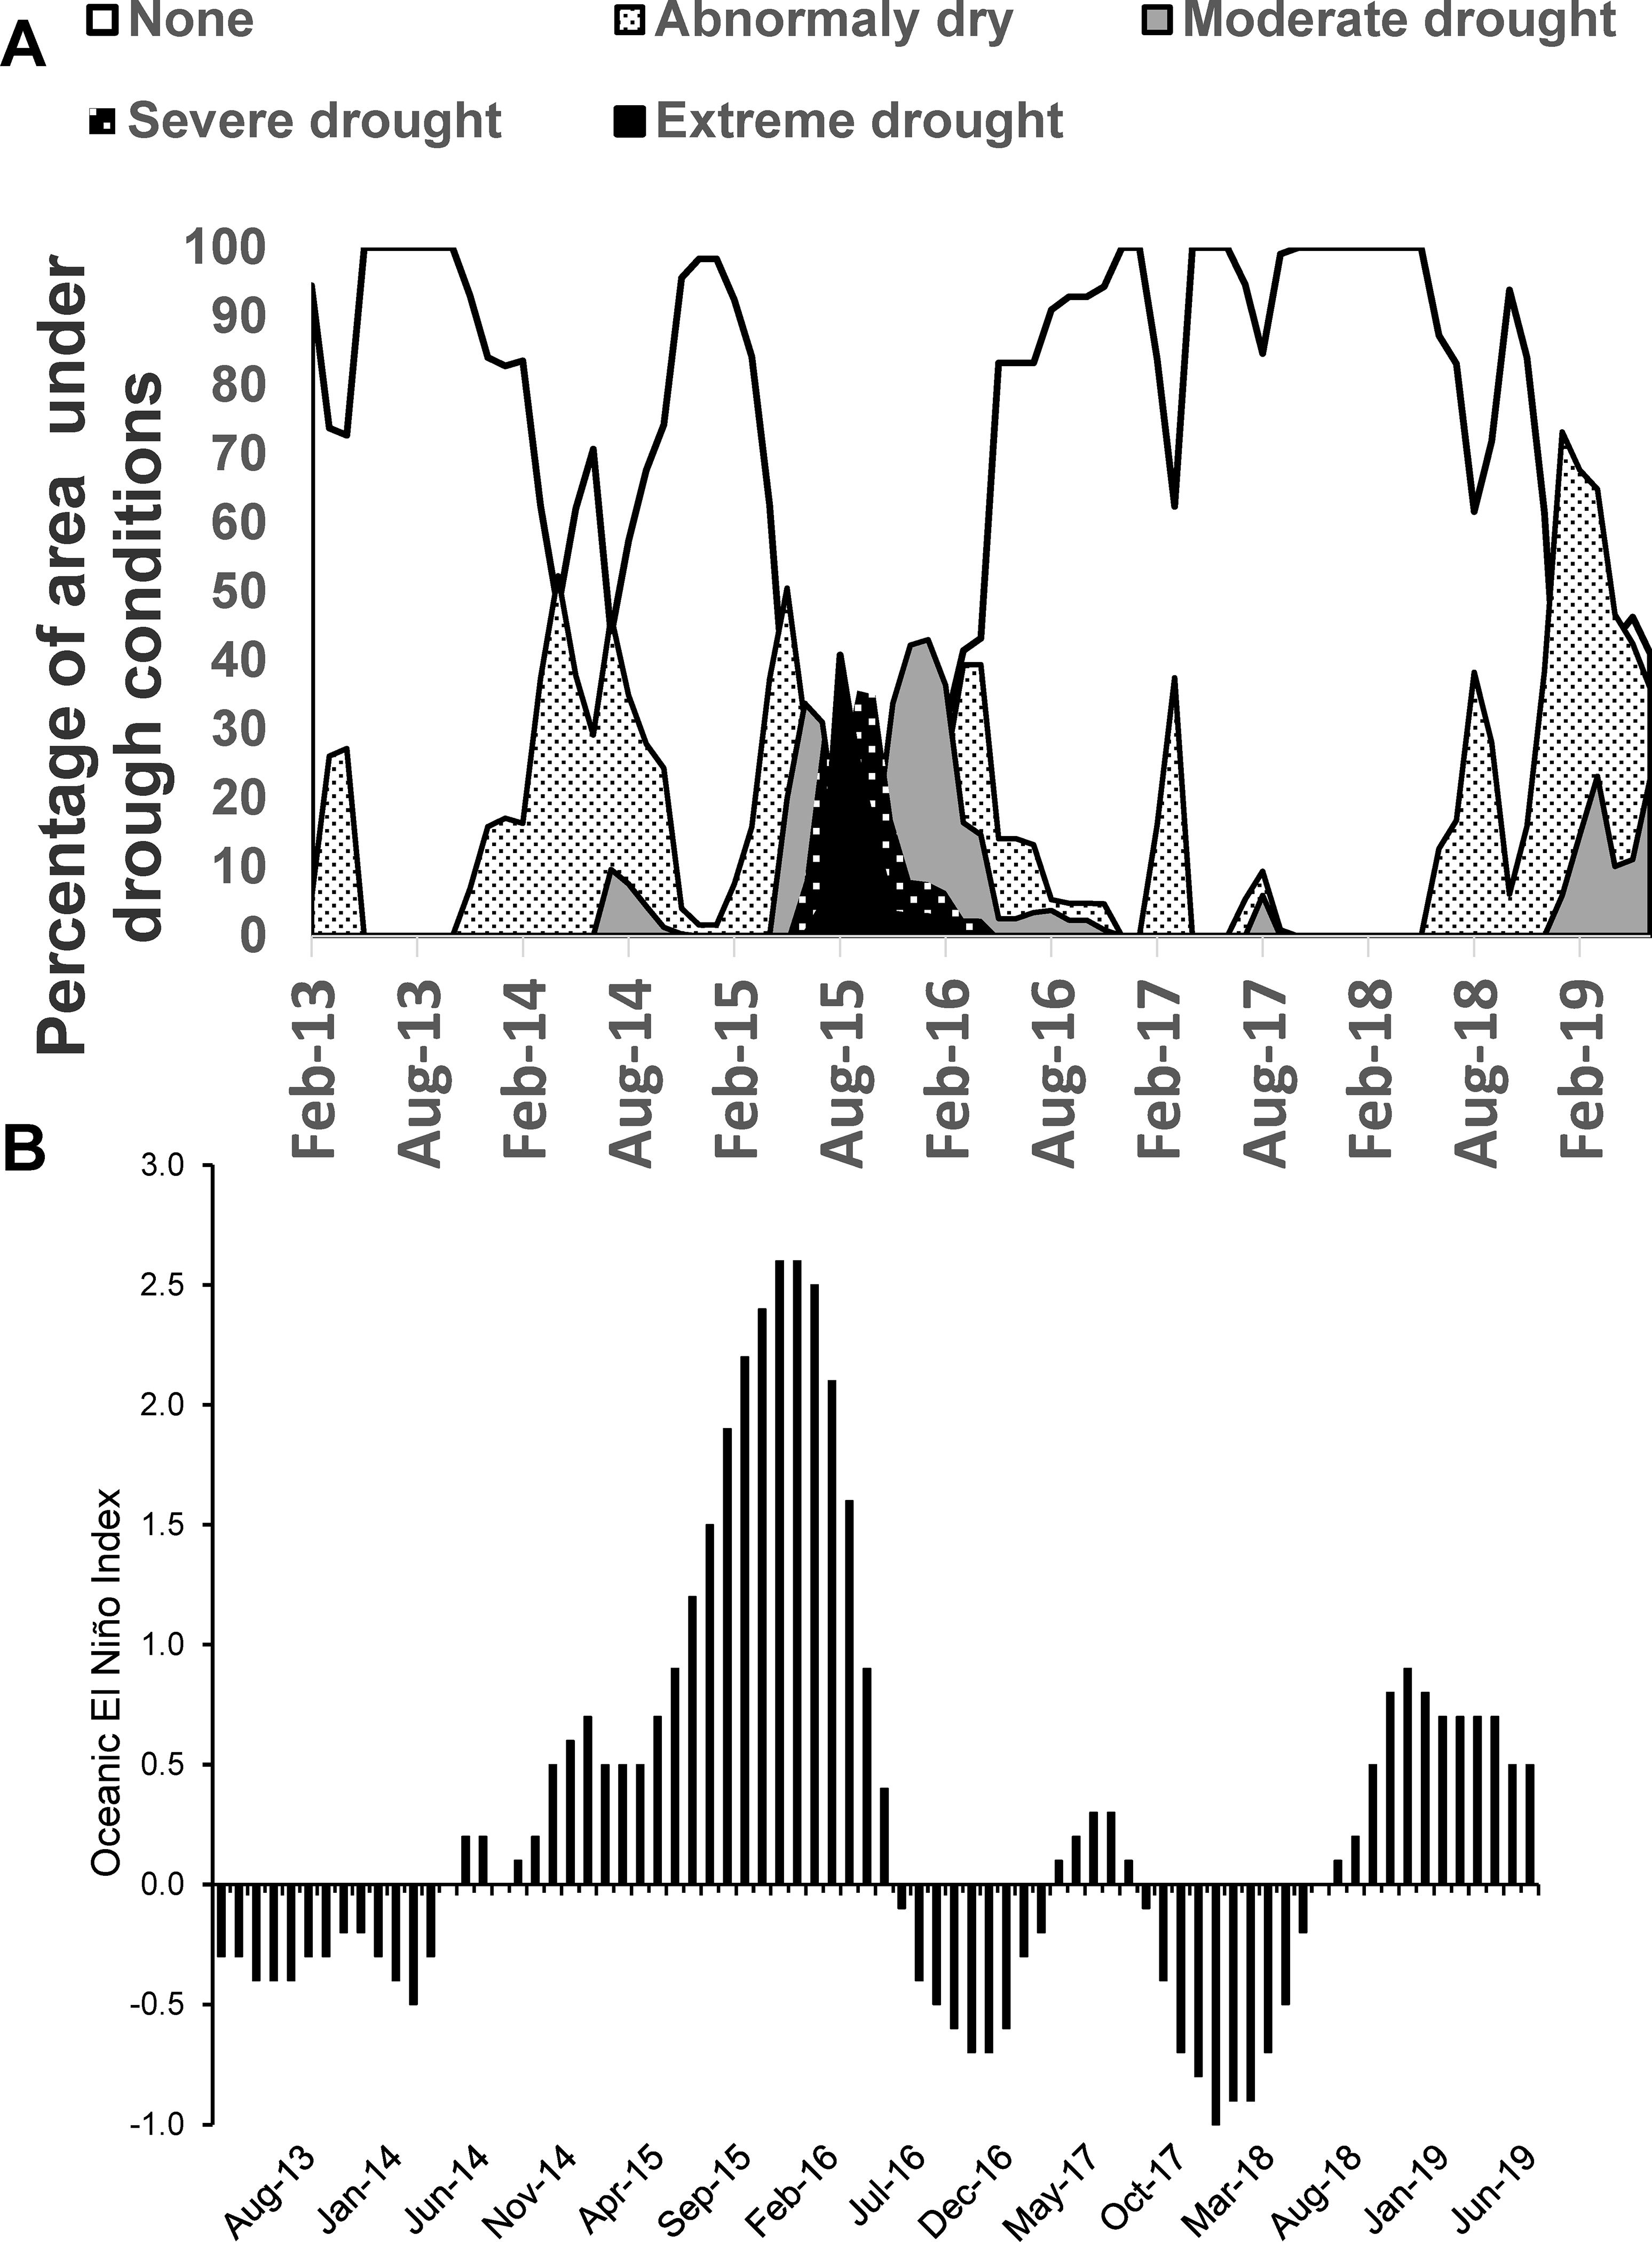
A- Monthly changes in the extent of drought conditions in Puerto Rico (percentage of land; https://droughtmonitor.unl.edu/DmData/DataDownload/ComprehensiveStatistics.aspx) and B- Oceanic El Niño Index 3.4 region (http://www.cpc.ncep.noaa.gov/products/analysis_monitoring/ensostuff/ensoyears.shtml) from February 2013 – June 2019.
Figure 6.
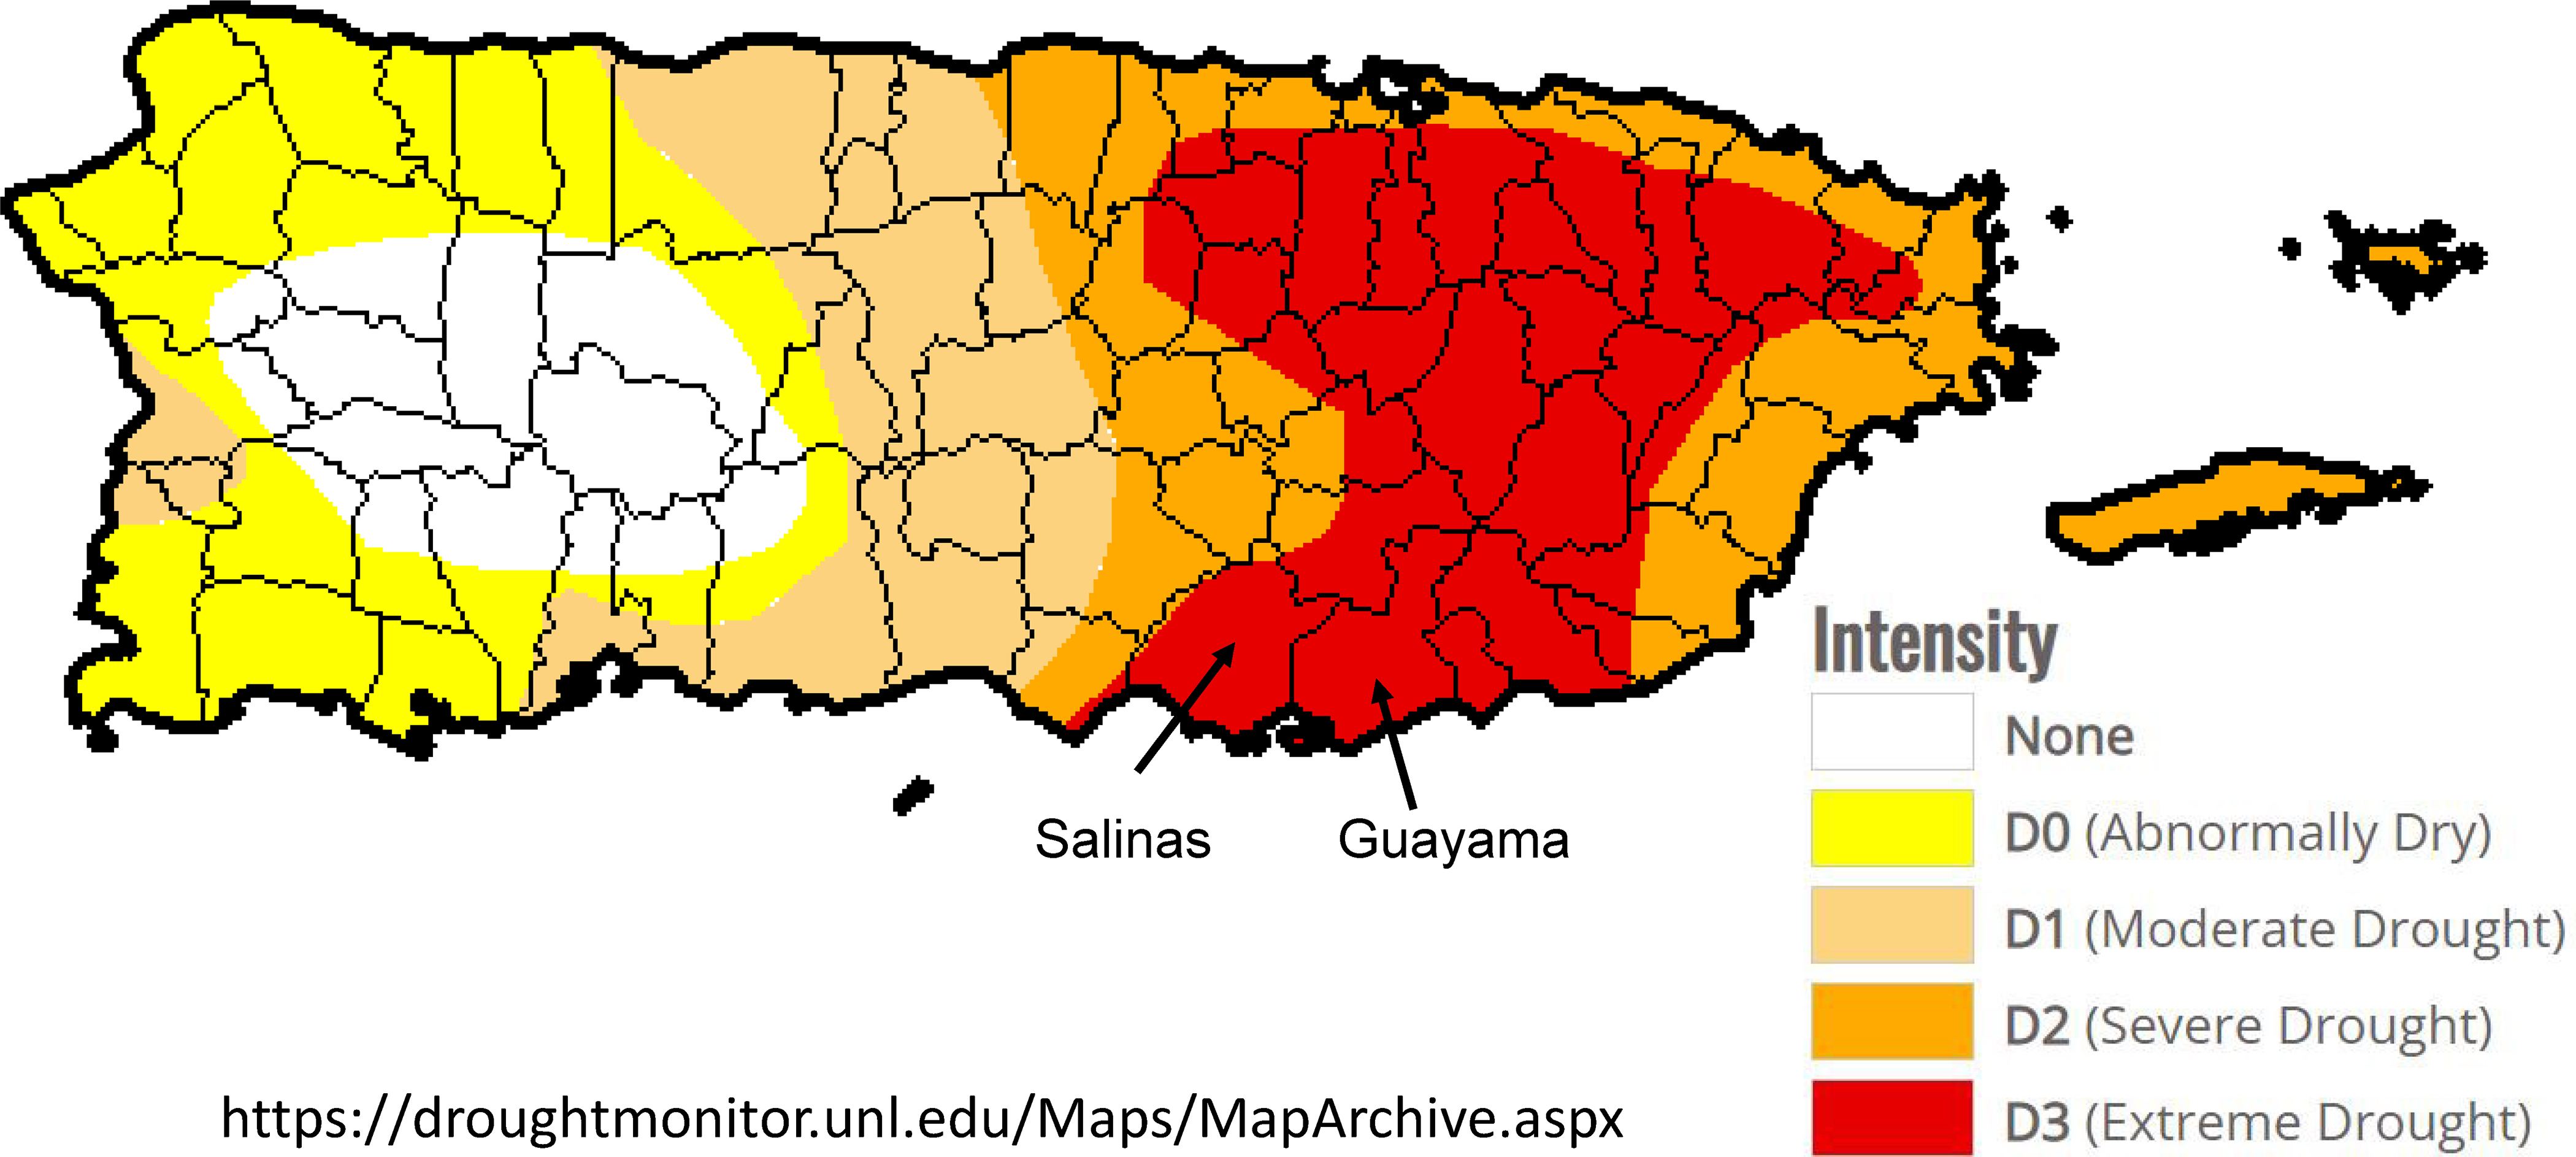
Map of Puerto Rico showing the areas under given drought conditions in mid-August 2015 (https://droughtmonitor.unl.edu/Maps/MapArchive.aspx) and the location of the study municipalities Guayama and Salinas. The U.S. Drought Monitor is jointly produced by the National Drought Mitigation Center (NDMC) at the University of Nebraska-Lincoln, the United States Department of Agriculture, and the National Oceanic and Atmospheric Administration. Map courtesy of NDMC.
Testing individual effects of season and ONI and their interaction on Aedes aegypti, rainfall, temperature, and relative humidity
Aedes aegypti.
The GLM analysis of average female Ae. aegypti/trap per month was significant (F7, 296= 20.0; P< 0.001) with significant effects of traps per home (unmanaged sites = 0 traps/home, b= 9.16; 7.57 – 10.75; managed= 2 traps/home, b=1.50; −2.38 – 5.38; or 3 traps/home, reference), non-significant effects of coded ONI (La Niña, b=1.48; −0.52 – 3.49; neutral ONI, b= 0.33; −1.13 – 1.79; El Niño; reference), and non-significant effects of the interaction effect season x ONI (dry*La Niña, b= −0.25; −2.36 – 1.87; dry*neutral ONI, b= −0.61; −2.20 – 0.98), suggesting that seasonality does not modulate the effect of ONI on Ae. aegypti populations; (Fig. 7A). The overall average (± SE) female Ae. aegypti/trap/week was 5.8 ± 0.8 and 4.8 ± 0.8 during the wet and dry seasons, respectively. Although not significant, there were more female Ae. aegypti in both the drier and wetter seasons during La Niña events (Fig. 7A). Temporarily reducing the number of traps from three to two traps per home during May-October 2015 in managed VI resulted in an increase of average (± 95% C.I) numbers of female Ae. aegypti/trap/week from 1.8 (0.6 – 2.9) when three traps were used to 3.3 (−0.7 – 7.2), although such a difference was not statistically significant (t=0.76; d.f.= 296; P> 0.05).
Figure 7.
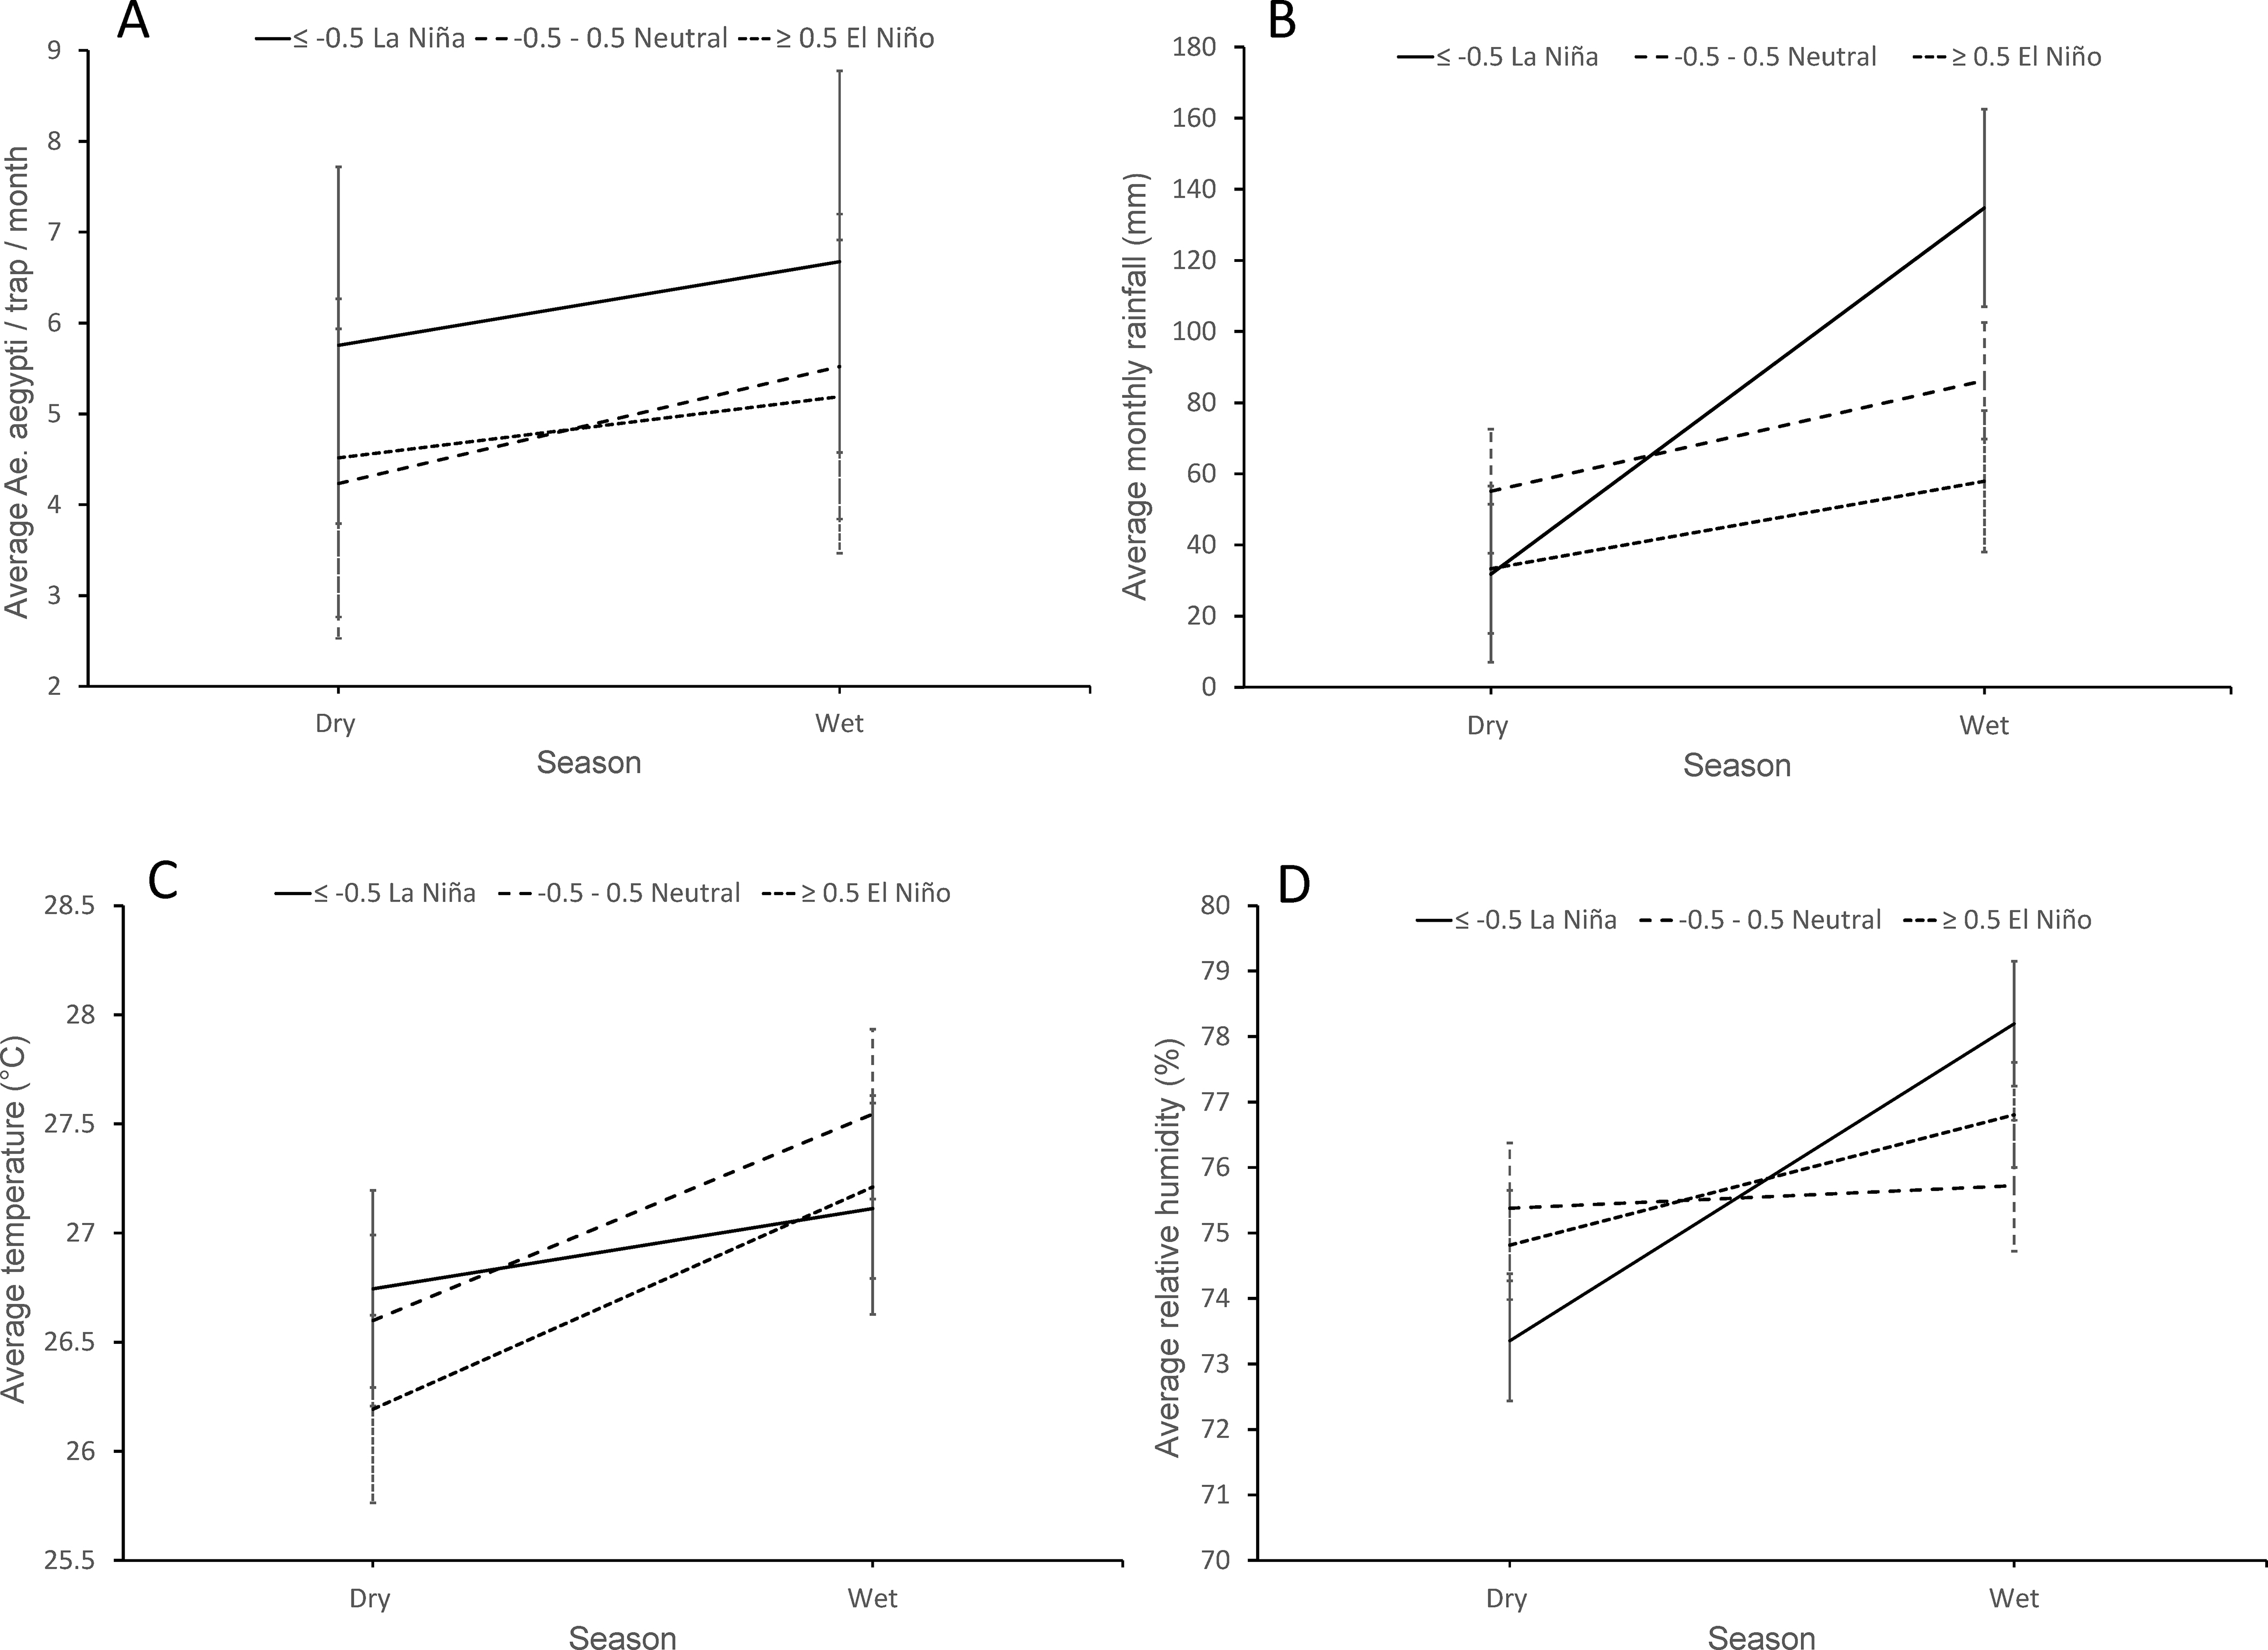
GLM model estimated means and standard errors of Ae. aegypti / trap / week, monthly rainfall, and daily temperature and relative humidity in the dry and wet seasons during La Niña, neutral conditions, and El Niño in study sites, southern Puerto Rico (March 2013 June 2019).
Rainfall.
The GLM analysis of monthly rainfall (mm) was significant (F5, 298= 10.9; P< 0.001) with significant effects of season (wet vs dry; b= −24.62; −48.53 – −0.71), coded ONI ( La Niña, b= 76.82; 42.86 – 110.79; neutral ONI, b= 28.29; 3.58 – 53.01; El Niño; reference), and the interaction effect season x ONI (dry* La Niña; b= −78.35; −119.77 – −36.94; dry*neutral ONI, b= −6.51; −37.79 – 24.76; Fig. 7B). There was more rainfall during the wetter season (model estimated means; June-November; 93.0 ± 6.8 mm) than during the drier (December–May; 40.1 ± 6.5) season. More rainfall was recorded during La Niña (83.2 ± 10.2) and neutral conditions (70.7 ± 6.7) than during El Niño (45.6 ± 7.5). The interaction season x ONI showed more abundant rains in the wet seasons during La Niña events (Fig. 7B).
Temperature.
The GLM analysis of monthly average temperature (°C) was significant (F5, 298= 22.2; P< 0.001) with significant effects of season (wet vs dry; b= −1.02; −1.29 – −0.75) and the interaction season x ONI effects (dry*La Niña, b= 0.65; 0.201 – 1.100; dry*neutral ONI, b= 0.072; −0.269 – 0.413; Fig. 7C). Average temperature was higher during the wetter (27.3 ± 0.2°C) than during the drier (26.5 ± 0.2°C) part of the year. The increase in temperature from the drier to the wetter season was less pronounced during La Niña (0.4°C) than during neutral conditions (0.95°C) or El Niño (1.02°C; Fig. 7C).
Relative humidity.
The GLM analysis of monthly average relative humidity (%) was significant (F5, 298= 11.5; P< 0.001) with significant effects of season (wet vs dry; b= −1.989; −3.034 – −0.945), and the interaction season x ONI (dry* La Niña, b= −2.855; −4.638 – −1.072; dry*neutral ONI, b= 1.645; 0.301 – 2.989; Fig. 7D). Relative humidity was higher during the wetter (76.9 ± 0.3%) than during the drier (74.5 ± 0.3%) part of the year. The interaction season x ONI showed a sharper increase in estimated means of relative humidity from the drier to the wetter season during La Niña (78.28 ± 0.7; Fig. 7D).
These analyses showed that Ae. aegypti was not significantly associated with ONI or drought but with more favorable conditions during the wet seasons. Also, weather conditions were drier during El Niño with sharper increases in temperature from the dry to the wet seasons, and wetter conditions during La Niña events.
Cross-correlation analyses. Arboviral cases.
Incidence of arboviral cases in the two municipalities of study sites (Guayama, Salinas) occurred as three waves: DENV (2013), CHIKV (2014), and ZIKV (2016), with virtually no arboviral cases from 2017 until June 2019 (Fig. 8). Dengue cases recorded during the time span of this study were a remnant of the dengue epidemics 2010–2013. Both the chikungunya and Zika outbreaks followed periods of drought in 2014 and 2015, which were significantly correlated with El Niño 2014–2016.
Figure 8.

Arbovirus cases (dengue, chikungunya, Zika) per month, percentage of Puerto Rico under drought conditions, and Oceanic El Niño (ONI) index in Guayama and Salinas municipalities from March 2013 – June 2019.
The ARIMA model used to pre-whiten monthly total human cases of arbovirus was successful at removing autocorrelations (Ljung-Box Q = 18.3; P> 0.05) and the model (stationary R2= 0.45) had significant constant (t= 2.9; P< 0.01) and moving average coefficients (lag 1; t= −7.9; P< 0.001). The following cross-correlations with arboviral cases by month were positive and significant (P< 0.05): ONI (lags 6–11 mo.), drought intensity (lags 5–12 mo.), temperature (lags 0, 1, 12 mo.), and mosquitoes/trap in AR (lags 9–10 mo.), PL (lags 9–10 mo.), and VI (lag 12 mo.). There was a negative cross-correlation with temperature at lag 6 mo.
Analyses of mosquito abundance per site
Mosquitoes in unmanaged AR.
The ARIMA model for average Ae. aegypti/trap/month was successful at removing autocorrelations (Ljung-Box Q = 16.2; P> 0.05) and the model (stationary R2= 0.32) had significant constant (t= 18.2; P< 0.001) and autoregressive coefficients (lag 1; t= 4.3; P< 0.001). There were no significant cross-correlations of mosquitoes with ONI, drought intensity, or temperature (P> 0.05). There were significant (P< 0.05) positive correlations of mosquitoes with rainfall (lag 1 mo.) and relative humidity (lags 1, 12 mo.) and negative correlations for both variables at lag 4 months.
Mosquitoes in unmanaged PL.
The ARIMA model was successful at removing autocorrelations (Ljung-Box Q = 20.9; P> 0.05) and the model (stationary R2= 0.55) had significant constant (t= 2.6; P< 0.001) and autoregressive coefficients (lag 1, t= 2.5, P< 0.05; lag 2, t= 2.3, P< 0.05; and lag 3, t= −2.5, P< 0.05) and a seasonal autoregressive coefficient (lag 1, t= 2.5, P< 0.05). There were no significant cross-correlations of mosquitoes with ONI or drought intensity (P> 0.05). There were significant (P< 0.05) positive correlations with rainfall (lags 0, 1, 2, 12 mo.), relative humidity (lags 0, 1, 11, 12 mo.), and temperature (lags 0, 1, 2, 3 mo.). There were negative correlations with temperature at lags 7 and 8 months.
Mosquitoes in managed LM.
The autocorrelations were successfully removed after applying just seasonal differencing (Ljung-Box Q = 17.1; P> 0.05). The only significant (P< 0.05), positive cross-correlations were with ONI (lags 2, 3, 4 mo.) and drought intensity (lags 1, 2 mo.).
Mosquitoes in managed VI.
The series of average number of monthly Ae. aegypti females/trap was transformed (natural logarithm) and seasonally differenced. The ARIMA model was successful at removing autocorrelations (Ljung-Box Q = 20.4; P> 0.05) and the model (stationary R2= 0.52) had significant autoregressive (lag 1, t= 4.7, P< 0.001) and seasonal autoregressive coefficients (lag 1, t= −6.6, P< 0.001). Like LM, cross-correlations were positive and significant only with ONI (lags 2, 3, 4) and drought intensity (0, 1, 2).
These results showed that arboviral cases were significantly and positively correlated with studied variables (ONI, drought, mosquitoes, temperature) several months in the past (5–12 mo.), whereas mosquitoes were correlated with weather variables (rain, relative humidity, temperature) at short (0–3 mo.) and long lags (11–12 mo.). The association of ONI and drought with Ae. aegypti was significant only in managed sites with short time lags (1–4 mo.).
Discussion
We investigated the possible effects of inter-annual ENSO events on local weather, populations of Ae. aegypti, and arbovirus cases (DENV, CHIKV, ZIKV) in two urban communities with mass mosquito trapping and two communities without mosquito control in southern Puerto Rico. We observed large variability in Ae. aegypti abundance among the four study sites. A main variable explaining these differences was the impact of mass trapping, whereby Ae. aegypti populations were consistently kept at very small levels throughout the years of the study. One of the two unmanaged sites was a lower-income neighborhood that showed the highest density and largest intra-annual variability of Ae. aegypti, possibly resulting from the types and abundance of containers producing mosquitoes. There were abundant rain-filled discarded containers in the large, shaded backyards in that study site that may explain the larger, rain-driven intra-annual mosquito variability as observed before (Barrera et al. 2006). Previous studies in PR showed higher productivity of Ae. aegypti in lower-income neighborhoods where discarded containers were more abundant than in middle-income neighborhoods (Barrera et al. 2021). Acknowledging socio-economic differences in Ae. aegypti productivity among sites is important to better interpret the effects of climate on the dynamics of both virus and mosquito populations.
The significant reductions in the populations of Ae. aegypti observed throughout the years of the study in the two managed sites complement previously published reports on the effects of mass trapping with AGO traps in the study sites (Barrera et al. 2014 a, b; 2017; 2019a). Previous studies conducted during and after the epidemics of chikungunya and Zika viruses also showed that the low levels of Ae. aegypti in managed sites were associated with significantly fewer positive mosquito pools with CHIKV and ZIKV and lower prevalence of arbovirus antibodies in residents than in unmanaged sites (Sharp et al. 2019). These results led us to propose a protective mosquito density threshold of less than three gravid females of Ae. aegypti per AGO trap per week (Barrera et al. 2017; 2019a, c) that can inform planning and evaluation of mosquito control programs.
The results showed well-defined seasonal weather patterns of temperature, rainfall, and relative humidity in the study sites, with a drier and cooler season from December–April, a smaller rainfall peak around May in most years, and warmer and wetter conditions from August–November, as expected from previous studies (Barrera 2010; Jury et al. 2007). Populations of Ae. aegypti reached maximum seasonal values during the wetter and warmer months of the year, which is the period when arbovirus epidemics occur (Barrera et al. 2011; Islam et al. 2021; Moore et al. 1978).
The main findings on the effects of El Niño on local weather were a significant association with severe droughts and a sharper increase of air temperature from the dry to the wet season in the study sites. These findings agree with previous studies highlighting the association of El Niño and droughts in the Caribbean (Giannini et al. 2000; Herrera et al. 2020). Drought intensity was negatively correlated with monthly rainfall and relative humidity, but there was no correlation with temperature. Interestingly, we did not find any correlation between values of concurrent or lagged ONI or drought intensity with Ae. aegypti abundance in unmanaged study sites. The significant positive association between lagged ONI (2–4 mo.) and drought (0–2 mo.) with Ae. aegypti abundance in the managed sites is difficult to interpret because one of the unmanaged sites (PL) was next to a managed site (LM), with seemingly the same weather. One explanation could be that people increased water storage during drought conditions (Rigau et al. 2001), but it should also have happened in unmanaged sites. The lack of negative impacts of droughts on Ae. aegypti populations is most likely because people keep a variety of containers with water where this mosquito undergoes immature development (Barrera et al. 2006). Results of simulation studies of dengue cases in Puerto Rico (2010–2013) suggested that manually filled containers are more important during drier years (Morin et al. 2015).
The impact of major hurricanes during La Niña conditions (Hurricanes Irma and Maria, September 2017) on mosquito populations in various municipalities in Puerto Rico that included data from the four study sites was previously published (Barrera et al. 2019b). There was a sharp increase in Ae. aegypti populations five weeks after the hurricanes in the four study sites and in a city in central Puerto Rico. The increases following the hurricanes resulted from the accumulation of water in debris coming from cleaning activities. The reduction of Ae. aegypti populations in one of the unmanaged sites following the hurricanes was possible the result of backyard cleaning.
Arboviral cases in the municipalities of the study sites were positively correlated with both lagged ONI (lags 6–11 mo.) and drought intensity (lags 5–12 mo.), which seems consistent with observations that dengue epidemics frequently, although not always, occur during the El Niño plus one year in the Caribbean (Amarakoom et al. 2008) and in Puerto Rico (CDC, unpublished). Lagged effects of ONI and drought intensity seem to be more related to the ZIKV epidemic (2016–17) than the CHIKV (2014–15) epidemic since the latter was registered concurrently with the emergence of El Niño in 2014. There were also significant positive correlations between arboviral cases and lagged Ae. aegypti abundance (lags 9–10 mo.), mostly in unmanaged sites. These results seem to indicate that epidemic gestation occurs with many months in advance. This is possibly because for an epidemic to form, there needs to be geographical virus spread and local increases in transmission that may take that long to happen.. Thus, intense El Niño conditions and associated droughts seem to be an early indicator that appropriate conditions exist for epidemic transmission of arboviruses the following year in Puerto Rico. Ferreira et al. (2022) issued recommendations to intensify vector and other arbovirus control mechanisms as early as El Niño is detected in northeastern Brazil. Several studies have shown that warm El Niño conditions precede dengue epidemics by several months (Anyamba et al. 2019; Colon-Gonzalez et al. 2011; Kovats et al. 2003; Tipayamongkholgul et al. 2009; Vicenti-Gonzalez et al. 2018).
Even though we found significant lagged associations between arbovirus transmission and Ae. aegypti abundance, we did not find any direct or indirect effects of El Niño or related droughts on Ae. aegypti abundance related to the epidemic transmission of arboviruses observed in the study sites. Several explanations seem possible and are not mutually exclusive. The abundance of Ae. aegypti in unmanaged sites were well above the hypothetical mosquito density threshold for arbovirus transmission all year round. This process should facilitate inter-epidemic arbovirus circulation and geographical spread regardless of seemingly unusual adverse conditions such as intense droughts. Another important aspect of arbovirus transmission that may be just as important as mosquito abundance, but not studied here, is that Ae. aegypti females may survive longer, take more blood meals, and go through more gonotrophic cycles during the wet season, which would increase the potential to transmit arboviruses (Morin et al. 2013).
La Niña conditions showed opposite effects to El Niño, such as increased rainfall during the wet season and a sharper increase of relative humidity from the drier to the wetter season. Although not significant, there were more female Ae. aegypti in both dry and wet seasons during La Niña events. However, because La Niña usually follows El Niño, the peak of arbovirus epidemics is usually reached just before or concurrent with La Niña conditions, which may appear that epidemics are in phase with La Niña. Arbovirus cases usually decrease, and no epidemics seem to have formed during La Niña events in Puerto Rico (CDC, unpublished). Cooler conditions during winters in Puerto Rico may also contribute to decreased transmission during inter-epidemic periods.
One limitation of this study is that we followed Ae. aegypti populations in only four sites, so that the results cannot be extrapolated to the rest of Puerto Rico or elsewhere. However, results seem to point at patterns observed in other studies where the ecology of Ae. aegypti is driven by rainfall and human activities related to keeping containers with water, which seem to facilitate year-round elevated populations of this mosquito in urban areas. Another limitation of this longitudinal study is the relatively short time series of mosquito and disease data, with only two outbreaks of novel arboviruses causing epidemics across the Americas. However, because there were several ENSO events, storms, and droughts during the six years of the study, we had an opportunity to correlate seasonal and inter-annual weather changes with Ae. aegypti populations and arbovirus cases.
In conclusion, this study suggests that the warm phase of ENSO (El Niño) was significantly associated with concurrent severe drought conditions and with epidemics caused by arboviruses vectored by Ae. aegypti with a time lag of several months, but we did not find direct effects of El Niño or severe droughts on the populations of Ae. aegypti.
Acknowledgments
We acknowledge the residents of La Margarita, Villodas, Playa, and Arboleda and the personnel from the Office of Emergency Management of the municipalities of Salinas and Guayama for their cooperation over the years of the study, and Ms. Jomil M Torres from the Department of Health of Puerto Rico for her support with arbovirus data. We also thank the Entomology and Ecology Team at the Dengue Branch, CDC for their hard work and commitment: Juan F. Medina, Jesús Flores, Orlando González, Luis Rivera, Luis Pérez, Luis Ramírez, John E. Acevedo, Herick León, Damían Surén, Luis Alvarado, Alí Figueroa, José Maldonado, José Maysonet, Jeyson Díaz, and Eduardo Pérez.
Footnotes
Disclaimer
The findings and conclusions in this report are those of the authors and do not necessarily represent the official position of the Centers for Disease Control and Prevention.
References Cited
- Adams LE, Martin SW, Lindsey NP, Lehman JA, Rivera A, Kolsin J, Landry K, Staples JE, Sharp TM, Paz-Bailey G, et al. 2019. Epidemiology of Dengue, Chikungunya, and Zika Virus Disease in U.S. States and Territories, 2017. Am J Trop Med Hyg. 101:884–890. doi: 10.4269/ajtmh.19-0309. [DOI] [PMC free article] [PubMed] [Google Scholar]
- Amarakoon D, Chen A, Rawlins S, Chadee DD, Taylor M, and Stennett R. 2008. Dengue epidemics in the Caribbean- emperature indices to gauge the potential for onset of dengue. Mitig Adapt Strat Glob Change. 13:341–357. [Google Scholar]
- Anyamba A, Chretien JP, Britch SC, Soebiyanto RP, Small JL, Jepsen R, Forshey BM, Sanchez JL, Smith RD, Harris R, et al. 2019. Global disease outbreaks associated with the 2015–2016 El Niño event. Sci Rep. 13;9(1):1930. doi: 10.1038/s41598-018-38034-z. [DOI] [PMC free article] [PubMed] [Google Scholar]
- Anyamba A, Linthicum KJ, and Tucker CJ. 2001. Climate-disease connections: Rift Valley Fever in Kenya. Cad Saude Publica. 17 Suppl:133–140. doi: . [DOI] [PubMed] [Google Scholar]
- Barrera R 2010. Dengue and Aedes aegypti dynamics in Puerto Rico. Revista Biomedica (Mexico) 21: 179–195 [Spanish]. [Google Scholar]
- Barrera R, Amador M, and Clark GG. 2006. Application of the Aedes aegypti (Diptera: Culicidae) pupal survey technique in Puerto Rico. Am J Trop Med Hyg. 74: 290–302. [PubMed] [Google Scholar]
- Barrera R, Amador M, and Mackay AJ. 2011. Population dynamics of Aedes aegypti and dengue as influenced by weather and human behavior in San Juan, Puerto Rico. PLoS Negl Trop Dis. Dec;5(12):e1378. doi: 10.1371/journal.pntd.0001378. [DOI] [PMC free article] [PubMed] [Google Scholar]
- Barrera R, Amador M, Acevedo V, Hemme RR, and Felix G. 2014a. Sustained, area-wide control of Aedes aegypti using CDC Autocidal Gravid Ovitraps. Am. J. Trop. Med. Hyg. 91:1269–1276. doi: 10.4269/ajtmh.14-0426. [DOI] [PMC free article] [PubMed] [Google Scholar]
- Barrera R, Amador M, Acevedo V, Caban B, Felix G, and Mackay AJ. 2014b. Use of the CDC Autocidal Gravid Ovitrap to control and prevent outbreaks of Aedes aegypti (Diptera: Culicidae). J Med Entomol. 51:145–154. [DOI] [PMC free article] [PubMed] [Google Scholar]
- Barrera R, Acevedo V, Félix G, Hemme RR, Vazquez J, Munoz JL, and Amador M. 2017. Impact of autocidal gravid ovitraps on chikungunya virus incidence in Aedes aegypti (Diptera: Culicidae) in areas with and without traps. J Med Entomol. 54:387–395. doi: 10.1093/jme/tjw187. [DOI] [PMC free article] [PubMed] [Google Scholar]
- Barrera R, Amador M, Acevedo V, Beltran M, and Muñoz JL. 2019a. A comparison of mosquito densities, weather and infection rates of Aedes aegypti during the first epidemics of Chikungunya (2014) and Zika (2016) in areas with and without vector control in Puerto Rico. Med Vet Entomol. 33:68–77. doi: 10.1111/mve.12338. [DOI] [PMC free article] [PubMed] [Google Scholar]
- Barrera R, Felix F, Acevedo A, Amador M, Rodriguez D, Rivera L, Gonzalez O, Nazario N, Ortiz M, Muñoz JL, et al. 2019b. Impacts of hurricanes Irma and Maria on Aedes aegypti populations, aquatic habitats, and mosquito infections with dengue, chikungunya, and Zika viruses in Puerto Rico. Am. J. Trop. Med. Hyg. 100:1413–1420. doi: 10.4269/ajtmh.19-0015. [DOI] [PMC free article] [PubMed] [Google Scholar]
- Barrera R, Harris A, Hemme RR, Felix G, Nazario N, Muñoz-Jordan JL, Rodriguez D, Miranda J, Soto E, Martinez S, et al. 2019c. Citywide control of Aedes aegypti during the 2016 Zika epidemic by integrating community awareness, education, source reduction, larvicides, and mass mosquito trapping. J Med Entomol. 20:1–14. [DOI] [PMC free article] [PubMed] [Google Scholar]
- Barrera R, Acevedo V, and Amador M. 2021. Role of abandoned and vacant houses on Aedes aegypti productivity. Am. J. Trop. Med. Hyg. 104:145–150. 10.4269/ajtmh.20-0829. [DOI] [PMC free article] [PubMed] [Google Scholar]
- Carrington LB, Armijos MV, Lambrechts L, Barker CM, and Scott TW. 2013. Effects of fluctuating daily temperatures at critical thermal extremes on Aedes aegypti life-history traits. PLoS ONE 8(3): e58824. doi: 10.1371/journal.pone.0058824. [DOI] [PMC free article] [PubMed] [Google Scholar]
- Colón-González FJ, Fezzi C, Lake IR, Hunter PR. 2013. The effects of weather and climate change on dengue. PLoS Negl Trop Dis. 14;7(11):e2503. doi: 10.1371/journal.pntd.0002503. [DOI] [PMC free article] [PubMed] [Google Scholar]
- Ferreira HDS, Nóbrega RS, Brito PVDS, Farias JP, Amorim JH, Moreira EBM, Mendez ÉC, and Luiz WB. 2022. Impacts of El Niño Southern Oscillation on the dengue transmission dynamics in the Metropolitan Region of Recife, Brazil. Rev Soc Bras Med Trop. 6;55:e0671. doi: 10.1590/0037-8682-0671-2021. [DOI] [PMC free article] [PubMed] [Google Scholar]
- Gagnon AS, Bush ABG, and Smoyer-Tomic KE. 2001. Dengue epidemics and the El Niño Southern Oscillation. Clim. Res. 19: 35–43. [Google Scholar]
- Giannini A, Kushnir Y, and Cane MA. 2000. Interannual variability of Caribbean rainfall, ENSO, and the Atlantic Ocean. J Climate 13:297–311. doi: . [DOI] [Google Scholar]
- Gubler DJ, Reiter P, Ebi KL, Yap W, Nasci R, and Patz JA. 2001. Climate variability and change in the United States: potential impacts on vector- and rodent-borne diseases. Environ Health Persp. 109(suppl 2):223–233. [DOI] [PMC free article] [PubMed] [Google Scholar]
- Heft DE, and Walton WE. 2008. Effects of the El Niño--Southern Oscillation (ENSO) cycle on mosquito populations in southern California. J Vector Ecol. 33:17–29. doi: 10.3376/1081-1710(2008)335B17:eotens5D2.0.co;2. [DOI] [PubMed] [Google Scholar]
- Hemme RR, Smith EA, Felix G, White BJ, Diaz-Garcia MI, Rodriguez D, Ruiz-Valcarcel J, Acevedo V, Amador M, and Barrera R. 2021. Multi-year mass-trapping with Autocidal Gravid Ovitraps has limited influence on insecticide susceptibility in Aedes aegypti (Diptera: Culicidae) from Puerto Rico. J. Med. Entomol. 59(1):314–319. doi: 10.1093/jme/tjab162. [DOI] [PubMed] [Google Scholar]
- Herrera DA, Ault TR, Carrillo CM, Fasullo JT, Li X, Evans CP, Alessi MJ, and Mahowald NM. 2020. Dynamical characteristics of drought in the Caribbean from observations and simulations. J Climate 33: 0773–10797. doi: 10.1175/JCLI-D-20-0100.1. [DOI] [Google Scholar]
- Islam S, Haque CE, Hossain S, and Hanesiak J. 2021. Climate variability, dengue vector abundance and dengue fever cases in Dhaka, Bangladesh: a time-series study. Atmosphere. 12(7):905. doi: 10.3390/atmos12070905. [DOI] [Google Scholar]
- Jury MR 2008. Climate influence on dengue epidemics in Puerto Rico. Int J Environ Health Res. 18:323–334. doi: 10.1080/09603120701849836. [DOI] [PubMed] [Google Scholar]
- Jury M, Malmgren BA, and Winter A. 2007. Subregional precipitation climate of the Caribbean and relationships with ENSO and NAO. J Geophys Res. 112: D16107, doi: 10.1029/2006JD007541. [DOI] [Google Scholar]
- Kovats RS, Bouma MJ, Hajat S, Worrall E, and Haines A. 2003. El Niño and health. Lancet.362(9394):1481–1489. doi: 10.1016/S0140-6736(03)14695-8. [DOI] [PubMed] [Google Scholar]
- Kreppel K, Caminade C, Govella N, Morse AP, Ferguson HM, and Baylis M. 2019. Impact of ENSO 2016–17 on regional climate and malaria vector dynamics in Tanzania. Environ. Res. Lett. 14 075009. [Google Scholar]
- Lanciotti RS, Kosoy OL, Laven JJ, Panella AJ, Velez JO, Lambert AJ, and Campbell GL. 2007. Chikungunya virus in U.S. travelers returning from India. Emerg Infect Dis. 13:764–767. doi: 10.3201/eid1305.070015. [DOI] [PMC free article] [PubMed] [Google Scholar]
- Liyanage P, Tissera H, Sewe M, Quam M, Amarasinghe A, Palihawadana P, Wilder-Smith A, Louis VR, Tozan Y, and Rocklöv J. 2016. A spatial hierarchical analysis of the temporal influences of the El Niño-Southern Oscillation and weather on dengue in Kalutara District, Sri Lanka. Int J Environ Res Public Health. 13(11):1087. doi: 10.3390/ijerph13111087. [DOI] [PMC free article] [PubMed] [Google Scholar]
- Liyanage P, Tozan Y, Overgaard HJ, Aravinda Tissera H, and Rocklöv J. 2022. Effect of El Niño-Southern Oscillation and local weather on Aedes vector activity from 2010 to 2018 in Kalutara district, Sri Lanka: a two-stage hierarchical analysis. Lancet Planet Health. 6(7):e577–e585. doi: 10.1016/S2542-5196(22)00143-7. [DOI] [PubMed] [Google Scholar]
- Mackay AJ, Barrera R, and Amador M. 2013. An improved autocidal gravid ovitrap for the control and surveillance of Aedes aegypti. Parasit Vectors. 6;6(1):225. doi: 10.1186/1756-3305-6-225. [DOI] [PMC free article] [PubMed] [Google Scholar]
- Martin DA, Muth DA, Brown T, Johnson AJ, Karabatsos N, and Roehrig JT. 2000. Standardization of immunoglobulin M capture enzyme-linked immunosorbent assays for routine diagnosis of arboviral infections. J Clin Microbiol. 38(5):1823–1826. [DOI] [PMC free article] [PubMed] [Google Scholar]
- Morin CW, Comrie AC, and Ernst K. 2013. Climate and dengue transmission: evidence and implications. Environ Health Perspect. 121:1264–1272. doi: 10.1289/ehp.1306556. [DOI] [PMC free article] [PubMed] [Google Scholar]
- Morin CW, Monaghan AJ, Hayden MH, Barrera R, and Ernst K. 2015. Meteorologically driven simulations of dengue epidemics in San Juan, PR. PLoS Negl Trop Dis. 9(8):e0004002. doi: 10.1371/journal.pntd.0004002. [DOI] [PMC free article] [PubMed] [Google Scholar]
- Moore CG, Cline BL, Ruiz-Tibén E, Lee D, Romney-Joseph H, and Rivera-Correa E. 1978. Aedes aegypti in Puerto Rico: environmental determinants of larval abundance and relation to dengue virus transmission. Am J Trop Med Hyg. 27:1225–1231. doi: 10.4269/ajtmh.1978.27.1225. [DOI] [PubMed] [Google Scholar]
- NDMC 2022. North American Drought Monitor. National Drought Mitigation Center, University of Nebraska-Lincoln, United States Department of Agriculture, and National Oceanic and Atmospheric Administration. [accessed March 1, 2022). https://droughtmonitor.unl.edu/DmData/DataDownload/ComprehensiveStatistics.aspx. [Google Scholar]
- NOAA. 2022. Monthly Oceanic El Niño Index (ONI). NOAA’s National Weather Service. [accessed March 1, 2022). (http://www.cpc.ncep.noaa.gov/products/analysis_monitoring/ensostuff/ensoyears.shtml). [Google Scholar]
- Philander S 1983. El Niño Southern Oscillation phenomena. Nature. 302, 295–301. 10.1038/302295a0. [DOI] [Google Scholar]
- Pielke RA Jr, and Landsea CN. 1999. La Niña, El Niño, and Atlantic hurricane damages in the United States. Bull Am Meteorol Soc. 80:2027–2034. doi:. [DOI] [Google Scholar]
- Rigau-Pérez JG, Vorndam AV, and Clark GG. 2001. The dengue and dengue hemorrhagic fever epidemic in Puerto Rico, 1994–1995. Am J Trop Med Hyg. 64:67–74. doi: 10.4269/ajtmh.2001.64.67. [DOI] [PubMed] [Google Scholar]
- Ropelewski CF, and Halpert MS. 1987. Global and regional scale precipitation patterns associated with the El Niño/Southern Oscillation. Monthly weather review, 115:1606–1626. doi:. [DOI] [Google Scholar]
- Rueda LM, Patel KJ, Axtell RC, and Stinner RE. 1990. Temperature-dependent development and survival rates of Culex quinquefasciatus and Aedes aegypti (Diptera: Culicidae). J Med Entomol. 27:892–898. doi: 10.1093/jmedent/27.5.892. [DOI] [PubMed] [Google Scholar]
- Santiago GA, Vázquez J, Courtney S, Matías KY, Andersen LE, Colón C, Butler AE, Roulo R, Bowzard J, Villanueva JM, et al. 2018. Performance of the Trioplex real-time RT-PCR assay for detection of Zika, dengue, and chikungunya viruses. Nat. Commun. 11;9(1):1391. doi: 10.1038/s41467-018-03772-1. [DOI] [PMC free article] [PubMed] [Google Scholar]
- Santiago GA, Vergne E, Quiles Y, Cosme J, Vazquez J, Medina JF, Medina F, Colón C, Margolis H, and Muñoz-Jordán JL. 2013. Analytical and clinical performance of the CDC real time RT-PCR assay for detection and typing of dengue virus. PLoS Negl Trop Dis. 11;7(7):e2311. doi: 10.1371/journal.pntd.0002311. Erratum in: PLoS Negl Trop Dis. 2013;7(7). doi:. [DOI] [PMC free article] [PubMed] [Google Scholar]
- Sharp TM, Lorenzi O, Torres-Velásquez B, Acevedo V, Pérez-Padilla J, Rivera A, Muñoz-Jordán J, Margolis HS, Waterman SH, Biggerstaff BJ, et al. 2019. Autocidal gravid ovitraps protect humans from chikungunya virus infection by reducing Aedes aegypti mosquito populations. PLoS Negl Trop Dis. 13(7): e0007538. 10.1371/journal. [DOI] [PMC free article] [PubMed] [Google Scholar]
- Stewart-Ibarra AM, and Lowe R. 2013. Climate and non-climate drivers of dengue epidemics in southern coastal Ecuador. Am J Trop Med Hyg. 88:971–981. doi: 10.4269/ajtmh.12-0478. [DOI] [PMC free article] [PubMed] [Google Scholar]
- Tipayamongkholgul M, Fang CT, Klinchan S, Liu CM, and King CC. 2009. Effects of the El Niño-southern oscillation on dengue epidemics in Thailand, 1996–2005. BMC Public Health. 9:422. doi: 10.1186/1471-2458-9-422. [DOI] [PMC free article] [PubMed] [Google Scholar]
- Tran BL, Tseng WC, Chen CC, and Liao SY. 2020. Estimating the threshold effects of climate on dengue: a case study of Taiwan. Int J Environ Res Public Health. 17(4):1392. doi: 10.3390/ijerph17041392. [DOI] [PMC free article] [PubMed] [Google Scholar]
- Tun-Lin W, Burkot TR, and Kay BH. 2000. Effects of temperature and larval diet on development rates and survival of the dengue vector Aedes aegypti in north Queensland, Australia. Med Vet Entomol. 14:31–37. doi: 10.1046/j.1365-2915.2000.00207.x. [DOI] [PubMed] [Google Scholar]
- USDM 2022. United States Drought Monitor. National Drought Mitigation Center, University of Nebraska-Lincoln, United States Department of Agriculture, and National Oceanic and Atmospheric Administration. [accessed March 1, 2022]. [Google Scholar]
- Vandaele W 1983. Applied time series and Box-Jenkins models. Academic Press, Inc. New York, NY. [Google Scholar]
- Vincenti-Gonzalez MF, Tami A, Lizarazo EF, and Grillet ME. 2018. ENSO-driven climate variability promotes periodic major outbreaks of dengue in Venezuela. Sci Rep. 8(1):5727. doi: 10.1038/s41598-018-24003-z. [DOI] [PMC free article] [PubMed] [Google Scholar]