

Abstract
Target class profiling (TCP) is a chemical biology approach to investigating understudied biological target classes. TCP is achieved by developing a generalizable assay platform and screening curated compound libraries to interrogate the chemical biological space of members of an enzyme family with clinical and biological importance. In this work we took a TCP approach to investigate inhibitory activity across a set of small molecule methyltransferases, a subclass of methyltransferase enzymes, with the goal of creating a launchpad to explore this largely understudied target class. Using the representative enzymes nicotinamide N-methyltransferase (NNMT), phenylethanolamine N-methyltransferase (PNMT), histamine N-methyltransferase (HNMT), glycine N-methyltransferase (GNMT), catechol O-methyltransferase (COMT), and guanidinoacetate N-methyltransferase (GAMT), we optimized high-throughput screening (HTS)-amenable assays to screen 27,574 unique small molecules against all targets. From this dataset we identified a novel inhibitor which selectively inhibits the small molecule methyltransferase HNMT and demonstrated how this platform approach can be leveraged for a targeted drug discovery campaign using the example of HNMT.
Introduction
Target class profiling (TCP) is a chemical biology approach for probe development, which is complementary to traditional disease-focused drug discovery 1. There are several key differences in the goals and outcomes of target class profiling versus disease-focused drug discovery. Target class profiling takes a broad approach by simultaneously studying multiple members of an enzyme family with clinical and biological relevance, whereas disease-focused drug discovery is a high-risk, high-reward endeavor focused on a single target 2, 3. The desired outcome for target class profiling is generation of specialized knowledge for a target class through structure-activity relationship (SAR) profiling using defined compound libraries, while disease-focused drug discovery aims for a clinically viable and marketable compound. Effectively, target class profiling emphasizes platform creation for a family of proteins, agnostic of a specific target, over product development.
The target agnostic nature of target class profiling has two key benefits. First, this philosophy makes target class profiling amenable to including understudied targets within the target class study, which aligns with efforts such as Target 2035 to create probes (tool molecules) for all human proteins 4. Second, the SAR profiles generated can be leveraged as a launchpad to jumpstart multiple probe development or target-focused drug discovery campaigns within the target class. A target class is a family of enzymes which are structurally and functionally related1. The best-studied target classes are kinases5–7 and GPCRs8, 9. Methyltransferases (MTases) in general are considered an ‘emerging’ target class with small molecule methyltransferases (SMMTases) constituting an understudied subset of this target class2, 10–14. In this work we apply target class profiling to SMMTase with the goal of creating a launchpad for methyltransferase probe development.
MTases are a family of enzymes which catalyze the transfer of a methyl group from a cofactor (typically S-adenosylmethionine, SAM) to a protein, nucleic acid, or small molecule substrate, with the concomitant production of S-adenosyl homocysteine (SAH) 13, 15. MTases are functionally classified by the atom of the substrate to which the methyl group is transferred. The most common types of MTases are O- and N-MTases, which affix methyl groups to oxygen and nitrogen atoms, respectively, with S-, C-, and metal MTases also existing. 12, 16. SMMTases primarily include O- and N-MTases, but some S- and C-MTases have been described. Across the human methyltransferome, SMMTases are found scattered about the various MTase clades, suggesting substrate type-preference is disconnected from primary amino acid sequence (Figure 1A) 17, 18. The core catalytic domain tertiary structure of SMMTases is conserved, primarily falling into the Rossman-like fold of Class I MTases12, 16, 19. The major structural differences of SMMTases occur in the substrate binding pocket where solvent accessibility and binding pocket volume are varied (Figure 1C) or in structural additions inserted into loops, which contribute to active site accessibility. The SAM-binding pocket for MTases is highly conserved as is the catalytic mechanism of methyl transfer15.
Figure 1.

Small molecule methyltransferases comprise a diverse subset of methyltransferases. A) Dendrogram of human methyltransferases. Methyltransferase sequences were retrieved from UniProt and aligned using ClustalW. Dendrogram image was produces using ITOL. Larger nodes were collapsed into triangles. Green paths lead to small molecule methyltransferases. MTase names highlighted in green indicate those used in this study. B) General reaction diagram for methyltransferases which use SAM as a methyl donor. Also shown are biochemical reactions for the SMMTases used in this study: NNMT, COMT, PNMT, HNMT, GNMT, and GAMT. C) Structures of SMMTases reveal a large variation in solvent-accessible space (grey surfaces) among the representative enzymes used in this study. Alpha carbon RMSD for all structures is 1.59 Å. PDB IDs: HNMT (1JQD), GNMT (1R74), PNMT (2AN4), GAMT (3ORH), NNMT (4ROD), COMT (5LSA).
MTases have long been an enticing target class because of their association with diseases ranging from cancer to neurological disorders to metabolic syndromes 2, 10, 11, 17, 19, 20. Most MTases act as epigenetic regulators, either by modifying protein and nucleic acid substrates to directly modulate gene accessibility, or alternatively via consumption of SAM thus depleting the cellular methyl pool available and shifting the balance of methylated genes 15, 17, 19, 21–23. SMMTases act on small molecule substrates (also referred to as metabolic substrates) to influence signaling pathways or metabolic flux. The best-known SMMTase is perhaps catecholamine O-methyltransferase (COMT), which methylates catechol-containing small molecules to terminate adrenaline signaling pathways and metabolize drugs and other xenobiotics 20, 24–27. Inhibition of COMT activity by the FDA-approved drugs tolcapone and entacapone is a key component of combinatorial drug therapies for Parkinson’s disease20, 25. Other notable functions of SMMTases include the termination of adrenaline signaling pathways by phenolethanolamine N-methyltransferase (PNMT) 28, 29, detoxifying xenobiotics (drug metabolism) by thiopurine S-methyltransferase (TPMT) 30, 31, and managing the available methyl pool for all MTase activity by glycine N-methyltransferase (GNMT)32, 33. Despite their central roles in biological processes, SMMTases constitute a target class of viable and largely understudied therapeutic targets.
In this work we created a target class profiling platform for SMMTases. Enzymatic assays were developed for PNMT, nicotinamide N-methyltransferase (NNMT), COMT, histamine N-methyltransferase (HNMT), GNMT, and guanidinoacetate N-methyltransferase (GAMT), adapted to 1536-well plate assays for automated screening, and all six assays were screened against 27,574 compounds. This set of compounds was refined to 1,498 active compounds (against at least one SMMTase), which had their activity confirmed across the target class and a counter-assay. From these 1,498 compounds we identified a HNMT-selective chemotype, which we present as a case study stemming from these target class studies.
Results and Discussion
HTS Assay Development
Creating an assay platform for target class profiling required selection of representative members of the target class. We were able to source and confirm enzymatic activity and purity for the SMMTases NNMT, PNMT, COMT, HNMT, GNMT, and GAMT, and selected them as representative SMMTases for this study (Figure S1). Each of these SMMTases use SAM as a methyl donor cofactor but act on a variety of biological substrate (Figure 1B). The solvent accessible space in the active site widely varies across these six enzymes (Figure 1C).
To develop a generalizable HTS assay platform we used the MTase-Glo kit (Promega) to measure the production of SAH, a product common to all MTases being studied. The MTase-Glo system is a proprietary coupled-enzyme reagent that converts SAH to ATP through a series of enzymatic reactions including SAH hydrolase, polyphosphate-AMP phosphotransferase, and adenosine kinase34. ATP generation is monitored using a luciferase/luciferin bioluminescent reaction, ultimately generating a luminescent signal proportional to the SAH concentration and therefore MTase enzymatic activity. For each enzyme we determined the optimal biochemical assay conditions according to standard HTS practices35. KM values for each substrate and the SAM cofactor were determined using the method of initial rates (Figures 2A, B, S2, S3, Table 1). Each of the determined values were comparable to published KM values28, 36–41. We determined the 20% product formation time for each assay using substrate and cofactor at KM concentrations to select an assay time window (PNMT example in Figure 2C). To ensure the assays were sensitive to inhibition, we tested each SMMTase against the non-specific MTase inhibitor sinefungin in 11-point dose response (Figure 2D). All MTases except GNMT were inhibitable at concentrations tested (up to 50 μM). A MTase-Glo counter-assay was developed to identify false-positive hits inhibiting the coupled reporter assay. The counter-assay was developed by directly adding 1 μM SAH (correlating to 10–20% product conversion for MTase biochemical assays) to the MTase-Glo reaction in place of an enzyme, and the counter-assay was not inhibited by sinefungin.
Figure 2.

Biochemical assay development for PNMT shown as a representative example. A) KM for PNMT substrate norepinephrine was determined using the method of initial rates to determine Michaelis constants. Data were plotted and fitted to a substrate inhibition model using GraphPad prism. SAM was held constant at 100 uM. B) KM for SAM was determined as described in A. Norepinephrine was held constant at 100 μM. C) Reaction time course at 30 nM, 15 nM, and 7.5 nM PNMT were performed with SAM and norepinephrine at KM concentrations to determine when 10–20% conversion was achieved. At 30 nM PNMT the reaction begins to plateau at 50 min and 20% conversion was estimated at 20 min. D) All SMMTases used in this project were tested against sinefungin, a non-specific positive control MTase inhibitor.
Table 1.
Michaelis-Menten constants were determined for the substrates and SAM cofactor of HNMT, GNMT, PNMT, COMT, NNMT, and GAMT using the method of initial rates.
| SMMTase | Substrate | KM, substrate, μM | KM, SAM, μM |
|---|---|---|---|
| HNMT | Histamine | 5.3±2.1 | 9.3±2.1 |
| GNMT | Glycine | >500 | 12.1±3.6 |
| PNMT | Norephinephrine | 16.2±4.3 | 3.6±0.6 |
| COMT | Norephinephrine | 13.7±2.2 | 14.5±1.8 |
| NNMT | Nicotinamide | 3.8±0.5 | 11.9±5.7 |
| GAMT | Guanidinoacetate | 2.5±0.6 | 5.6±0.8 |
Compound Set Selection
Selecting and characterizing the appropriate compound libraries is key to developing a target class profile1, 5. The compound libraries tested need to balance chemical diversity and chemical relatedness. To this end we selected two diversity libraries (used to identify starting points for medicinal chemistry programs) in our collection based on the chemical space sampled and physical properties of the compound sets (Figure 3). We also selected two annotated libraries containing compounds with known pharmacologic mechanisms of action to approach the concepts of “relatedness and diversity” from a biological perspective. The chemical diversity libraries selected were the NCATS Genesis MiniMe collection (9,856 compounds) and a commercial MTase Library (11,000 compounds, ChemDiv, San Diego, CA). The annotated libraries we used were developed in-house: NPACT (5,099 compounds), a collection of pharmacologically active compounds and natural products, and LOPAC-Epi (1,619 compounds), a combination of LOPAC 1280 compounds that are used to validate new drug discovery assays and characterize orphan receptors, with the addition of 339 epigenetic inhibitors. The resulting collection consisted of 27,574 unique compounds (with some overlap in compounds between libraries) selected for efficient and robust coverage of chemical and biological properties. The compounds selected cover a wide range of chemical space (Figure 3A) despite the majority of compounds aligning with Lipinki’s “rule of 5s”42 (Figure 3B–D).
Figure 3.

Screening library selection. Four compound libraries were selected to develop the SMMTase target class profile. A) Principal component analysis describing the overall chemical diversity of the annotated libraries (NPACT and LOPAC-Epi) and the chemical diversity libraries (Genesis and MTase). B) Molecular weight distribution of compounds in each compound set. C) Total polar surface area distribution in each library. D) Hydrophobicity plot of all libraries.
Primary Screen and Assay Performance
The six MTase targets NNMT, HNMT, COMT, PNMT, GNMT, and GAMT were screened in 1536-well plates using the established assay protocols against 27,574 compounds at a single concentration of 40 μM. Compounds which showed at least 50% inhibition against at least one SMMTase were selected for follow-up testing in 11-point dose-response against all six MTase assays plus the counter assay (Figure 4A). In this way, all hit compounds were tested twice (HTS at single concentration and cherry-pick follow-up) across the entire assay set. The Z` for all assay plates was between 0.8 and 0.9 with few exceptions (Figure 4B). Signal-to-background (S:B) values (positive signal control: full biochemical reaction, negative signal control: no addition of substrate were typically between 4 and 10, with variation in S:B outside that range not affecting Z’ assay quality (Figure 4C). All assay QC values indicate a robust and well-performing set of assays according to standard HTS practices43.
Figure 4.

High-throughput screening overview and assay performance. A) A total of 27,574 compounds were screened against NNMT, HNMT, COMT, PNMT, GNMT, and GAMT for MTase inhibition. The initial screen was performed at a concentration of 40 μM, and hits were scored based on a maximum response cut-off of −50, indicating >50% inhibition. 1,498 compounds met this criteria and were then assayed against each MTase and counter-assay in 11-point dose response. Final hits were selected on the basis of maximum response (< −50), Log(AC50) < −4.5, and curve class (−1.1, −1.2, −2.1, −2.2 – see Methods for explanation of curve class categories). B) Z` for all 1536-well assay plates in the primary screen, calculated from 32 positive- and negative-control wells on each plate. C) Signal-to-background (S/B) for all plates in the primary screen calculated from 32 positive- and negative-control wells on each plate.
In the primary screen of 27,574 compounds, a hit was defined as any compound with at least 50% inhibition. HNMT had the highest initial hit rate of 483 compounds (1.75%) while GAMT had the lowest at 90 compounds (0.33%) (Figure 5B). The rank order for initial hits was HNMT (1.75%) > NNMT (1.29%) > COMT (1.07%) > GNMT (0.97%) > PNMT (0.74%) > GAMT (0.33%). From these hits across all six HTS assays we identified 1,498 unique compounds, which were selected for confirmation- and counter-screening. Activity confirmation for these 1,498 cherrypicked compounds was performed in 11-point dose response (top dose 40 μM, 1:3 serial dilutions) against COMT, HNMT, NNMT, GNMT, PNMT, GAMT, and a counter-assay which used 1 μM SAH in place of enzyme. From these dose-response curves we then separated active compounds into two groups: high quality actives and low-quality actives. High quality actives are compounds with complete dose-response curves, a maximum inhibition of over 50%, and IC50 < 10 μM. Low quality actives produced incomplete curves or single point activity, but their inclusion in the overall analysis could lend insight into chemical features important for selection/exclusion of members of this target class.
Figure 5.
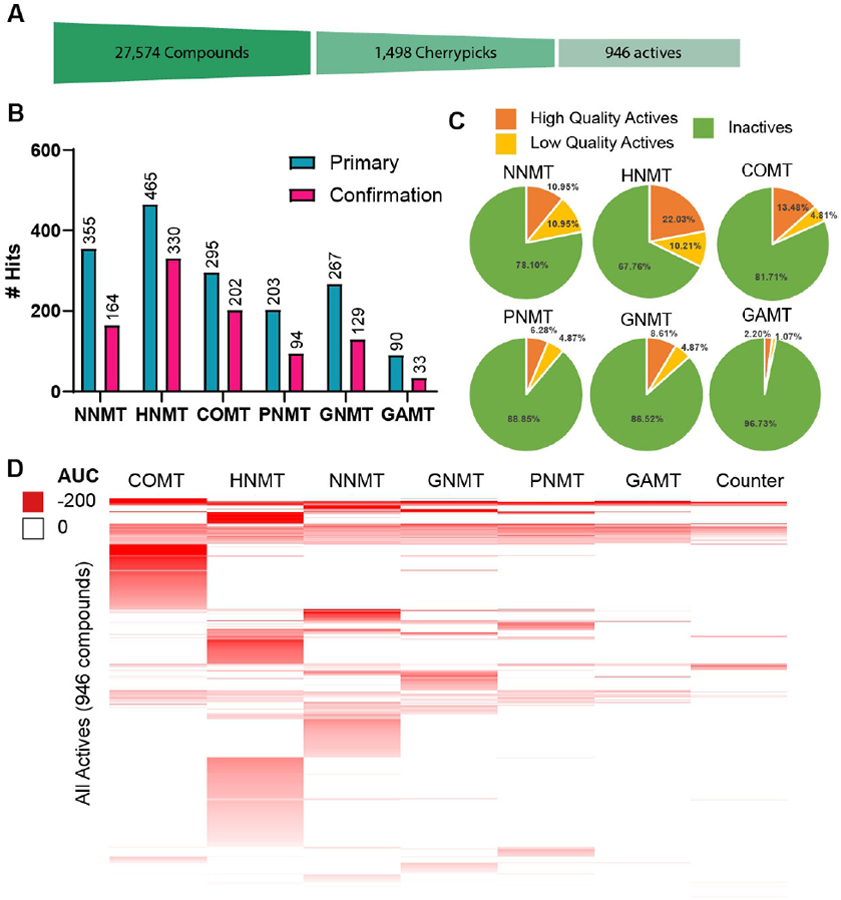
Hit rates for cherrypicked compounds. A) Cartoon depiction of the funnel-down approach to identifying hits. A total of 27,574 unique compounds were screened and 1,498 compounds were identified as initial hits suitable for cherrypicking. Out of those initial hits a total of 946 unique compounds were confirmed across each MTase assay. B) Initial hits for each SMMTase (turquoise) and confirmed hits (magenta). Note that hit numbers do not account for specificity, which is reflected in D. C) 1,498 compounds from the primary screen were selected for cherrypicking. Each compound was assayed against each Mtase and a counter assay in 11-point dose response. Hits were the identified as high-quality actives (complete dose-response curves, max Response ≤ −50, and IC50 ≤ 10 μM), low quality actives (shallow curves, single-point activity, or inconclusive), or inactive. D) Heat map showing activity profile of all active compounds against COMT, HNMT, NNMT, GNMT, PNMT, GAMT, and the counter assay. Compounds in this heat map are clustered by total activity across all seven assays.
Out of the 1,498 cherrypicked compounds, a total of 946 unique compounds had their activity reconfirmed in the dose response format (Figure 5B). 73 compounds were active in the counter assay (7.7%), 13 with IC50 values below 10 μM, and were excluded from further analyses. 552 cherrypicked compounds (36.7%) failed to reconfirm. Again, HNMT had the greatest number of high-quality active compounds (330/1,498 compounds, 22.03%) for a final hit rate of 330/27,574 (1.20%). GAMT had the lowest number (33/1,498 high-quality actives, 2.2%) for a final hit rate of 33/27,574 compounds, or 0.12%. The confirmed hit rate (relative to full compound set of 27,574 molecules) rank order shifted to HNMT (1.20%) > COMT (0.73%) > NNMT (0.59%) > GNMT (0.47%) > PNMT (0.34%) > GAMT (0.12%).
To consider the broader-scale perspective on these hit compounds we collapsed each dose response curve to a single area-under-the-curve (AUC) value and generated a heat map summary of the general activity data (Figure 5D). Lower AUC values indicate more potent and efficacious inhibitors of a given enzyme. From this heat map one can quickly survey which enzymes had selective hits. For example, COMT had 274 total hits and 148 of these compounds were specific to COMT. HNMT (219/483 specific hits) and NNMT (92/328 specific hits) also had high specific hit rates. Conversely enzymes like GNMT (51/202 specific hits), PNMT (31/167 specific hits), and GAMT (1/49 specific hits) had low specific hit rates. These data could be used to inform future target screening campaigns. One could draw conclusions such as HNMT, COMT, and NNMT are the most “druggable” targets based on the high overall hit rates and high specificity hit rates. GNMT, PNMT, and GAMT, on the other hand, may present more challenging targets for drug development because of their low overall and specific hit rates. These hit rate and specificity analyses make up one angle of these SMMTase target class profiles.
Chemical clustering analysis
To generate more detailed target class profiles of our SMMTases we grouped compounds by chemical similarity using Tanimoto coefficients as a metric for chemical relatedness. We then plotted the activity of each compound against each SMMTase as AUC values and generated a heat map to survey structure-activity relationships (Figure 6A). A block of compounds active against a single SMMTase indicates a chemotype suitable for a potential starting point for probe development. Data can also be quickly surveyed for non-specific inhibitors, which show activity across multiple members of the family.
Figure 6.

A) Cluster analysis of Diversity Library hits. Compounds were clustered according to chemical similarity (based on Tanimoto coefficient) and a heat map was generated to show relative activity. Chemical clusters with high activity, such as the HNMT selective cluster (blue) reveal selective chemotypes for a single SMMTase. Bands of high activity indicate pan inhibitors of the representative SMMTases (green). B) Chemotype of top HNMT-selective hit enables cheminformatic R-group decompositions. R group decomposition was performed using TIBCO Spotfire (TIBCO Software Inc.). Compound activity (displayed as area under the curve, AUC) was plotted as a function of R2 functional group identity. R1 group identity is color coded blue for hydrogen and orange for methoxy. C) The R2 group in NCGC00411246 yields a highly active and specific compounds. R groups which result in reduced specificity (e.g., NCGC00411220) or reduce activity (e.g., NCGC00411154) we also observed.
HNMT-specific compounds as a launchpad for drug discovery
One of the ways target class profiling can be leveraged is as a launchpad for more in-depth, target-focused drug development. HNMT was selected as an example because of the relatively high general and specific hit rates in our collections (Figure 5B). We identified a chemotype of HNMT-selective compounds, which all contained a 2,3,4,5-tetrahydro-1H-pyrido[4,3-e][1,4]diazepine core (Figure 6B). These compounds were all from the Genesis MiniMe library (9,856 compounds), which is a subsampling of the NCATS internal diversity collection (>100,000 compounds). We did further SAR expansions using the 2,3,4,5-tetrahydro-1H-pyrido[4,3-e][1,4]diazepine core as a substrate query to search against our NCATS screening collection and identified 254 additional compounds which were not part of the initial screening set. Each of these compounds was tested in 11-point dose response against HNMT. All hit compounds were tested for selectivity against all SMMTase assays and counter-screened for assay interference. We identified a sub-chemotype of the original diazepine core with 22 compounds that inhibited HNMT (Figure 6B). R-group decomposition allowed us to perform preliminary structure-activity analysis to investigate the influence of functional groups on activity and specificity. For example, our best hit contained a methyl-imidazole group at the R2 position (Figure 6C). Introduction of a phenyl ring at R2 not only results in lower activity, but also loss of specificity for HNMT.
Hit validation and orthogonal assay
Hit validation by confirming the identity and activity of hit compounds in an orthogonal assay is vital for accurately determining real hits in a drug screening campaign. We selected four compounds to demonstrate the importance of hit validation in HTS. Two compounds are the most active HNMT-selective compounds (NCGC00411044 and NCGC00411044) and two are compounds which showed activity against all of the SMMTases tested, but gave conflicting results in the two counter-assay replicates (NCGC00519772 and NCGC00519779). Fresh powders of each compound were acquired and the identity of each compound confirmed by LC-MS (Table S2 and NMR (Figures S4–S7). These compounds were then tested against HNMT, NNMT, GNMT, PNMT, and COMT using the same enzyme concentration, substrate and SAM concentration, and reaction times as the MTase glo assay but using an LC/MS readout. We were unable to measure GAMT activity in this assay format and thus excluded it from further analysis.
Orthogonal assays are essential to confirm that an identified hit in HTS is not due to artefactual activity in the primary assay. LC-MS is advantageous as a label-free method for measuring enzyme activity and inhibition free of the assay interference which plagues spectroscopic methods and coupled assays. The LC-MS method developed used a SAH-d4 internal standard to monitor the production of SAH for each MTase (Figure 7A). As proof-of-concept we tested the known COMT inhibitor drugs entacapone and tolcapone, and measured IC50 values comparable to reported values (Figure S8).
Figure 7.

MS Assay. A) Sample trace of HNMT inhibitor NCGC00411044. Top trace represents SAH signal generated during HNMT enzymatic reaction in the presence of inhibitor. Bottom chromatogram represents that 100 nM SAH-d4 internal standard added to each sample. B) Dose response curves generated from LC-MS analysis of HNMT-specific inhibitors (NCGC00411044 and NCGC00411246) and PAINS compounds (NCGC00519772 and NCGC00519779). SAH/SAH-d4 ratio was normalized to an uninhibited sample for each enzyme (n=3). C) Structure of best HNMT hits and comparison of the IC50 values between MTase Glo and MS assays.
The HNMT inhibitors NCGC00411044 and NCGC00411246 demonstrated inhibition of HNMT in the MS assay (Figure 7B). No response was observed for the other SMMTases COMT, NNMT, PNMT, and GNMT. The measured IC50 values for NCGC00411246 were comparable between the MTase Glo and MS assay, 2.29 μM and 2.53 μM, respectively (Figure 7C). We observed a lower IC50 for NCGC00411044 in the MS assay (670 nM) over the MTase Glo assay (2.45 μM). The false-compounds NCGC00519772 and NCGC00519779, identified as giving inconclusive results during HTS follow-up, did not inhibit any SMMTase in the MS assays, confirming they were PAINS compounds rather than novel pan-inhibitors (Figure 7B).
Docking of HNMT hit compound NCGC00411044
After validating the specificity of HNMT selective hit NCGC00411044 we wanted to investigate a docking model NCGC00411044 (Figure 8). In lieu of crystallographic structures of a compound bound to a target, docking simulations can offer SAR insight into binding modes and assist in deciding next steps for lead optimization. Docking was performed using an X-ray crystal structure of HNMT (PDB code: 1JQD) bound to the SAM cofactor and the substrate histamine (Figure 8A). Based on the crystal structure, the adenine core of SAM forms H-bond interaction with Ser120, the hydroxyls on the sugar part form multiple H-bonds with Gly60 Glu89, and Gln94. The terminal -NH2 group also forms H-bond interactions with the Gly60 and Ile142 backbone carbonyl oxygen. The docking model of NCGC00411044 revealed that the pyridine nitrogen maintains the key interaction with Ser120, which mimic the interaction mode of SAM, and the diazepine core forms two H-bonds with the surrounding residues Gly60 and Gln143 (Figure 8B–D). In addition, the thiophene moiety is positioned into a relatively hydrophobic pocket with pi-stacking to several residues with aromatic side chains including Tyr15, Phe19, Phe22, Gln143, Tyr146 and Tyr147.
Figure 8.

A) Co-crystal structure of HNMT (PDB ID: 1JQD) cofactor SAM is showing in green stick mode and the substrate histamine is showing in orange stick mode. B) and C) Docking model of the screening hit NCGC00411044 at SAM binding pocket. NCGC00411044 is showing in cyan stick mode. D) 2D ligand-protein interaction map to show the specific H-bond interaction and pi-stacking interactions. The molecular surface of the binding site is depicted in hydrophobicity contour (hydrophilic = purple; lipophilic=green), and the dotted lines indicate H-bond interactions. Figures are prepared using Molecular Operating Environment (MOE) computational software.
This docking hypothesis was corroborated by the SAR expansion data set (Table S1). In brief, with the highly conserved diazepine core, compounds with both pyridine and terminal aromatic ring on the other side (NCGC00411145, NCGC00411246, NCGC00411044, and NCGC00411168) showed best activity as they can interact with Ser120 and form potential multiple pi-stacking with the aromatic side chains. From the binding model, the position of the pyridine ring nitrogen also impacts compound activity, missing the nitrogen (NCGC00411199, NCGC00411050 and NCGC00411115) or nitrogen at the para-position (NCGC00411201 and NCGC00411196) cause at least 10-fold potency loss. On the other hand, the aromatic thiophene in NCGC00411044 forms strong pi-pi interactions with the surrounding residues, so analogs missing this aromatic moiety (NCGC00411147, NCGC00411078, and NCGC00411229) also resulted in potency loss. Finally, if the compounds are completely lacking these two types of critical interactions, they showed no activity in the biochemical assays. These findings are highly consistent with the docking hypothesis.
The data presented herein represent groundbreaking work in applying systematic TCP to SMMTases enzymes. Our goal was to establish a launchpad to for probe development. The assays developed, compound libraries, and informatics capabilities described herein constitute a platform for target class profiling of SMMTases. By screening four libraries (totaling 27,574 compounds) across the SMMTases PNMT, HNMT, GNMT, NNMT, GAMT, and COMT we created activity profiles for this target class, which can be leveraged for development of tool molecules and targeted screening campaign.
We also developed orthogonal MS-based assays for confirming hit compounds identified in target class profiling. While the luminescent MTase Glo coupled assay is amenable to HTS and is easily counter-assayed to exclude interfering (false positive) compounds, PAINS molecules can act via a range of specific and non-specific mechanisms. Orthogonal assays provide an additional layer of rigor for hit confirmation and label-free methods such as LC-MS are less susceptible to PAINS molecules than coupled assays. We demonstrated how the LC-MS methods can be used to solidify confidence in hit identification with the HNMT inhibitors NCGC00411246 and NCGC00411044 as well as clarify conflicting counter-assay results in the cases of NCGC00519779 and NCGC00519772.
The screening assays and methods developed in this work serve as a launch pad for virtually any SAM-dependent methyltransferase. We are actively using these results to pursue high-quality probe inhibitor candidates for targets like GNMT and HNMT. These data are publicly available on PubChem and can be leveraged by biologists and chemists at large to study the biology of SMMTases in ways inaccessible by classical genetic methods.
Methods
Reagents
Recombinant human PNMT, NNMT, HNMT, COMT, GNMT, and GAMT were all acquired from Novus Biologicals (Centennial, CO). MTase Glo Kits, including the SAM cofactor we all purchased from Promega (Madison, WI). Norepinephrine, nicotinamide, glycine, guanidinoacetate, and histamine were all purchased from Sigma Aldrich (St. Louis, MO). Initial assay development, including KM determination, was performed in 384-well Lumitrac plates (White, flat bottom, medium binding, Cat# 781075, Greiner Bio-One, Monroe, NC). HTS assays were done in Aurora 1536 plates (white, flat bottom, medium binding Cat# AWK010000A, Aurora Microplates, Scottsdale, AZ). All data were analyzed and processed using in-house tools and TIBCO Spotfire 6.0.0 (Tibco Software Inc., Cambridge, MA. https://spotfire.tibco.com/). Data visualizations were generated in GraphPad Prism (GraphPad Software, San Diego, CA), TIBCO Spotfire, and Adobe Illustrator (Adobe, San Jose, CA).
Determining HTS Assay Parameters
KM values of each substrate for their respective enzyme were determined using the method of initial rates. Briefly, MTase enzymes were diluted to 5–30 nM in 20 mM Tris (pH 8.0), 150 mM NaCl, 12 mM MgCl2, 4 mM EDTA, 0.1% BSA, 100 μM SAM. Reactions were initiated by adding substrate at various concentrations. Reactions were allowed to proceed for discreet time points and progress was terminated by adding the MTase Glo reagent to deplete excess SAM. Reaction progress was measured as a function of SAM to SAH conversion using the MTase Glo Kit (Promega). KM values for SAM were determined by the same method but holding substrate concentrations constant at 100 μM and varying the concentration of SAM. Initial rates were determined by plotting the generation of SAH as a function of time to generate a linear slop. These rates were then plotted as a function of substrate concentration and fit to the Michaelis-Menten Equation to determine KM. The only exception is for PNMT, which was fit to a substrate inhibition curve.
HTS Assay duration was determined by running a time course experiment using the previously determined KM values for substrate and SAM. For each enzyme a mixture of SAM (at the determined KM concentration) and substrate (at the determined KM concentration) were prepared in 20 mM Tris (pH 8.0), 150 mM NaCl, 12 mM MgCl2, 4 mM EDTA, 0.1% BSA. Reactions were initiated by adding SMMTase to a final concentration of 7.5, 15, or 30 μM. Reaction progress was recorded at regular intervals by quenching the reaction with the addition of MTase Glo reagent to consume excess SAM. The 20% conversation point was identified by comparing reaction progress to a SAH standard curve. Ideal reaction duration and enzyme concentration were selected based on the combination which achieved 10–20% conversion in 20–30 minutes.
Primary screen and data analysis
NNMT, COMT, HNMT, PNMT, GNMT, and GAMT were all subject to primary screening against a panel of 27,574 compounds. Primary screening was performed against single dose of compound (40 μM final) in 1536-well format using automated HTS protocols (Table 2). SAM and substrate concentrations used were based on the determined KM values (Table 1). Detailed assay protocols for each SMMTase can be found in Supplemental Methods. To determine compound activity in the primary assay, raw plate reads for each compound were first normalized relative to the positive control (sinefungin, −100% activity, full inhibition) and DMSO only wells (basal, 0% activity) using in-house informatics tools.
Table 2:
Generalized protocol table summarizing HTS assays.
| Generalized Protocol Table | |||
|---|---|---|---|
| Step | Parameter | Value | Description |
| 1 | Reagent | 2 μL | SMMTase Enzyme (2x) in reaction buffer, columns 1–48 |
| 2 | Reagent | 1 μL | SAM (4x) in reaction buffer, columns 1–48 |
| 3 | Controls | 23 nL | DMSO in column 4; sinefungin in DMSO (0 μM – 40 μM) in 7-point 1:2 dilution series (n = 2) in column 2 |
| 4 | Library compounds | 23 nL | Columns 5–48 |
| 5 | Reagent | 1 μL | Substrate (4x) in reaction buffer, columns 2–48 |
| 6 | Time | 20–30 min | Incubation |
| 7 | Reagent | 1 μL | MTase-Glo reagent (5X), columns 1–48 |
| 8 | Time | 30 min | Incubation |
| 9 | Reagent | 5 uL | MTase-Glo Detection reagent, columns 1–48 |
| 10 | Time | 30 min | Incubation, luminescence evolution |
| 11 | Detection | Luminescence | ViewLux uHTS Microplate Imager (PerkinElmer) |
| Step | Notes | ||
| 1, 2, 5 | White Medium Binding 1536-well plates (white, flat bottom, medium binding Cat# AWK010000A, Aurora Microplates, Scottsdale, AZ), Reaction buffer: 50 mM Tris, pH 8.0, 3 mM MgCl2, 1 mM EDTA, 50 mM NaCl, 1 mM DTT, and 0.1 mg/mL BSA; refer to Tables 2 and S1 for specific reagent concentrations | ||
| 3, 4 | Pintool transfer | ||
| 6, 8, 10 | Room temperature | ||
| 6 | Final reaction conditions: 10 nM COMT, 5 μM SAM, 15 μM norepinephrine, 50 mM Tris, pH 8.0, 3 mM MgCl2, 1 mM EDTA, 50 mM NaCl, 1 mM DTT, and 0.1 mg/mL BSA; refer to tables 2 and S1 for specific timing | ||
| 8 | Conversion of SAH to ADP; MTase Glo Kit (Promega, Madison, WI) | ||
| 10 | Conversion of ADP to ATP and detection by UltraGlo luciferase; MTase Glo Kit (Promega, Madison, WI) | ||
| 11 | Settings: 20 s exposure, 1X binning, high gain, medium speed | ||
Cherrypicks, counter-screening, and hit selection
Compounds which showed at least 50% inhibition in any of the six assays in the primary screen were selected for cherrypicking. Cherrypicked compounds were replated using fresh stock in dose response (Top dose 40 μM final, 11-points, 1:3 dilution series) and manually run against all six SMMTase assays (Table 2) and a counter assay. The concentration-response data for each sample was plotted and modeled by a four parameter logistic fit yielding IC50 and efficacy (maximal response) values as previously described. Compounds were designated as Class 1–4 according to the type of concentration–response curve (CRC) observed. In brief, Class −1.1 and −1.2 were the highest-confidence complete CRCs containing upper and lower asymptotes with efficacies ≥ 80% and < 80%, respectively. Class −2.1 and −2.2 were incomplete CRCs having only one asymptote with efficacy ≥ 80% and < 80%, respectively. Class −3 CRCs showed activity at only the highest concentration or were poorly fit. Class 4 CRCs were inactive having a curve-fit of insufficient efficacy or lacking a fit altogether. Compounds which showed any activity in the counter assay were excluded from hit selection and further analysis. Hits were defined as either high-quality actives (complete dose response curves, max Response ≤ −50, and IC50 ≤ 10 μM), low-quality actives (shallow curves, single-point activity, or inconclusive), or inactive (no activity).
LC/MS/MS Method for Determining SAM-dependent methyltransferase activity
The methyltransferases of interest for this high-throughput screen universally employ S-adenosylmethionine as a cofactor, generating a methylated substrate and S-adenosyl-homocysteine as the two enzymatic products. Accordingly, S-adenosyl homocysteine serves as a convenient and universal indicator of methyltransferase activity (Dong 2020). Following incubation with potential methyltransferase inhibitors, the enzymatic activity assay was quenched with 80uL of 88% acetonitrile/12% H2O w/ 0.05% formic acid containing the isotopic label d4-S-adenosyl-homocysteine (SAH-d4, MW: 388.412, Cayman Chemical) at 125nM concentration. LC/MS/MS analyses were performed using a Sciex 6500+ QTrap mass spectrometer, an Agilent 1290 infinity binary high-performance liquid chromatography pump, and an LS-1 autosampler (Sound Analytics) (Kapinos 2017). Hydrophobic Interaction Liquid Chromatography (HILIC) was chosen as the retention mechanism of choice in order to take advantage of the highly polar structure of SAH (Chauve 2010). A Waters X-Bridge BEH Amide column (2×30mm, 3.5μm) was used as the HILIC stationary phase. In early iterations of this method, residual buffer salts from the enzymatic incubation suppressed ionization of SAH and the SAH-d4 standard. The final chromatographic gradient was designed accordingly with a 60 second desalting step at higher flow to better control ion suppression. The final 30 seconds of the two-minute method were reserved for re-equilibration of the BEH-Amide column. This proved to be sufficient for reproducible chromatography over more than 1000 total injections. The 24-hour stability of SAH was confirmed by LC/MS/MS prior to the orthogonal screen. The SAH-d4 internal standard was aliquoted at 2.57 mM into 1M HCl and stored at −20°C. Fresh quench solution was prepared from a new aliquot prior to each round of orthogonal screening. Peak integration and Analyte/IS ratios were calculated in LeadScape (Sound Analytics) and exported as .CSV files. Raw data for the orthogonal screen is included in the supplementary materials.
Clustering of compounds by activity outcomes
Compounds were clustered hierarchically using TIBCO Spotfire 6.0.0 (Tibco Software Inc., Cambridge, MA. https://spotfire.tibco.com/) based on their activity outcomes from the primary or follow up screens across different methyltransferases. Compound’s AUC (Area Under the Curve) calculated based on the qHTS data analysis and curve fittings were utilized for clustering. In the heatmap, darker red indicates compounds that are more potent and efficacious, i.e. high-quality actives, and lighter red indicates less potent and efficacious compounds. If a compound didn’t show any activity in an assay, it was highlighted as white in the heatmap.
Structural clustering analysis and HNMT inhibitor SAR expansion
The cherrypicked compounds identified from qHTS screens against Genesis MiniMe, annotated and MTase chemical libraries were further clustered using MACCS Structural Keys (Bit packed) (FP:BIT_MACCS) fingerprint and Tanimoto coefficient as similarity metric in Molecular Operating Environment software (MOE, https://www.chemcomp.com/), respectively. The similarity and overlap level were both set at 75. The most significant enriched scaffold for HNMT is 2,3,4,5-tetrahydro-1H-pyrido[4,3-e][1,4]diazepine. Members in this cluster showed comparable IC50 values in HNMT biochemical inhibition assay and great selectivity against all other five methyltransferases. We further did SAR (Structure-Activity Relationship) expansion using the core 2,3,4,5-tetrahydro-1H-pyrido[4,3-e][1,4]diazepine as the substructure query to search against the entire NCATS screening collection, and identified 254 compounds sharing the same scaffold. These 254 SAR expansion compounds were then plated in 11-pt dose response using freshly prepared stock and tested in the follow-up assays.
Molecular modeling
HNMT co-crystal structure (PDB code 1JQD) was prepared for the docking studies using MOE molecular modeling software. QuickPrep module was used to set the correct protonation state for protein, and water molecules farther than 4.5 Å from the active site was deleted. All hydrogens were added to the protein and partial charges were attributed to the protein atoms using Amber99 force field. In MOE docking, ligand conformations were generated on-the-fly, and the active site was defined by glycine-rich loop and the hinge region residues without pharmacophore constraints. The first round of docking to roughly filter out unfavorable binding poses used London dG scoring function, then the top 30 ranking poses were further refined using GBVI/WSA dG scoring function. Finally, the top 5 ranking docking poses after refinement were selected and manually inspected based on the binding orientations and specific interactions.
Supplementary Material
Supporting Methods. Detailed assay information for each SMMTase used in this study.
Figure S1. SDS-PAGE of commercially sources COMT, PNMT, HNMT, GAMT, NNMT, and GAMT.
Figure S2. Michaelis-Menten plots for each SMMTase and their respective substrates.
Figure S3. Michaelis-Menten plots for each SMMTase and SAM.
Figures S4-S7. 1H-NMR of resynthesized HNMT hit compounds and PAINS molecules.
Figure S8. LC-MS/MS traces of COMT inhibition by Entacapone and Tolcapone.
Table S1. HNMT SAR top hits activity summary.
Table S2. LC-MS validation of HNMT hit compounds and PAINS molecules.
Acknowledgements
We would like to thank the compound management group at the National Center for Advancing Translational Science for preparing all compound plates. The work was supported by the Intramural Research Program of the National Center for Advancing Translational Science, National Institutes of Health. Q. Hanson was funded in part through a collaboration with Eli Lilly.
Footnotes
Supporting information
Supporting information is available.
The authors declare no competing financial interests. Data for all assays are publicly available on PubChem. AID #s: 1745853 (Primary screen), 1745852 (confirmation screen), 1745851 (counter screen)
References
- 1.Barnash KD; James LI; Frye SV, Target class drug discovery. Nat Chem Biol 2017, 13 (10), 1053–1056. [DOI] [PMC free article] [PubMed] [Google Scholar]
- 2.Copeland RA; Solomon ME; Richon VM, Protein methyltransferases as a target class for drug discovery. Nat Rev Drug Discov 2009, 8 (9), 724–32. [DOI] [PubMed] [Google Scholar]
- 3.Heilker R; Wolff M; Tautermann CS; Bieler M, G-protein-coupled receptor-focused drug discovery using a target class platform approach. Drug Discov Today 2009, 14 (5–6), 231–40. [DOI] [PubMed] [Google Scholar]
- 4.Carter AJ; Kraemer O; Zwick M; Mueller-Fahrnow A; Arrowsmith CH; Edwards AM, Target 2035: probing the human proteome. Drug Discov Today 2019, 24 (11), 2111–2115. [DOI] [PubMed] [Google Scholar]
- 5.Posy SL; Hermsmeier MA; Vaccaro W; Ott KH; Todderud G; Lippy JS; Trainor GL; Loughney DA; Johnson SR, Trends in kinase selectivity: insights for target class-focused library screening. J Med Chem 2011, 54 (1), 54–66. [DOI] [PubMed] [Google Scholar]
- 6.Benn CL; Dawson LA, Clinically Precedented Protein Kinases: Rationale for Their Use in Neurodegenerative Disease. Front Aging Neurosci 2020, 12, 242. [DOI] [PMC free article] [PubMed] [Google Scholar]
- 7.Goldstein DM; Gray NS; Zarrinkar PP, High-throughput kinase profiling as a platform for drug discovery. Nat Rev Drug Discov 2008, 7 (5), 391–7. [DOI] [PubMed] [Google Scholar]
- 8.Glukhova A; Draper-Joyce CJ; Sunahara RK; Christopoulos A; Wootten D; Sexton PM, Rules of Engagement: GPCRs and G Proteins. ACS Pharmacol Transl Sci 2018, 1 (2), 73–83. [DOI] [PMC free article] [PubMed] [Google Scholar]
- 9.Andrews SP; Brown GA; Christopher JA, Structure-based and fragment-based GPCR drug discovery. ChemMedChem 2014, 9 (2), 256–75. [DOI] [PubMed] [Google Scholar]
- 10.Hamamoto R; Nakamura Y, Dysregulation of protein methyltransferases in human cancer: An emerging target class for anticancer therapy. Cancer Sci 2016, 107 (4), 377–84. [DOI] [PMC free article] [PubMed] [Google Scholar]
- 11.Ferreira de Freitas R; Ivanochko D; Schapira M, Methyltransferase Inhibitors: Competing with, or Exploiting the Bound Cofactor. Molecules 2019, 24 (24), 4492. [DOI] [PMC free article] [PubMed] [Google Scholar]
- 12.Liscombe DK; Louie GV; Noel JP, Architectures, mechanisms and molecular evolution of natural product methyltransferases. Nat Prod Rep 2012, 29 (10), 1238–50. [DOI] [PubMed] [Google Scholar]
- 13.Lenz T; Poot P; Weinhold E; Dreger M, Profiling of methyltransferases and other S-Adenosyl-L-homocysteine-binding proteins by Capture Compound mass spectrometry. Methods Mol Biol 2012, 803, 97–125. [DOI] [PubMed] [Google Scholar]
- 14.Horning BD; Suciu RM; Ghadiri DA; Ulanovskaya OA; Matthews ML; Lum KM; Backus KM; Brown SJ; Rosen H; Cravatt BF, Chemical Proteomic Profiling of Human Methyltransferases. J Am Chem Soc 2016, 138 (40), 13335–13343. [DOI] [PMC free article] [PubMed] [Google Scholar]
- 15.Kozbial PZ; Mushegian AR, Natural history of S-adenosylmethionine-binding proteins. BMC Struct Biol 2005, 5, 19. [DOI] [PMC free article] [PubMed] [Google Scholar]
- 16.Wlodarski T; Kutner J; Towpik J; Knizewski L; Rychlewski L; Kudlicki A; Rowicka M; Dziembowski A; Ginalski K, Comprehensive structural and substrate specificity classification of the Saccharomyces cerevisiae methyltransferome. PLoS One 2011, 6 (8), e23168. [DOI] [PMC free article] [PubMed] [Google Scholar]
- 17.Petrossian TC; Clarke SG, Uncovering the human methyltransferasome. Mol Cell Proteomics 2011, 10 (1), M110 000976. [DOI] [PMC free article] [PubMed] [Google Scholar]
- 18.Schubert HL; Blumenthal RM; Cheng X, Many paths to methyltransfer: a chronicle of convergence. Trends Biochem Sci 2003, 28 (6), 329–35. [DOI] [PMC free article] [PubMed] [Google Scholar]
- 19.Fenwick MK; Ealick SE, Towards the structural characterization of the human methyltransferome. Curr Opin Struct Biol 2018, 53, 12–21. [DOI] [PubMed] [Google Scholar]
- 20.Bastos P; Gomes T; Ribeiro L, Catechol-O-Methyltransferase (COMT): An Update on Its Role in Cancer, Neurological and Cardiovascular Diseases. Rev Physiol Biochem Pharmacol 2017, 173, 1–39. [DOI] [PubMed] [Google Scholar]
- 21.Jarrold J; Davies CC, PRMTs and Arginine Methylation: Cancer’s Best-Kept Secret? Trends Mol Med 2019, 25 (11), 993–1009. [DOI] [PubMed] [Google Scholar]
- 22.Meng H; Cao Y; Qin J; Song X; Zhang Q; Shi Y; Cao L, DNA methylation, its mediators and genome integrity. Int J Biol Sci 2015, 11 (5), 604–17. [DOI] [PMC free article] [PubMed] [Google Scholar]
- 23.Scheer S; Ackloo S; Medina TS; Schapira M; Li F; Ward JA; Lewis AM; Northrop JP; Richardson PL; Kaniskan HU; Shen Y; Liu J; Smil D; McLeod D; Zepeda-Velazquez CA; Luo M; Jin J; Barsyte-Lovejoy D; Huber KVM; De Carvalho DD; Vedadi M; Zaph C; Brown PJ; Arrowsmith CH, A chemical biology toolbox to study protein methyltransferases and epigenetic signaling. Nat Commun 2019, 10 (1), 19. [DOI] [PMC free article] [PubMed] [Google Scholar]
- 24.Ma Z; Liu H; Wu B, Structure-based drug design of catechol-O-methyltransferase inhibitors for CNS disorders. Br J Clin Pharmacol 2014, 77 (3), 410–20. [DOI] [PMC free article] [PubMed] [Google Scholar]
- 25.Akhtar MJ; Yar MS; Grover G; Nath R, Neurological and psychiatric management using COMT inhibitors: A review. Bioorg Chem 2020, 94, 103418. [DOI] [PubMed] [Google Scholar]
- 26.Barrow JC, Inhibitors of Catechol-O-Methyltransferase. CNS Neurol Disord Drug Targets 2012, 11 (3), 324–32. [DOI] [PubMed] [Google Scholar]
- 27.Robinson RG; Smith SM; Wolkenberg SE; Kandebo M; Yao L; Gibson CR; Harrison ST; Polsky-Fisher S; Barrow JC; Manley PJ; Mulhearn JJ; Nanda KK; Schubert JW; Trotter BW; Zhao Z; Sanders JM; Smith RF; McLoughlin D; Sharma S; Hall DL; Walker TL; Kershner JL; Bhandari N; Hutson PH; Sachs NA, Characterization of non-nitrocatechol pan and isoform specific catechol-O-methyltransferase inhibitors and substrates. ACS Chem Neurosci 2012, 3 (2), 129–40. [DOI] [PMC free article] [PubMed] [Google Scholar]
- 28.Drinkwater N; Gee CL; Puri M; Criscione KR; McLeish MJ; Grunewald GL; Martin JL, Molecular recognition of physiological substrate noradrenaline by the adrenaline-synthesizing enzyme PNMT and factors influencing its methyltransferase activity. Biochem J 2009, 422 (3), 463–71. [DOI] [PMC free article] [PubMed] [Google Scholar]
- 29.Pendleton RG; Kaiser C; Gessner G, Studies on adrenal phenylethanolamine N-methyltransferase (PNMT) with S K & F 64139, a selective inhibitor. J Pharmacol Exp Ther 1976, 197 (3), 623–32. [PubMed] [Google Scholar]
- 30.Rucci F; Cigoli MS; Marini V; Fucile C; Mattioli F; Robbiano L; Cavallari U; Scaglione F; Perno CF; Penco S; Marocchi A, Combined evaluation of genotype and phenotype of thiopurine S-methyltransferase (TPMT) in the clinical management of patients in chronic therapy with azathioprine. Drug Metabolism and Personalized Therapy 2019, 34 (1), 20180037. [DOI] [PubMed] [Google Scholar]
- 31.Keuzenkamp-Jansen CW; Leegwater PA; De Abreu RA; Lambooy MA; Bokkerink JP; Trijbels JM, Thiopurine methyltransferase: a review and a clinical pilot study. J Chromatogr B Biomed Appl 1996, 678 (1), 15–22. [DOI] [PubMed] [Google Scholar]
- 32.Yen C-H; Lin Y-T; Chen H-L; Chen S-Y; Chen Y-MA, The multi-functional roles of GNMT in toxicology and cancer. 2013, 266 (1), 67–75. [DOI] [PubMed] [Google Scholar]
- 33.Nieman KM; Hartz CS; Szegedi SS; Garrow TA; Sparks JD; Schalinske KL, Folate status modulates the induction of hepatic glycine N-methyltransferase and homocysteine metabolism in diabetic rats. Am J Physiol Endocrinol Metab 2006, 291 (6), E1235–42. [DOI] [PubMed] [Google Scholar]
- 34.Hsiao K; Zegzouti H; Goueli SA, Methyltransferase-Glo: a universal, bioluminescent and homogenous assay for monitoring all classes of methyltransferases. Epigenomics 2016, 8 (3), 321–39. [DOI] [PubMed] [Google Scholar]
- 35.Brooks HB; Geeganage S; Kahl SD; Montrose C; Sittampalam S; Smith MC; Weidner JR, Basics of Enzymatic Assays for HTS. In Assay Guidance Manual, Markossian S; Grossman A; Brimacombe K; Arkin M; Auld D; Austin CP; Baell J; Chung TDY; Coussens NP; Dahlin JL; Devanarayan V; Foley TL; Glicksman M; Hall MD; Haas JV; Hoare SRJ; Inglese J; Iversen PW; Kales SC; Lal-Nag M; Li Z; McGee J; McManus O; Riss T; Saradjian P; Sittampalam GS; Tarselli M; Trask OJ; Wang Y; Weidner JR; Wildey MJ; Wilson K; Xia M; Xu X, Eds. Bethesda (MD), 2004. [Google Scholar]
- 36.Beaudouin C; Haurat G; Fraisse L; Souppe J; Renaud B, Assay of phenylethanolamine N-methyltransferase activity using high-performance liquid chromatography with ultraviolet absorbance detection. 1993, 613 (1), 51–58. [DOI] [PubMed] [Google Scholar]
- 37.Horton JR; Sawada K; Nishibori M; Zhang X; Cheng X, Two polymorphic forms of human histamine methyltransferase: structural, thermal, and kinetic comparisons. Structure 2001, 9 (9), 837–49. [DOI] [PMC free article] [PubMed] [Google Scholar]
- 38.Zhang J; Klinman JP, Convergent Mechanistic Features between the Structurally Diverse N- and O-Methyltransferases: Glycine N-Methyltransferase and Catechol O-Methyltransferase. J Am Chem Soc 2016, 138 (29), 9158–65. [DOI] [PMC free article] [PubMed] [Google Scholar]
- 39.Loring HS; Thompson PR, Kinetic Mechanism of Nicotinamide N-Methyltransferase. Biochemistry 2018, 57 (38), 5524–5532. [DOI] [PubMed] [Google Scholar]
- 40.Lotta T; Vidgren J; Tilgmann C; Ulmanen I; Melen K; Julkunen I; Taskinen J, Kinetics of human soluble and membrane-bound catechol O-methyltransferase: a revised mechanism and description of the thermolabile variant of the enzyme. Biochemistry 1995, 34 (13), 4202–10. [DOI] [PubMed] [Google Scholar]
- 41.Ogawa H; Gomi T; Takata Y; Date T; Fujioka M, Recombinant expression of rat glycine N-methyltransferase and evidence for contribution of N-terminal acetylation to co-operative binding of S-adenosylmethionine. Biochem J 1997, 327 ( Pt 2), 407–12. [DOI] [PMC free article] [PubMed] [Google Scholar]
- 42.Lipinski CA; Lombardo F; Dominy BW; Feeney PJ, Experimental and computational approaches to estimate solubility and permeability in drug discovery and development settings. Adv Drug Deliv Rev 2001, 46 (1–3), 3–26. [DOI] [PubMed] [Google Scholar]
- 43.Iversen PW;Beck B; Chen YF; Dere W; Devanarayan V; Eastwood BJ; Farmen MW; Iturria SJ; Montrose C; Moore RA; Weidner JR; Sittampalam GS, HTS Assay Validation. In Assay Guidance Manual, Markossian S; Grossman A; Brimacombe K; Arkin M; Auld D; Austin CP; Baell J; Chung TDY; Coussens NP; Dahlin JL; Devanarayan V; Foley TL; Glicksman M; Hall MD; Haas JV; Hoare SRJ; Inglese J; Iversen PW; Kales SC; Lal-Nag M; Li Z; McGee J; McManus O; Riss T; Saradjian P; Sittampalam GS; Tarselli M; Trask OJ; Wang Y; Weidner JR; Wildey MJ; Wilson K; Xia M; Xu X, Eds. Bethesda (MD), 2004. [Google Scholar]
Associated Data
This section collects any data citations, data availability statements, or supplementary materials included in this article.
Supplementary Materials
Supporting Methods. Detailed assay information for each SMMTase used in this study.
Figure S1. SDS-PAGE of commercially sources COMT, PNMT, HNMT, GAMT, NNMT, and GAMT.
Figure S2. Michaelis-Menten plots for each SMMTase and their respective substrates.
Figure S3. Michaelis-Menten plots for each SMMTase and SAM.
Figures S4-S7. 1H-NMR of resynthesized HNMT hit compounds and PAINS molecules.
Figure S8. LC-MS/MS traces of COMT inhibition by Entacapone and Tolcapone.
Table S1. HNMT SAR top hits activity summary.
Table S2. LC-MS validation of HNMT hit compounds and PAINS molecules.