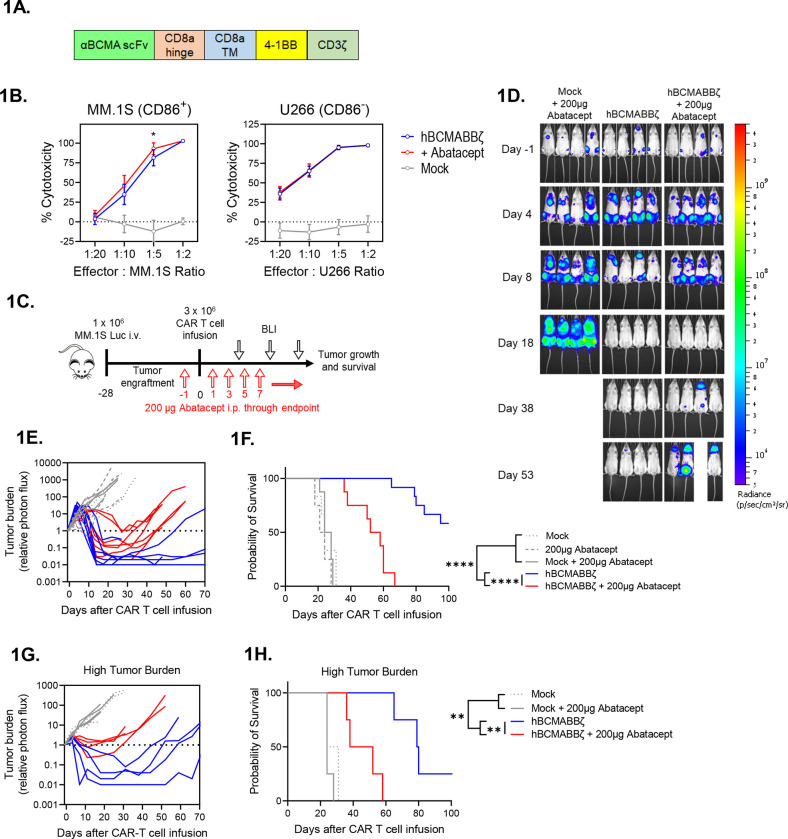
Figure 1: Endogenous CD28 blockade impairs hBCMABBζ CAR T cell anti-myeloma efficacy.
(A) Schematic of second-generation retroviral CAR construct used to generate BCMA targeted human CAR T cells.
(B) CAR T cell cytotoxic activity during a 24-hr. co-culture with luciferase-tagged MM.1S (left) or U266 (right) myeloma cells ± abatacept. Data are shown as mean ± SD and representative of hBCMABBζ CAR T cells generated from 3 healthy donors. *p<0.05 by two-way analysis of variance (ANOVA) with Tukey’s multiple comparison test.
(C) Diagram of experimental setup used to evaluate hBCMABBζ CAR T + abatacept therapy in a human MM xenograft model. NSG mice were intravenously inoculated with 1 × 10⁶ MM.1S-luc myeloma cells on day −28 and treated with CAR T cells on day 0. Mice received 200 μg abatacept 3x/week beginning the day before infusion and continuing through endpoint. Tumor burden was monitored by IVIS bioluminescent imaging (BLI) 2x/week.
(D) Representative bioluminescent images of MM.1S bearing mice on specified days following CAR T cell infusion.
(E) Tumor burden expressed as relative photon flux measured by BLI from MM.1S-luc bearing mice treated with hBCMABBζ CAR T or control T cells ± abatacept (200 μg, 3x/week). Each line represents an individual mouse (n = 7 mice per CAR T cell treated group).
(F) Kaplan – Meier analysis of survival of hBCMABBζ CAR T or control T cells ± abatacept (200 μg, 3x/week) treated MM.1S-luc bearing mice (n = 8 – 12 mice per CAR T cell treated group). Median survival of hBCMABBζ CAR T treated mice was >100 days post CAR T cell infusion vs. 55 days for hBCMABBζ CAR T + abatacept treated mice. ****p<0.0001 by log-rank Mantel-Cox test.
(G) Tumor burden expressed as relative photon flux measured by BLI from MM.1S high tumor burden mice (inoculated on day −35) treated with hBCMABBζ CAR T or control T cells ± abatacept (200 μg, 3x/week). Each line represents an individual mouse (n = 4 mice per CAR T cell treated group).
(H) Kaplan – Meier analysis of survival of hBCMABBζ CAR T or control T cells ± abatacept (200 μg, 3x/week) treated MM.1S-luc high tumor burden mice (n = 4 mice per group). Median survival of hBCMABBζ CAR T treated mice was 80 days vs. 45 days for hBCMABBζ CAR T + abatacept treated mice. ***p<0.0001 by log-rank Mantel-Cox test.

