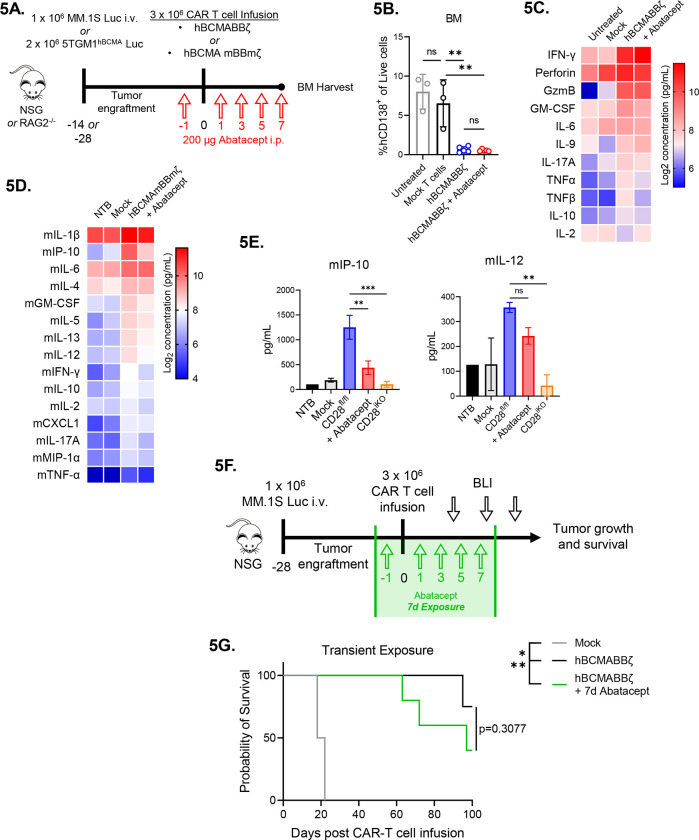
Figure 5: Transient CD28 blockade limits inflammatory cytokines in the MM BME without affecting survival of hBCMAmBBmζ CAR T cell treated mice.
(A) Diagram of experimental setup. MM.1S bearing NSG mice were treated with hBCMABBζ CAR T cells ± 200μg abatacept on days −1, 1, 3, 5, 7 (5B and 5C) or 5TGM1hBCMA bearing RAG2−/− mice were treated with CD28fl/fl or CD28iKO hBCMAmBBmζ CAR T cells (5D and 5E) and euthanized 7 days post adoptive transfer for hind limb BM harvest.
(B) Myeloma burden assessed by flow cytometry for human CD138+ cells in the bone marrow of MM.1S bearing mice treated as described in 5A. Bars represent mean ± SD, dots indicate individual mice. **p<0.01 by one-way ANOVA, ns = not significant.
(C) Heatmap representation of human cytokine levels in the MM BME 7 days after treatment of MM.1S bearing mice with hBCMABBζ CAR T cells ± abatacept. Bilateral hind limbs were harvested, and BM was flushed into 15 μL PBS for multiplexed cytokine analysis. Log2 transformed cytokine concentrations represent the mean of 3–6 mice per group.
(D) Heatmap representation of murine cytokine levels in the MM BME 7 days after treatment of 5TGM1hBCMA bearing mice with hBCMAmBBmζ CAR T cells ± abatacept. Bilateral hind limbs were harvested, and BM was flushed into 15 μL PBS for multiplexed cytokine analysis. Log2 transformed cytokine concentrations represent the mean of 2–3 mice per group.
(E) Bar graphs showing concentrations of murine IP-10 (left) and IL-12 (right) in the MM BME 7 days after treatment of 5TGM1hBCMA bearing mice with CD28fl/fl hBCMAmBBmζ CAR T cells ± abatacept versus CD28iKO hBCMAmBBmζ CAR T cells. Bars represent mean ± SD of 2–3 biological replicates. **p<0.01, ***p<0.001 by one-way ANOVA.
(F) Diagram of experimental setup. MM.1S bearing NSG mice were treated with hBCMABBζ CAR T cells ± 200μg abatacept on days −1, 1, 3, 5, 7 and tumor burden was monitored by bioluminescent imaging 2x/week until endpoint.
(G) Kaplan – Meier analysis of survival of hBCMABBζ CAR T ± transient abatacept or mock transduced T cell treated MM.1S-luc bearing mice (n = 4–5 mice per CAR T cell treated group). Median survival of hBCMABBζ CAR T treated mice was >100 days post CAR T cell infusion vs. 97 days for hBCMABBζ CAR T + transient abatacept treated mice. Statistical significance was determined by log-rank Mantel-Cox test.

