

Summary
Oncolytic virus (OV) clinical trials have demonstrated remarkable efficacy in subsets of patients with glioblastoma (GBM). However, the lack of tools to predict this response hinders the advancement of a more personalized application of OV therapy. In this study, we characterize an ex vivo co-culture system designed to examine the immune response to OV infection of patient-derived GBM neurospheres in the presence of autologous peripheral blood mononuclear cells (PBMCs). Co-culture conditions were optimized to retain viability and functionality of both tumor cells and PBMCs, effectively recapitulating the well-recognized immunosuppressive effects of GBM. Following OV infection, we observed elevated secretion of pro-inflammatory cytokines and chemokines, including interferon γ, tumor necrosis factor α, CXCL9, and CXCL10, and marked changes in immune cell activation markers. Importantly, OV treatment induced unique patient-specific immune responses. In summary, our co-culture platform presents an avenue for personalized screening of viro-immunotherapies in GBM, offering promise as a potential tool for future patient stratification in OV therapy.
Keywords: glioblastoma, co-culture model, oncolytic viruses, Delta24-RGD, individualized screening, spectral flow cytometry, autologous co-culture, GBM neurospheres, PBMCs, immune response
Graphical abstract
Highlights
-
•
We present an autologous GBM-PBMC co-culture model for assessing virotherapy responses
-
•
M-CSF, IL-2, and IL-15 supplementation maintains PBMC viability
-
•
GBM’s immunosuppressive activity is reflected in the co-culture
-
•
Dose-dependent and distinct patient-specific immune responses are captured in the model
Motivation
Currently, ex vivo platforms that comprehensively analyze the immune response generated by oncolytic virus (OV) therapy are lacking, as they typically involve only one immune cell type to study the interactions with OV-infected tumor cells. In this study, we introduce an autologous co-culture platform that combines OV-infected primary glioblastoma (GBM) neurospheres with the whole fraction of autologous peripheral blood mononuclear cells. By incorporating both myeloid innate immune cells and lymphocytes, this model allows for a more comprehensive assessment of the complex interplay between these cell types and the OV-infected GBM cells. Consequently, this platform serves as a valuable tool for evaluating immune responses elicited by viro-immunotherapy on a per-patient basis.
Stavrakaki et al. present a co-culture model designed to investigate the interactions between oncolytic virus-infected glioblastoma cells and immune cells derived from the same patient. This model serves as a valuable tool to explore individual patient responses to virus-based immunotherapy.
Introduction
Glioblastoma (GBM) is a universally fatal primary brain tumor, with a median overall survival of 14 months with maximal adjuvant therapy after surgery.1 Immunotherapy approaches that have impacted the treatment of solid tumors with the prospect of long-term survival in patients with advanced cancer have also been applied in patients with GBM.2 However, clinical benefit was highly variable and only observed in a small subset of patients, typically 10%–20%.3,4,5,6 Various factors have been implicated in the paucity of response among patients with GBM, such as low tumor mutation burden, intratumoral heterogeneity, a unique immune environment of central nervous system, a low number of intratumoral T cells, and the use of dexamethasone, a corticosteroid commonly employed in GBM management.7,8 To address these challenges, there is a growing need for a personalized functional screening system that incorporates the interactions between tumor cells and the patient’s own immune cells. Such a system has the potential to guide individualized treatment approaches.
In our study, we extensively examined the immune modulating treatment known as oncolytic virus (OV) therapy. The initial step in OV therapy involves the selective entry of OVs into malignant cells. Upon viral entry, viral pathogen-associated molecular patterns (PAMPs) are detected by various pattern recognition receptors such as Toll-like receptors and retinoic acid-inducible gene (RIG)-I-like receptors. This recognition triggers the production of type I and III interferons (IFNs), as well as pro-inflammatory cytokines and chemokines, resulting in the activation of local innate immune cells.9 Additionally, OVs can induce oncolysis in tumor cells, leading to release of tumor-associated antigens.9 Subsequently, mature antigen-presenting cells migrate to the lymph nodes, where they present these tumor-specific antigens to T cells, initiating and priming an antitumor immune response.9
While clinical trials have shown impressive outcomes with OV therapy, including long-term responses, a significant fraction (80%–90%) of patients did not benefit from this treatment.10 Identifying patients who are most likely to respond to OV therapy remains a clinical challenge due to the diverse factors that contribute to treatment failure.
In an effort to generate ex vivo tests for identifying potential responders, co-culture platforms have been developed. However, these platforms have primarily focused on analyzing T cell-mediated tumor recognition.11 Additionally, when studying interactions between tumor cells and immune cells in preclinical models of brain tumors such as GBM, current approaches typically utilize only one type of immune cell, such as healthy-donor derived monocytes.12,13 This limitation arises from the complexities involved in establishing a model that effectively incorporates various immune cell types, such as natural killer (NK) cells, macrophages, and T cells, alongside tumor cells. In pursuit of establishing an ex vivo setting that enables the assessment of immunotherapeutic drug efficacy, we seek to develop a unique co-culture model involving patient-derived primary GBM neurospheres and autologous peripheral blood mononuclear cells (PBMCs). This approach aims to provide a more comprehensive representation of the complex interplay between GBM cells and the diverse immune cell populations present in patients’ peripheral blood.
In this proof-of-concept study, we aimed to develop a screening tool for assessing the response to OVs in patients with GBM at an individual level. Our primary goal was to establish a 3-day co-culture platform that could maintain the effector functions of both tumor and immune cells while, in parallel, allowing us to monitor the phenotypic changes in PBMCs induced by the OV infections.
Results
High myeloid and lymphoid cell viability is achieved with IL-2, IL-15, and M-CSF supplementation
In a previous study, we utilized IMDM+10%FBS supplemented with macrophage colony-stimulating factor (M-CSF) to support the co-culture of GBM cells with monocytes.12 To extend this approach and support the survival of other immune cell subsets, we introduced interleukin-2 (IL-2) and IL-15 to the medium to sustain T cell and NK cell survival and omitted IL-4 and IFNγ, which served as macrophage polarization cytokines in the previous study. PBMCs isolated from 5 patients were retrieved from liquid nitrogen storage, thawed, and cultured under these conditions for 4 days. The viability of macrophages, T cells, B cells, and NK cells was then evaluated using flow cytometry. Viability of PBMCs varied per donor, but in general, over 70% viability was achieved for the majority of immune cell subsets. Notably, we observed significant variations in B cell viability among individual patients ranging from 3.1% to 94.4% (Figure 1A).
Figure 1.

Evaluation of PBMC viability and glioblastoma (GBM) neurosphere growth
(A) Viability percentages of CD4 T cells, CD8 T cells, NK cells, B cells, and macrophages from 5 distinct patients with GBM.
(B) A schematic illustration of the experimental setup designed to assess the GBM neurosphere growth in 3 distinct media.
(C) The relative luminescence units (RLUs) of 5 primary patient-derived cell cultures on days 1, 3, and 6, following culture in NS medium, IMDM, or a combination of NS and IMDM.
Statistical significance between groups was evaluated by two-way ANOVA with correction for multiple comparisons using Sidak method (∗p < 0.05, ∗∗p < 0.01, ∗∗∗p < 0.005, and ∗∗∗∗p < 0.001; mean with standard deviation).
Sequential use of NS medium and IMDM supports growth of GBM neurospheres and OV activity
For co-culture of PBMCs with GBM neurospheres, it is also required that GBM cells thrive in the serum-supplemented IMDM medium. To evaluate this, we conducted a comparative assessment of the growth rates of five distinct GBM neurosphere cultures at three time points: days 1, 3, and day 6 in the commonly used neurosphere (NS) medium for neurospheres, IMDM+10% FBS, and the sequential use of both media. For the latter, GBM cells were initially plated in NS medium and allowed to form neurospheres, which were transferred to IMDM after 24 h (Figure 1B). Figure 1C demonstrates that growth of GBM neurospheres in NS was superior to IMDM, in 4 of 5 cultures, indicating that IMDM is less suitable for GBM growth. Interestingly, a switch to IMDM after 24 h in NS resulted in similar or slightly improved growth compared to NS medium (Figure 1C).
Next, we also investigated whether there was an impact of the different culture conditions on the activity of the oncolytic adenovirus Delta24-RGD. GBM neurospheres from five patients were infected with a dose range of Delta24-RGD in NS, IMDM, or the sequential use of both media with a medium change before OV infection. Overall, oncolysis was similar in the three conditions (Figure S1).
Establishing the optimal GBM:PBMC ratio for gene and protein detection
To determine the optimal cell ratio for our co-culture model, we compared three different ratios of numbers of GBM cells to PBMCs, 1:1 (n = 3), 1:2 (n = 4), and 1:4 (n = 4). We hypothesized that higher ratios would not accurately reflect the physiological conditions within GBMs. A visual representation of the co-culture experimental setup is provided in Figure 2A. We evaluated mRNA levels of IFNG, TNF, IL10, and IL6 after co-culturing at the three different ratios, both with and without OV infection (Figure 2B). While there was variability in baseline cytokine gene expression in the patient-derived co-cultures, no statistically significant differences were observed in mRNA levels among 1:1, 1:2, and 1:4 ratios. Furthermore, in response to OV infection, the induction of pro-inflammatory genes did not differ significantly between the 1:1, 1:2, and 1:4 ratios.
Figure 2.

Evaluation of GBM:PBMC co-culture ratios
(A) A schematic illustration of the experimental co-culture setup.
(B) Mean mRNA fold change relative to β-actin of IFNG, TNF, IL6, and IL10 after co-culturing with different GBM:PBMC ratios in mock or Delta24-RGD MOI 10-infected co-cultures.
(B) Average cytokine production of IFNγ, granzyme B (GrzB), IL-6, and CCL4 after co-culturing with different GBM:PBMC ratios in mock or Delta24-RGD-infected co-cultures.
Data are presented for 4 distinct patients: GS.1067 (blue), GS.1098 (red), GS.1100 (green), and GS.1108 (purple). Statistical significance between groups was evaluated by ordinary one-way ANOVA (∗p < 0.05; line at median).
Next, we examined the presence of immune-related proteins (IFNγ, IL-6, CCL4, and granzyme B) in the supernatants of OV-infected versus non-infected (mock) co-cultures comparing the 1:1, 1:2, and 1:4 ratios (Figure 2C). Tumor necrosis factor α (TNF-α) could not be detected in any of the tested conditions, and IL-10 was omitted from testing, as it was not detected in prior pilot experiments (data not shown). Only granzyme B revealed a statistically significant increase in the 1:4 compared to the 1:1 ratio. For the other proteins, a non-significant trend was observed of consistently higher values in the 1:4 ratio compared to the other two ratios. Therefore, considering that pro-inflammatory protein production in the supernatants of the co-cultures is a key outcome measure, we selected the GBM:PBMC ratio of 1:4 for further analyses of PBMC functional changes.
Assessing immune suppression in co-culture: Impact of GBM cells on PBMCs
Utilizing the optimized conditions, we proceeded to co-culture GBM neurospheres with autologous PBMCs. Our first aim was to investigate whether the well-established immunosuppressive effects of GBM on the immune microenvironment are reflected in our co-culture model. To assess this, we evaluated mRNA gene expression using the NanoString IO 360 panel on 6 patient-derived co-cultures. Gene set pathway analysis revealed that pathway scores related to antigen processing, chemokines, cytokines, ILs, and leukocyte functions were significantly decreased in co-culture compared to PBMCs alone. Interestingly, the only immune pathway that exhibited a higher score upon addition of GBM neurospheres was the complement pathway (Figures 3A and 3B). These findings show that GBM neurospheres induce an immunosuppressive profile in our co-culture model.
Figure 3.

Immunomodulatory effects of GBM neurospheres on PBMCs
Gene expression grouped according to mRNA function and represented as pathway scores.
(A) Heatmap depicting immune-related pathway scores of 6 PBMC samples to 6 matched GBM:PBMC co-cultures.
(B) Bar plots comparing selected immune-related pathways of 6 PBMC samples to 6 matched GBM:PBMC co-cultures.
Statistical significance between groups was assessed using two-way ANOVA with correction for multiple comparisons using the Sidak method (∗p < 0.05, ∗∗p < 0.01, ∗∗∗p < 0.005, and ∗∗∗∗p < 0.001; whiskers min to max).
Dose-dependent immune activation is detectable in different immune cell populations in GBM-PBMC co-cultures
To investigate whether dose-response effects of OV infection can be captured in the co-cultures in the different immune cell populations, we evaluated immune responses after infection with two different OV doses at multiplicities of infection (MOIs) 0.3 and 30 in a primary autologous co-culture. Phenotypic changes in all major PBMC immune subsets were assessed at the single-cell level by spectral flow cytometry. Evaluation of a series of activation markers in CD8+ and CD4+ T cells and NK cells showed that dose-dependent differential activation patterns were induced. Specifically, we observed an upregulation of CD69 expression on CD8+ T cells, at both MOIs 0.3 and 30. However, at MOI 30, a subset of CD8+ T cells exhibited downregulated CD69 expression. CD38 displayed a dose-dependent upregulation on CD8+ T cells (Figure 4A). In CD4+ T cells, CD69 levels were downregulated with an MOI 30 but not with an MOI 0.3. CD38 expression was not detected under any of the tested conditions in CD4+ T cells (Figure 4B). In NK cells, all activation markers (CD69, CD38, human leukocyte antigen [HLA]-DR) exhibited upregulation in response to MOI 30. Conversely, CD16 expression was strongly downregulated in a subset of NK cells in response to the higher MOI, while in the mock and MOI 0.3 conditions, only a slight reduction was observed (Figure 4C).
Figure 4.

Immunophenotyping and cytokine production capture OV-dose effects in the co-culture model
Histograms depicting expression patterns for (A) CD69 and CD38 on CD8+ T cells in mock co-cultures and Delta24-RGD MOI 0.3- and MOI 30-infected co-cultures; (B) CD69 and CD38 on CD4+ T cells in mock co-cultures and Delta24-RGD MOI 0.3- and MOI 30-infected co-cultures; (C) CD69, CD38, HLA-DR, and CD16 on NK cells in mock co-cultures and Delta24-RGD MOI 0.3- and MOI 30-infected co-cultures; and (D) CD192, CD64, CD163, CD206, and Tim-3 on monocyte-derived macrophages in mock co-cultures and Delta24-RGD MOI 0.3- and MOI 30-infected co-cultures.
(E) Bar graphs depicting mean production of IFNγ, TNF-α, CXCL9, CXCL10, and IL-6 in mock co-cultures and Delta24-RGD MOI 0.3- and MOI 30-infected co-cultures.
Statistical significance between groups was evaluated by two-way ANOVA with correction for multiple comparisons using Sidak method (∗p < 0.05, ∗∗p < 0.01, ∗∗∗p < 0.005, and ∗∗∗∗p < 0.001).
In monocyte-derived macrophages, the M1 marker CD192 was upregulated in a subset of the co-culture at MOI 30. However, no differences were observed in the expression of the M1 marker CD64. In contrast, OV infection at MOIs 0.3 and 30 resulted in a clear decrease in the expression of M2 marker CD163, whereas M2 marker CD206 was unaffected.12 Finally, a strong dose-dependent suppression of Tim-3 expression was observed in this population (Figure 4D).
The supernatants of these co-cultures were also evaluated for protein levels of a panel of inflammatory cytokines and chemokines (Figure 4E). In line with the flow cytometry data there was a dose-dependent increase in the expression levels of IFNγ, TNF-α, and CXCL10 when comparing MOI 0.3 and 30 conditions (p < 0.0001, p = 0.01, and p = 0.005, respectively). The increase in CXCL9 production between MOIs 0.3 and 30 followed a similar pattern but did not reach statistical significance. Interestingly, IL-6 production peaked at MOI 0.3 (p = 0.03) before decreasing to baseline again at MOI 30.
Overall, in the co-cultures, we observed that both OV concentrations effectively induced changes in activation markers on T cells, NK cells, and macrophages, as well as upregulation of inflammatory cytokines/chemokines, which could be detected in the supernatants.
Distinct immune activation patterns per patient upon OV infection
To assess patient-specific OV-induced immune responses, we compared 2 patient samples (GS.1091 and GS.1191) with similar tumor susceptibility to Delta24-RGD, with EC50 values of MOI 42 and 65, respectively (Figure S1A). GBM:PBMC co-cultures from these cell lines were infected at MOI 10 for phenotypic evaluation below cytopathic doses. Results revealed noteworthy changes in CD69 expression on various immune cell subsets. Notably, CD4+ T cells showed a significant downregulation of CD69 expression in both co-cultures after OV infection compared to controls (p < 0.0001) (Figure 5A). Conversely, CD69 expression was statistically upregulated on CD8+ T cells (p = 0.002 for GS.1091, p = 0.006 for GS.1191) and NK cells (p < 0.0001 for GS.1091, p = 0.005 for GS.1191) compared to controls. Interestingly, in both co-cultures, CD16 expression on NK cells was significantly downregulated (p = 0.0004 for GS.1091, p = 0.006 for GS.1191), while HLA-DR upregulation was detected only in the GS.1091 co-culture (Figure S1B).
Figure 5.

Differential PBMC activation in co-cultures from two patients with GBM with similar tumor Delta24-RGD sensitivity
(A) Median fluorescence intensity (MFI) of CD69 on CD8+ T cells, CD4+ T cells, and NK cells in mock or Delta24-RGD-infected co-cultures derived from GS.1091 or GS.1191.
(B) MFI of CD192, CD64, CD163, and CD206 on monocyte-derived macrophages in mock or Delta24-RGD-infected co-cultures derived from GS.1091 or GS.1191.
(C) Average cytokine production of IFNγ, granzyme B, IL-6, CCL4, CXCL9, and CXCL10 in mock or Delta24-RGD-infected co-cultures derived from GS.1091 or GS.1191.
Statistical significance between groups was evaluated by two-way ANOVA with correction for multiple comparisons using Sidak method (∗p < 0.05, ∗∗p < 0.01, ∗∗∗p < 0.005, and ∗∗∗∗p < 0.001; mean with standard deviation).
Upon evaluating a panel of M1 markers (CD192, CD64) and M2 markers (CD163, CD206) in monocyte-derived macrophages, we observed a statistically significant upregulation of the M1 marker CD192 (p = 0.003) only in the GS.1091 co-culture (Figure 5B). Notably, a parallel downregulation of CD64 expression was observed in GS.1091 (p = 0.001). However, in both cultures, M2 marker CD163 expression was completely suppressed by the OV (p = 0.001 for GS.1091, p = 0.0005 for GS.1191), while the downregulation of CD206 was not statistically significant.
The observed differential shifts in immune cell activation status between the 2 co-cultures were also reflected in cytokine levels in the supernatants. The GS.1091 co-culture demonstrated a greater overall production of the pro-inflammatory proteins (IFNγ, granzyme B, CCL4) following OV infection compared to the GS.1191 co-culture (Figure 5C). IL-6 and CXCL9 production was downregulated in GS.1091 upon OV infection (p = 0.007), whereas GS.1191 revealed a significant upregulation of CXCL10 (p = 0.02) (Figure 5C). Altogether these findings indicate that despite similar OV sensitivities, heterogeneous immune cell activation upon OV treatment can occur, which can be captured in our co-culture system.
Exposure to dexamethasone prior to PBMC isolation does not correlate with IFNγ suppression
Next, we evaluated whether dexamethasone, often used peri-operatively to reduce symptoms of brain edema in patients with GBM,14 impacts the in vitro IFNγ response to oncolytic adenovirus. Most PBMCs used in this study were obtained from patients on dexamethasone medication, and we therefore investigated whether its dosage, ranging from 0 to 8 mg, and duration, ranging from 0 to 21 days, affected the IFNγ responses measured in derived co-cultures. As depicted in the Figure 6, IFNγ production levels that were detected in the supernatants of the co-cultures (n = 14) (Table 1) after oncolytic adenovirus infection were not significantly influenced by the dosage (p = 0.5) or the duration of dexamethasone administration (p = 0.5) prior to blood sampling.
Figure 6.

Correlation analysis of patient dexamethasone use and IFNγ production in Delta24-RGD-infected co-cultures
Dot plot showing mean IFNγ production of 14 Delta24-RGD-infected co-cultures versus dose and dexamethasone duration of corresponding patients’ dexamethasone use (Spearman’s rank correlation analysis).
Table 1.
Characteristics of patients
| Sample ID | Diagnosis | Primary or recurrent | IDH status | Sex | Age | Material used | Experiment |
|---|---|---|---|---|---|---|---|
| GS.1032 | GBM | primary | WT | M | 60 | PBMCs | Figure 1 |
| PBMC377 | GBM | primary | WT | F | 65 | PBMCs | Figure 1 |
| PBMC378 | GBM | primary | WT | M | 58 | PBMCs | Figure 1 |
| PBMC386 | GBM | primary | WT | F | 84 | PBMCs | Figure 1 |
| GS.1055 | GBM | primary | WT | F | 53 | PBMCs | Figure 1 |
| GS.1018 | GBM | primary | WT | M | 55 | GBM neurospheres and PBMCs | Figure 6 |
| GS.1066 | GBM | primary | WT | F | 77 | GBM neurospheres and PBMCs | Figures 3 and 6 |
| GS.1067 | GBM | primary | WT | F | 74 | GBM neurospheres and PBMCs | Figures 2 and 6 |
| GS.1069 | GBM | primary | WT | M | 66 | GBM neurospheres and PBMCs | Figures 1, 3, and 6 |
| GS.1083 | GBM | primary | WT | F | 55 | GBM neurospheres and PBMCs | Figures 3 and 6 |
| GS.1087 | GBM | primary | WT | F | 69 | GBM neurospheres and PBMCs | Figures 1 and 6 |
| GS.1091 | GBM | primary | WT | M | 50 | GBM neurospheres and PBMCs | Figure 5 |
| GS.1098 | GBM | primary | WT | M | 72 | GBM neurospheres and PBMCs | Figures 2 and 6 |
| GS.1100 | GBM | primary | WT | F | 81 | GBM neurospheres and PBMCs | Figure 2 |
| GS.1103 | GBM | primary | WT | M | 57 | GBM neurospheres and PBMCs | Figures 3 and 6 |
| GS.1108 | GBM | primary | WT | M | 64 | GBM neurospheres and PBMCs | Figures 1, 2, 3, and 6 |
| GS.1122 | GBM | primary | WT | M | 75 | GBM neurospheres and PBMCs | Figures 1 and 6 |
| GS.1134 | GBM | primary | WT | F | 65 | GBM neurospheres and PBMCs | Figure 6 |
| GS.1140 | GBM | primary | WT | M | 74 | GBM neurospheres | Figure 1 |
| GS.1149 | GBM | primary | WT | F | 63 | GBM neurospheres and PBMCs | Figure 4 |
| GS.1165 | GBM | primary | WT | M | 77 | GBM neurospheres and PBMCs | Figures 3 and 6 |
| GS.1191 | GBM | primary | WT | M | 55 | GBM neurospheres and PBMCs | Figure 5 |
WT, wild type.
Discussion
The clinical implementation of cancer immunotherapy is gaining rapid momentum due to its potential effectiveness in treating solid tumors.15 Consequently, numerous clinical trials focusing on immunotherapy have been initiated for brain cancers. However, the initial clinical outcomes have been discouraging, with only a small subset of patients responding to treatment.2 To increase patient outcomes, it is crucial to explore the complex relationship between GBM tumors and the immune system during immunomodulating therapy. This offers an opportunity to identify patients who are most likely to respond from these therapies. A critical part of this effort is the development of ex vivo assays, which could monitor the complex interactions of GBM cells with innate and adaptive immune cells during immunoodulating treatments. Despite the growing interest in this field, to our knowledge, such an ex vivo platform for GBM has not yet been described.
We, therefore, set up a platform in which we successfully implemented strategies to ensure viability and functionality of both tumor cells and PBMCs in an ex vivo setting. Given the sensitivity of PBMCs, we incorporated M-CSF into the serum-containing medium to aid in monocyte survival and facilitate their differentiation into macrophages.16 Additionally, IL-2 and IL-15 were added to support the survival of T cells and NK cells.17,18
For the co-culture of the autologous PBMCs with GBM neurospheres, we determined that optimal cell viability and growth were achieved when GBM cells were plated in serum-free NS medium for 1 day before being transferred to IMDM+10%FBS. This preliminary incubation in NS medium, which contains selected growth factors, supports GBM cell recovery from the mechanical and enzymatic dissociation process and the formation of GBM neurospheres.19 Thus, by incorporating specific cytokines into the IMDM+10%FBS medium to support PBMC viability and function, and by implementing a serum-free NS medium preincubation step for GBM cells, we maintained the desired characteristics of both cell types in our autologous co-culture platform.
We next sought to determine whether GBM neurospheres could induce a local immunosuppressive microenvironment resembling the in situ situation.20 Our analyses revealed a notable downregulation of immune-related pathways, which play a crucial role in triggering immune responses, upon the addition of the PBMCs to the GBM neurospheres. Intriguingly, we observed a striking increase in the complement pathway score. Complement activation has been demonstrated to enhance the progression of malignancy in various cancer types.21 Notably, patients with GBM have been reported to have elevated serum C1q levels and intratumoral depositions of C3 and C5b9.22 Collectively, these findings strongly support the notion that the GBM cells within our model effectively preserve their immunosuppressive functions on neighboring immune cells, leading to a dampened immune response that mirrors the immunosuppressive traits observed in GBM in vivo.
To assess whether our co-culture model can capture the effects of an immunotherapeutic treatment, we tested our platform using an oncolytic adenovirus, which has shown promise in phase 1/2 trials for adult and pediatric gliomas.4,5,6,23 The initial phase of triggering antitumor responses after OV infection involves the activation of innate immune cells such as macrophages, NK cells, and dendritic cells. By incorporating lymphocytes from PBMCs into our model, we were able to investigate how secreted factors from the activated innate immune cells could affect the expression of activation markers on T cells independently of TCR signaling. By evaluating the PBMC phenotype as well as inflammatory proteins released in the supernatants following infection with different doses of OV, we demonstrated that our platform effectively captures the unique activation patterns of both innate and adaptive immune cells. Moreover, we were able to observe distinct expression of activation markers on PBMCs in the co-cultures from individual patients. It is important to highlight that after testing a large series of parameters in distinct co-culture sets, the presence of IFNγ in the supernatants emerged as a promising indicator of a phenotypically more activated state of T cells, NK cells, and monocyte-derived macrophages. To establish a robust connection between IFNγ production in the co-culture system and in vivo responses, additional studies are required to confirm IFNγ production as the most informative parameter.
Finally, it is worth noting that most patients with GBM receive corticosteroids, such as dexamethasone, pre- and post-surgery. Corticosteroids have immunosuppressive effects by suppressing the transcription factors responsible for induction of key pro-inflammatory cytokines such as IL-2 and IFNγ.24,25 However, in our study, we did not find a significant correlation between the use of dexamethasone by patients and the IFNγ response. This can be explained by the selection of viable cells through the Ficoll-based PBMC isolation method, which likely eliminated the affected cells during isolation. Nonetheless, it is worth noting that our study did not include samples from patients with dexamethasone exposure exceeding 20 days, limiting our ability to draw conclusions about the potential influence of long-term exposure on our co-cultures.
In summary, our proof-of-concept study presents an ex vivo co-culture model that enables the individual evaluation of the immune response to GBM treatment with OVs. This is of particular interest since OV trials consistently reveal a small subset of patients who exhibit long-term responses. Our model may hold potential as a preselection tool for the identification of those patients expected to respond to the specific OV under investigation.
One of the key advantages of our approach is that it requires only a small amount of blood (10 mL) and eliminates the need for expanding immune cells. Once a successful GBM neurosphere culture is established (2–3 weeks), the autologous GBM:PBMC co-culture can be performed in a total of 6 days, providing a clinically feasible strategy for individualized therapy. Further research and validation are needed to fully establish the utility of the model as a research tool and as a platform for evaluating patient-specific immune responses to OV therapy, which can potentially also be applied in other immunotherapies. With further investigations, we can enhance our understanding of immune cell-tumor interactions and improve future patient outcomes in the field of immunotherapy for GBM.
Limitations of the study
Although our model is very versatile in the parameters that can be evaluated, it has some limitations. One limitation is the inability to evaluate T cell-mediated killing, as we utilized peripheral immune cells without prior expansion of tumor-reactive T cells. Another limitation is the absence of neutrophils, which are an important cellular component of both the GBM immune microenvironment and antiviral activity; most granulocytes are lost during the Ficoll-Paque density gradient separation method.26,27,28 Consequently, we are unable to predict how the presence of neutrophils could alter the observed activation patterns.
STAR★Methods
Key resources table
| REAGENT or RESOURCE | SOURCE | IDENTIFIER |
|---|---|---|
| Antibodies | ||
| BUV395 conjugated mouse anti-human CD14 | BD Biosciences | Cat#740286; clone M5E2; RRID:AB_2740025 |
| BUV563 conjugated mouse anti-human CD56 | BD Biosciences | Cat# 612928; clone NCAM16.2; RRID:AB_2870213 |
| BUV661conjugated mouse anti-human CD3 | BD Biosciences | Cat#612964; clone UCHT1; RRID:AB_2870239 |
| BUV737 conjugated mouse anti-human CD19 | BD Biosciences | Cat#741829; clone HIB19; RRID:AB_2871164 |
| BUV805 conjugated mouse anti-human CD8 | BD Biosciences | Cat#749366; clone RPA-T8; RRID:AB_2873737 |
| PacB conjugated mouse anti-human CD38 | BioLegend | Cat#256628; clone HB-7; RRID:AB_2629731 |
| BV480 conjugated mouse anti-human CD11c | BD Biosciences | Cat#566135; clone B-ly6; RRID:AB_2739534 |
| BV570 conjugated mouse anti-human HLA-DR | BioLegend | Cat#30763; clone L243; RRID:AB_2650882 |
| BV605 conjugated mouse anti-human CD192 | BioLegend | Cat#357213; clone K036C2; RRID:AB_2562702 |
| BV650 conjugated mouse anti-human CD206 | BD Biosciences | Cat#740598; clone 19.2; RRID:AB_2740298 |
| BV711 conjugated mouse anti-human CD163 | BD Biosciences | Cat#563889; clone GHI/61; RRID:AB_2738469 |
| BV785 conjugated mouse anti-human CD69 | BD Biosciences | Cat#563834; clone FN50; RRID:AB_2738441 |
| Viobright FITC conjugated mouse anti-human Tim-3 | Miltenyi Biotec | Cat#130-126-004; clone F38-2E2; RRID:AB_2889789 |
| AF532 conjugated mouse anti-human CD45 | Thermo Fisher Scientific | Cat#58-0459-42; clone HI30; RRID:AB_11218673 |
| PE-Cy5 conjugated mouse anti-human CD64 | ITK Diagnostics | Cat#T8-644-T025; clone 10.1; RRID:AB_2891254 |
| PE-Cy7 conjugated mouse anti-human CD16 | BD Biosciences | Cat#560918; clone 3G8; RRID:AB_10563252 |
| SparkNIR685 conjugated mouse anti-human CD4 | Biolegend | Cat#344657; clone SK3; RRID:AB_2819980 |
| LIVE/DEAD Fixable Blue Dead Cell Stain Kit, for UV excitation | Thermo Fisher Scientific | Cat#L23105 |
| Bacterial and virus strains | ||
| DNX-2401 | DNAtrix | N/A |
| Biological samples | ||
| Human blood | Erasmus MC Neurosurgery | N/A |
| Chemicals, peptides, and recombinant proteins | ||
| GIBCO™ IMDM | Thermo Fisher Scientific | Cat#12440053 |
| GIBCO™ DMEM/F12 | Thermo Fisher Scientific | Cat#11320074 |
| GIBCO™ RPMI 1640 | Thermo Fisher Scientific | Cat#21875034 |
| GIBCO™ DPBS, no calcium, no magnesium | Thermo Fisher Scientific | Cat#14190169 |
| Fibroblast Growth Factor-Basic (AA 1–155) Recombinant Human Protein-1 mg | Thermo Fisher Scientifics | Cat#PHG0313 |
| Epidermal Growth Factor Recombinant Human Protein-1 mg | Thermo Fisher Scientifics, | Cat#PHG0313 |
| Gibco™ B-27® Supplement without vitamin A 50 × 10mL | Thermo Fisher Scientifics | Cat#12587-010 |
| Penicillin-Streptomycin (10000 U/mL)-100 mL | Thermo Fisher Scientifics | Cat#15140122 |
| 250MG Heparin sodium (MG) | Thermo Fisher Scientifics | Cat#10551944 |
| Fetal Bovine Serum, Qualified (Heat inactivated) (ML) | Thermo Fisher Scientifics | Cat#11580516 |
| 10μg rhM-CSF, Marcophage Colony Stimulating Factor recombinant human (E.coli-derived) | R&D Systems, | Cat#216-MC |
| 50μg Human IL-2 | PeproTech | Cat#200-02-50UG |
| 10μg Human IL-15 | PeproTech | Cat#200-15-10UG |
| Dimethyl Sulfoxide | Sigma-Aldrich | Cat#D8418-50ML |
| Acetic acid | Fluka® | Cat#45730 |
| Sodium Azide | Sigma-Aldrich | Cat#S2002-500G |
| Bovine Serum Albumin | Sigma-Aldrich | Cat#A9647-100G |
| Tween® 20, for molecular biology, viscous liquid | Sigma-Aldrich | Cat# P9416-100ML |
| TMB Microwell Peroxidase Substrate System | ELITechGroup BV | Cat #KPL-507600 |
| Sulfuric acid 98%for analysis EMSURE® | Supelco® | Cat#1120801000 |
| Ammonium chloride | Sigma-Aldrich | Cat#31107-500G |
| EDTA | Sigma-Aldrich | Cat#E5134-100G |
| Potassium bicarbonate | Sigma-Aldrich | Cat#237205-500G |
| Ficoll-Plaue | Cytiva | Cat#17144002 |
| Formaldehyde solution | Sigma-Aldrich | Cat#1004965000 |
| BD Pharm lyse™ | BD Biosciencees | Cat#555899 |
| Critical commercial assays | ||
| TaqMan® Gene Expression Assay TNF, FAM-MGB, S: 250 rxns | Thermo Fisher Scientific | Assay ID: Hs00174128_m1 |
| TaqMan® Gene Expression Assay IFNγ, FAM-MGB, S: 250 rxns | Thermo Fisher Scientific | Assay ID: Hs00989291_m1 |
| TaqMan® Gene Expression Assay IL6, FAM-MGB, S: 250 rxns | Thermo Fisher Scientific | Assay ID: Hs00174131_m1 |
| TaqMan® Gene Expression Assay IL10, FAM-MGB, S: 250 rxns | Thermo Fisher Scientific | Assay ID: Hs00174086_m1 |
| TaqMan™ Fast Virus 1-Step Master Mix | Thermo Fisher Scientific | Cat#4444432 |
| Human CCL2/MCP-1 Duoset ELISA | R&D ststems | Cat#DY279 |
| Human CCL4/MIP-1β Duoset ELISA | R&D ststems | Cat#DY271 |
| Human CXCL9/MIG Duoset ELISA | R&D ststems | Cat#DY392 |
| Human CXCL10/IP-10 Duoset ELISA | R&D ststems | Cat#DY266 |
| Human Granzyme B Duoset ELISA | R&D ststems | Cat#DY2906-05 |
| Human IFNγ Duoset ELISA | R&D ststems | Cat#DY285B |
| Human TNFα Duoset ELISA | R&D ststems | Cat#DY210 |
| Human IL-6 Duoset ELISA | R&D ststems | Cat#DY206 |
| Human IL-8 Duoset ELISA | R&D ststems | Cat#DY208 |
| RNeasy Mini Kit (50) | Qiagen | Cat#74104 |
| CellTiter-Glo Luminescent Cell Viability Assay | Promega | Cat#G9243 |
| Experimental models: Cell lines | ||
| GS.1018 | Erasmus MC, Dep. of Neursurgery | N/A |
| GS.1066 | Erasmus MC, Dep. of Neursurgery | N/A |
| GS.1067 | Erasmus MC, Dep. of Neursurgery | N/A |
| GS.1069 | Erasmus MC, Dep. of Neursurgery | N/A |
| GS.1083 | Erasmus MC, Dep. of Neursurgery | N/A |
| GS.1087 | Erasmus MC, Dep. of Neursurgery | N/A |
| GS.1091 | Erasmus MC, Dep. of Neursurgery | N/A |
| GS.1098 | Erasmus MC, Dep. of Neursurgery | N/A |
| GS.1100 | Erasmus MC, Dep. of Neursurgery | N/A |
| GS.1103 | Erasmus MC, Dep. of Neursurgery | N/A |
| GS.1108 | Erasmus MC, Dep. of Neursurgery | N/A |
| GS.1122 | Erasmus MC, Dep. of Neursurgery | N/A |
| GS.1134 | Erasmus MC, Dep. of Neursurgery | N/A |
| GS.1140 | Erasmus MC, Dep. of Neursurgery | N/A |
| GS.1149 | Erasmus MC, Dep. of Neursurgery | N/A |
| GS.1165 | Erasmus MC, Dep. of Neursurgery | N/A |
| GS.1191 | Erasmus MC, Dep. of Neursurgery | N/A |
| Oligonucleotides | ||
| Β-actin FW: GGCATCCACGAAACTACCTT | Erasmus MC, Dep. of Virosciences | BF136; GenBank accession# NM_001101 |
| Β-actin RV: AGCACTGTGTTGGCGTACAG | Erasmus MC, Dep. of Virosciences | BF137; GenBank accession# NM_001101 |
| Β-actin TAMRA probe: ATCATGAA GTGTGACGTGGACATCCA |
Erasmus MC, Dep. of Virosciences | BF138; GenBank accession# NM_001101 |
| Software and algorithms | ||
| nSolver software | Nanostring® Technologies | Version 4.0 |
| GraphPad Prism software | Dotmatics | Version 9.2.1 |
| Infinicyt™ software | Cytognos S.L | Version 2.0.6 |
Resource availability
Lead contact
Further information and requests for resources and reagents should be directed to the lead contact Martine Lamfers (m.lamfers@erasmusmc.nl).
Material availability
Patient-derived tumor cell cultures can be made available upon request directed to the lead contact and are facilitated by the completion of a Material Transfer Agreement (MTA) form. Peripheral blood mononuclear cells (PBMCs) availability is constrained due to their usage limitations in a restricted number of experiments.
Data and code availability
-
•
Raw nanostring and flow cytometry data reported in this paper will be shared by the lead contact upon request.
-
•
This paper does not report original code.
-
•
Any further information required to reanalyze the data reported in this study is available from the lead contact upon request.
Method details
Patient material and cell culture
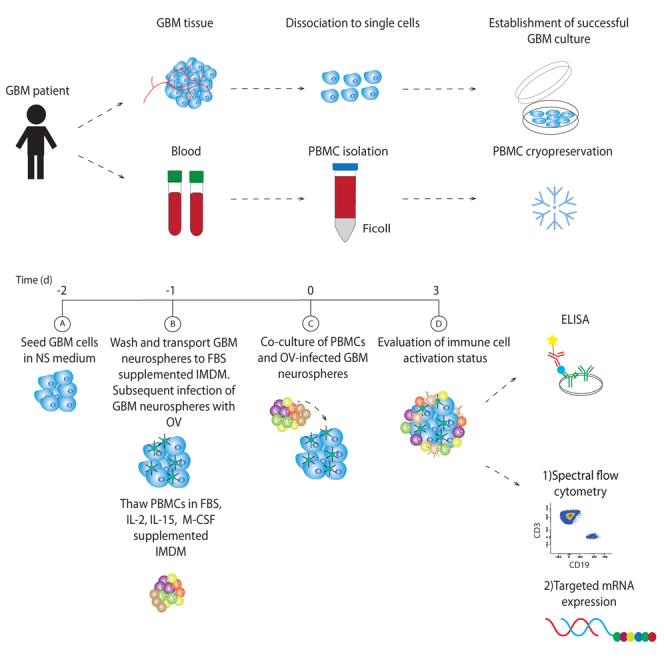
Patients undergoing tumor resection of suspected GBM provided tumor specimens and blood samples. All participating patients provided written informed consent for study participation. The study was approved by the local Medical Ethical Committee of Erasmus Medical Center Rotterdam (MEC-2013-090) in compliance with the Declaration of Helsinki. The age of the participants ranged from 53 to 84, with 12 male and 10 female participants (Table 1).
To obtain tumor neurosphere cultures, patient tumor tissue was processed and dissociated as previously described.29,30 After dissociation, erythrocyte lysis buffer (1mL 0.75M NH4Cl, 1mM EDTA, 0.1 KHCO3) was added for 10 min, and cells were subsequently washed with PBS, and transferred to neurosphere (NS) medium for the establishment of primary GBM culture. NS medium is DMEM/F12 medium (Gibco) supplemented with 1% Pencillin/Streptomycin (Gibco), 2% B27 (Gibco), bFGF, EGF (both 20 ng/mL, Thermo Fisher Scientific) and heparin (5 μg/mL, Sigma-Aldrich). Samples infected with mycoplasma were removed from further analysis.
Peripheral blood (10 mL) was drawn in sodium heparin-anticoagulated tubes (BD vacutainer) from adult GBM-suspected patients at the outpatient clinic and/or during surgical resection. PBMCs were isolated by Ficoll-Paque (Cytiva) density gradient separation and cryopreserved in RPMI (Gibco) supplemented with 18% (v/v) heat inactivated Fetal Bovine Serum (FBS) (Thermo Fisher Scientifics, cat no. 11580516) and 10% (v/v) DMSO (Sigma-Aldrich) at −80°C for later use. Samples were included in this study upon confirmation of GBM diagnosis.
Viruses and reagents
The conditionally replicating human adenovirus Delta24-RGD, also known as DNX-2401, was previously described31,32 and kindly provided by DNAtrix (San Diego).
Viability and EC50 assay
To monitor cell growth, we measured cell viability of GBM cells in different culture media over a period of 6 days using the CellTiter-Glo (CTG) Luminescent Cell Viability Assay (Promega) as previously described.33 Briefly, on day 0, 2000 GBM cells were seeded onto non-adherent 96-wells plates (Greiner) in NS medium or IMDM (Gibco) supplemented with 1% (v/v) penicillin-streptomycin (Gibco, Thermo Fisher Scientific, #15140122), 10% (v/v) FBS and allowed to form GBM neurospheres. On day 1 the GBM neurospheres in the "NS to IMDM" condition were transferred from their initial NS medium to IMDM+10%FBS+1%penicillin-streptomycin. The CTG assay was performed on day 1, 3 and 6 across all tested media. On day 1, the CTG was performed 6 h post-transfer to allow time for neurosphere recovery. All experimental conditions were tested in triplicate.
Sensitivity to oncolytic adenovirus was assessed by dose-response assays and calculation of the half maximal effective concentration (EC50). For this, GBM cells were seeded onto non-adherent 96-well plates (Greiner) for 3D neurosphere culture. After 24 h, the GBM neurospheres were infected with a multiplicity of infection (MOI) dose range of Delta24-RGD as indicated in the figure legends. Five days post infection, cell viability was determined using the CellTiter-Glo Luminescent Cell Viability Assay (Promega).
Co-culture and infection experiments
The success of the co-culture experiments hinges on two key factors: the availability of PBMCs, which can be limited, and the successful establishment of primary GBM cultures. The success rate, considering the constraints imposed by these critical factors, is quantified at 63%.
For the co-culture experiment, GBM cells were seeded in NS medium for 24 h in non-coated Nunc 24-wells plates (Thermo Fisher Scientific) to form neurospheres. Next, the neurospheres were washed twice with Dulbecco’s phosphate-buffered saline (PBS) (Gibco, Thermo Fisher Scientifics, #14190169) and were plated onto temperature-responsive Nunc Multidishes with UpCell Surface, 12 wells plate (Thermo Fisher Scientific, cat no. 174900) in GIBCO IMDM (Gibco, Thermo Fisher Scientifics, #12440053) supplemented with 1% (v/v) penicillin-streptomycin, 10% (v/v) FBS (Gibco). PBMCs were thawed in IMDM (Gibco) supplemented with 1% (v/v) penicillin-Streptomycin (Gibco, Thermo Fisher Scientific, #15140122), 10% (v/v) FBS, 5 ng/ml M-CSF (R&D Systems, #216-MC), 10 ng/mL IL-15 (PeproTech, cat no. 200-15-10UG) and 100 units/ml IL-2 (PeproTech, #200-02-50UG) and seeded onto temperature-responsive Nunc Multidishes with UpCell Surface, 12 wells plate (Thermo Fisher Scientific, cat no. 174900). The following day the PBMCs were transferred to the GBM cells, and they were co-cultured in a 1:4 ratio, unless stated otherwise.
For OV infection studies, GBM neurospheres were seeded as mentioned above and subsequently infected with Delta24-RGD at various MOIs, as specified in the figure captions. In parallel, PBMCs were thawed and allowed to recover overnight as described earlier. The next day (co-culture day 0), PBMCs were collected and added to GBM neurospheres, and after 72 h supernatant and cell pellets were collected for immune response evaluation. In co-culture experiments of Figure 2, we employed varying cell ratios. Specifically, we used 100.000 GBM cells and 100.000 PBMCs for a 1:1 ratio, 100.000 GBM cells and 200.000 PBMCs for a 1:2 ratio, and 100.000 GBM cells and 400.000 PBMCs for a 1:4 ratio. For the Nanostring analyses experiments, we utilized 100.000 GBM cells and 400.000 PBMCs. Furthermore, for all experiments where flow cytometry served as the readout, we utilized 200,000 GBM cells and 800,000 PBMCs.
Gene expression analyses
RNeasy mini kit (Qiagen, #74104) was used to isolate RNA from the co-cultures. Primers and probes were used to analyze cytokine expression, with the Β-actin gene as reference. Samples were run for 40 cycles on QuantStudio 3 Real-Time PCR (Applied Biosystems).
Nanostring analyses
The quality and quantity of isolated RNA samples were evaluated using the BioAnalyzer (Agilent Technologies, Inc, Santa Clara, CA) according to the manufacturer’s instructions. RNA concentration was adjusted based on the percentage of fragments greater than 300bp in each sample, as described previously.34 A total of 200 ng RNA was used for hybridization with the probes of PanCancer Immuno-Oncology 360 NanoString panel. The nCounter FLEX system (Nanostring Technologies) was employed for further processing following the manufacturer’s instructions (Nanostring Technologies, Inc., Seattle, WA), and the count of genes were determined by scanning 490 fields of view (FOV). Gene expression data were analyzed using the nSolver software (v. 4.0).
Cytokine analysis
Cytokine levels in co-culture supernatants were measured using the DuoSet Elisa kits, according to the manufacturer’s instructions. Data analyses were done using GraphPad Prism software 9.2.1.
Flow cytometry
A combination of 20-fluorochrome-conjugated antibodies was designed to investigate the activation status of PBMCs after co-culture. Samples were processed and stained according to the standardized EuroFlow protocols www.euroflow.org/protocols.35 All incubations were performed in the dark. Briefly, the cells of the co-culture were stained with the antibody panel for 30 min at room temperature, washed with PBS and incubated with a viability marker (LIVE/DEAD Fixable Blue Dead Cell Stain Kit, for UV excitation, Thermo Fisher Scientific) for 30 min at 4°C. Subsequently, cells were incubated in 1x BD Pharm lyse (BD Biosciences) for 10 min and then washed with PBS containing 0.5% bovine serum albumin and 0.1% sodium azide (FACs buffer). The samples were then incubated in PBS with 1% formaldehyde solution (Sigma-Aldrich, #1004965000) overnight. Before acquisition, cells were washed twice with PBS and subsequently measured with 5-Laser Aurora spectral flow cytometer (Cytek Biosciences). Data analysis was performed with Infinicyt software 2.0.6 (Cytognos S.L., Salamanca, Spain).
Quantification and statistical analysis
Statistical analysis was performed using one or two-way ANOVA or Spearman’s correlation in GraphPad Prism 9. The specific test used and p-value ranges are indicated in the figure legends. Differences were considered statistically significant when p < 0.05.
Acknowledgments
We would like to thank the patients with GBM for providing peripheral blood and tissue and the neurosurgeons and nurses of Erasmus MC involved in the surgeries. We thank M. Hameetman from the Flow Cytometry Core Facility (FCF) of LUMC in Leiden, the Netherlands, and Harm de Wit for technical support. We thank Jasper Dumas for the technical support of the Nanostring samples. We thank Stefan van Nieuwkoop for providing β-actin primers. This work was supported by Foundation OAK/Support Casper (www.supportcasper.nl), and C.T. is the recipient of an USAL4EXCELLENCE fellowship, funded by the European Union’s Horizon 2020 research and innovation program under the Marie Skłodowska-Curie COFUND actions (grant agreement no. 101034371), co-funded by the Junta de Castilla y León, Spain.
Author contributions
Conceptualization, E.S., W.B.L.v.d.B., C.M.F.D., and M.L.L.; methodology, E.S., W.B.L.v.d.B., C.T., R.K.B., and M.L.L.; investigation, E.S., W.B.L.v.d.B., and L.B.V.; writing – original draft, E.S.; writing – review & editing, E.S., W.B.L.v.d.B., C.T., D.M.M., J.J.M.v.D., C.M.F.D., R.K.B., and M.L.L.; funding acquisition, M.L.L.; resources, J.J.M.v.D.; supervision, M.L.L., R.K.B., and C.M.F.D.
Declaration of interests
The authors declare no competing interests.
Published: March 1, 2024
Footnotes
Supplemental information can be found online at https://doi.org/10.1016/j.crmeth.2024.100716.
Contributor Information
Eftychia Stavrakaki, Email: e.stavrakaki@erasmusmc.nl.
Martine L. Lamfers, Email: m.lamfers@erasmusmc.nl.
Supplemental information
References
- 1.De Witt Hamer P.C., Ho V.K.Y., Zwinderman A.H., Ackermans L., Ardon H., Boomstra S., Bouwknegt W., van den Brink W.A., Dirven C.M., van der Gaag N.A., et al. Between-hospital variation in mortality and survival after glioblastoma surgery in the Dutch Quality Registry for Neuro Surgery. J. Neuro Oncol. 2019;144:313–323. doi: 10.1007/s11060-019-03229-5. [DOI] [PMC free article] [PubMed] [Google Scholar]
- 2.Bausart M., Préat V., Malfanti A. Immunotherapy for glioblastoma: the promise of combination strategies. J. Exp. Clin. Cancer Res. 2022;41:35. doi: 10.1186/s13046-022-02251-2. [DOI] [PMC free article] [PubMed] [Google Scholar]
- 3.Desjardins A., Gromeier M., Herndon J.E., 2nd, Beaubier N., Bolognesi D.P., Friedman A.H., Friedman H.S., McSherry F., Muscat A.M., Nair S., et al. Recurrent Glioblastoma Treated with Recombinant Poliovirus. N. Engl. J. Med. 2018;379:150–161. doi: 10.1056/NEJMoa1716435. [DOI] [PMC free article] [PubMed] [Google Scholar]
- 4.Lang F.F., Conrad C., Gomez-Manzano C., Yung W.K.A., Sawaya R., Weinberg J.S., Prabhu S.S., Rao G., Fuller G.N., Aldape K.D., et al. Phase I Study of DNX-2401 (Delta-24-RGD) Oncolytic Adenovirus: Replication and Immunotherapeutic Effects in Recurrent Malignant Glioma. J. Clin. Oncol. 2018;36:1419–1427. doi: 10.1200/JCO.2017.75.8219. [DOI] [PMC free article] [PubMed] [Google Scholar]
- 5.Nassiri F., Patil V., Yefet L.S., Singh O., Liu J., Dang R.M.A., Yamaguchi T.N., Daras M., Cloughesy T.F., Colman H., et al. Oncolytic DNX-2401 virotherapy plus pembrolizumab in recurrent glioblastoma: a phase 1/2 trial. Nat. Med. 2023;29:1370–1378. doi: 10.1038/s41591-023-02347-y. [DOI] [PMC free article] [PubMed] [Google Scholar]
- 6.van Putten E.H.P., Kleijn A., van Beusechem V.W., Noske D., Lamers C.H.J., de Goede A.L., Idema S., Hoefnagel D., Kloezeman J.J., Fueyo J., et al. Convection Enhanced Delivery of the Oncolytic Adenovirus Delta24-RGD in Patients with Recurrent GBM: A Phase I Clinical Trial Including Correlative Studies. Clin. Cancer Res. 2022;28:1572–1585. doi: 10.1158/1078-0432.CCR-21-3324. [DOI] [PMC free article] [PubMed] [Google Scholar]
- 7.Jackson C.M., Choi J., Lim M. Mechanisms of immunotherapy resistance: lessons from glioblastoma. Nat. Immunol. 2019;20:1100–1109. doi: 10.1038/s41590-019-0433-y. [DOI] [PubMed] [Google Scholar]
- 8.Swildens K.X., Sillevis Smitt P.A.E., van den Bent M.J., French P.J., Geurts M. The effect of dexamethasone on the microenvironment and efficacy of checkpoint inhibitors in glioblastoma: a systematic review. Neurooncol. Adv. 2022;4:vdac087. doi: 10.1093/noajnl/vdac087. [DOI] [PMC free article] [PubMed] [Google Scholar]
- 9.Lemos de Matos A., Franco L.S., McFadden G. Oncolytic Viruses and the Immune System: The Dynamic Duo. Mol. Ther. Methods Clin. Dev. 2020;17:349–358. doi: 10.1016/j.omtm.2020.01.001. [DOI] [PMC free article] [PubMed] [Google Scholar]
- 10.Chiocca E.A., Nassiri F., Wang J., Peruzzi P., Zadeh G. Viral and other therapies for recurrent glioblastoma: is a 24-month durable response unusual? Neuro Oncol. 2019;21:14–25. doi: 10.1093/neuonc/noy170. [DOI] [PMC free article] [PubMed] [Google Scholar]
- 11.Dijkstra K.K., Cattaneo C.M., Weeber F., Chalabi M., van de Haar J., Fanchi L.F., Slagter M., van der Velden D.L., Kaing S., Kelderman S., et al. Generation of Tumor-Reactive T Cells by Co-culture of Peripheral Blood Lymphocytes and Tumor Organoids. Cell. 2018;174:1586–1598.e12. doi: 10.1016/j.cell.2018.07.009. [DOI] [PMC free article] [PubMed] [Google Scholar]
- 12.van den Bossche W.B.L., Kleijn A., Teunissen C.E., Voerman J.S.A., Teodosio C., Noske D.P., van Dongen J.J.M., Dirven C.M.F., Lamfers M.L.M. Oncolytic virotherapy in glioblastoma patients induces a tumor macrophage phenotypic shift leading to an altered glioblastoma microenvironment. Neuro Oncol. 2018;20:1494–1504. doi: 10.1093/neuonc/noy082. [DOI] [PMC free article] [PubMed] [Google Scholar]
- 13.Klein E., Hau A.C., Oudin A., Golebiewska A., Niclou S.P. Glioblastoma Organoids: Pre-Clinical Applications and Challenges in the Context of Immunotherapy. Front. Oncol. 2020;10:604121. doi: 10.3389/fonc.2020.604121. [DOI] [PMC free article] [PubMed] [Google Scholar]
- 14.Afshari A.R., Sanati M., Aminyavari S., Shakeri F., Bibak B., Keshavarzi Z., Soukhtanloo M., Jalili-Nik M., Sadeghi M.M., Mollazadeh H., et al. Advantages and drawbacks of dexamethasone in glioblastoma multiforme. Crit. Rev. Oncol. Hematol. 2022;172:103625. doi: 10.1016/j.critrevonc.2022.103625. [DOI] [PubMed] [Google Scholar]
- 15.Pham T., Roth S., Kong J., Guerra G., Narasimhan V., Pereira L., Desai J., Heriot A., Ramsay R. An Update on Immunotherapy for Solid Tumors: A Review. Ann. Surg Oncol. 2018;25:3404–3412. doi: 10.1245/s10434-018-6658-4. [DOI] [PubMed] [Google Scholar]
- 16.Brugger W., Kreutz M., Andreesen R. Macrophage colony-stimulating factor is required for human monocyte survival and acts as a cofactor for their terminal differentiation to macrophages in vitro. J. Leukoc. Biol. 1991;49:483–488. doi: 10.1002/jlb.49.5.483. [DOI] [PubMed] [Google Scholar]
- 17.de Rham C., Ferrari-Lacraz S., Jendly S., Schneiter G., Dayer J.M., Villard J. The proinflammatory cytokines IL-2, IL-15 and IL-21 modulate the repertoire of mature human natural killer cell receptors. Arthritis Res. Ther. 2007;9:R125. doi: 10.1186/ar2336. [DOI] [PMC free article] [PubMed] [Google Scholar]
- 18.Kelly E., Won A., Refaeli Y., Van Parijs L. IL-2 and related cytokines can promote T cell survival by activating AKT. J. Immunol. 2002;168:597–603. doi: 10.4049/jimmunol.168.2.597. [DOI] [PubMed] [Google Scholar]
- 19.Lai T.Y., Cao J., Ou-Yang P., Tsai C.Y., Lin C.W., Chen C.C., Tsai M.K., Lee C.Y. Different methods of detaching adherent cells and their effects on the cell surface expression of Fas receptor and Fas ligand. Sci. Rep. 2022;12:5713. doi: 10.1038/s41598-022-09605-y. [DOI] [PMC free article] [PubMed] [Google Scholar]
- 20.Grabowski M.M., Sankey E.W., Ryan K.J., Chongsathidkiet P., Lorrey S.J., Wilkinson D.S., Fecci P.E. Immune suppression in gliomas. J. Neuro Oncol. 2021;151:3–12. doi: 10.1007/s11060-020-03483-y. [DOI] [PMC free article] [PubMed] [Google Scholar]
- 21.Revel M., Daugan M.V., Sautés-Fridman C., Fridman W.H., Roumenina L.T. Complement System: Promoter or Suppressor of Cancer Progression? Antibodies. 2020;9:57. doi: 10.3390/antib9040057. [DOI] [PMC free article] [PubMed] [Google Scholar]
- 22.Bouwens van der Vlis T.A.M., Kros J.M., Mustafa D.A.M., van Wijck R.T.A., Ackermans L., van Hagen P.M., van der Spek P.J. The complement system in glioblastoma multiforme. Acta Neuropathol. Commun. 2018;6:91. doi: 10.1186/s40478-018-0591-4. [DOI] [PMC free article] [PubMed] [Google Scholar]
- 23.Garcia-Moure M., Gonzalez-Huarriz M., Labiano S., Guruceaga E., Bandres E., Zalacain M., Marrodan L., de Andrea C., Villalba M., Martinez-Velez N., et al. Delta-24-RGD, an Oncolytic Adenovirus, Increases Survival and Promotes Proinflammatory Immune Landscape Remodeling in Models of AT/RT and CNS-PNET. Clin. Cancer Res. 2021;27:1807–1820. doi: 10.1158/1078-0432.CCR-20-3313. [DOI] [PMC free article] [PubMed] [Google Scholar]
- 24.Cain D.W., Cidlowski J.A. Immune regulation by glucocorticoids. Nat. Rev. Immunol. 2017;17:233–247. doi: 10.1038/nri.2017.1. [DOI] [PMC free article] [PubMed] [Google Scholar]
- 25.Hu X., Li W.P., Meng C., Ivashkiv L.B. Inhibition of IFN-gamma signaling by glucocorticoids. J. Immunol. 2003;170:4833–4839. doi: 10.4049/jimmunol.170.9.4833. [DOI] [PubMed] [Google Scholar]
- 26.Ma Y., Zhang Y., Zhu L. Role of neutrophils in acute viral infection. Immun. Inflamm. Dis. 2021;9:1186–1196. doi: 10.1002/iid3.500. [DOI] [PMC free article] [PubMed] [Google Scholar]
- 27.Wang G., Wang J., Niu C., Zhao Y., Wu P. Neutrophils: New Critical Regulators of Glioma. Front. Immunol. 2022;13:927233. doi: 10.3389/fimmu.2022.927233. [DOI] [PMC free article] [PubMed] [Google Scholar]
- 28.Yee P.P., Wei Y., Kim S.Y., Lu T., Chih S.Y., Lawson C., Tang M., Liu Z., Anderson B., Thamburaj K., et al. Neutrophil-induced ferroptosis promotes tumor necrosis in glioblastoma progression. Nat. Commun. 2020;11:5424. doi: 10.1038/s41467-020-19193-y. [DOI] [PMC free article] [PubMed] [Google Scholar]
- 29.Balvers R.K., Kleijn A., Kloezeman J.J., French P.J., Kremer A., van den Bent M.J., Dirven C.M.F., Leenstra S., Lamfers M.L.M. Serum-free culture success of glial tumors is related to specific molecular profiles and expression of extracellular matrix-associated gene modules. Neuro Oncol. 2013;15:1684–1695. doi: 10.1093/neuonc/not116. [DOI] [PMC free article] [PubMed] [Google Scholar]
- 30.Verheul C., Ntafoulis I., Kers T.V., Hoogstrate Y., Mastroberardino P.G., Barnhoorn S., Payán-Gómez C., Tching Chi Yen R., Struys E.A., Koolen S.L.W., et al. Generation, characterization, and drug sensitivities of 12 patient-derived IDH1-mutant glioma cell cultures. Neurooncol. Adv. 2021;3:vdab103. doi: 10.1093/noajnl/vdab103. [DOI] [PMC free article] [PubMed] [Google Scholar]
- 31.Balvers R.K., Belcaid Z., van den Hengel S.K., Kloezeman J., de Vrij J., Wakimoto H., Hoeben R.C., Debets R., Leenstra S., Dirven C., Lamfers M.L.M. Locally-delivered T-cell-derived cellular vehicles efficiently track and deliver adenovirus delta24-RGD to infiltrating glioma. Viruses. 2014;6:3080–3096. doi: 10.3390/v6083080. [DOI] [PMC free article] [PubMed] [Google Scholar]
- 32.Fueyo J., Alemany R., Gomez-Manzano C., Fuller G.N., Khan A., Conrad C.A., Liu T.J., Jiang H., Lemoine M.G., Suzuki K., et al. Preclinical characterization of the antiglioma activity of a tropism-enhanced adenovirus targeted to the retinoblastoma pathway. J. Natl. Cancer Inst. 2003;95:652–660. doi: 10.1093/jnci/95.9.652. [DOI] [PubMed] [Google Scholar]
- 33.Kleijn A., Kloezeman J.J., Balvers R.K., van der Kaaij M., Dirven C.M.F., Leenstra S., Lamfers M.L.M. A Systematic Comparison Identifies an ATP-Based Viability Assay as Most Suitable Read-Out for Drug Screening in Glioma Stem-Like Cells. Stem Cells Int. 2016;2016:5623235. doi: 10.1155/2016/5623235. [DOI] [PMC free article] [PubMed] [Google Scholar]
- 34.van Eijck C.W.F., de Koning W., van der Sijde F., Moskie M., Groot Koerkamp B., Homs M.Y.V., van der Burg S.H., van Eijck C.H.J., Mustafa D.A.M. A multigene circulating biomarker to predict the lack of FOLFIRINOX response after a single cycle in patients with pancreatic ductal adenocarcinoma. Eur. J. Cancer. 2023;181:119–134. doi: 10.1016/j.ejca.2022.12.024. [DOI] [PubMed] [Google Scholar]
- 35.van der Pan K., Khatri I., de Jager A.L., Louis A., Kassem S., Naber B.A.E., de Laat I.F., Hameetman M., Comans S.E.T., Orfao A., et al. Performance of spectral flow cytometry and mass cytometry for the study of innate myeloid cell populations. Front. Immunol. 2023;14:1191992. doi: 10.3389/fimmu.2023.1191992. [DOI] [PMC free article] [PubMed] [Google Scholar]
Associated Data
This section collects any data citations, data availability statements, or supplementary materials included in this article.
Supplementary Materials
Data Availability Statement
-
•
Raw nanostring and flow cytometry data reported in this paper will be shared by the lead contact upon request.
-
•
This paper does not report original code.
-
•
Any further information required to reanalyze the data reported in this study is available from the lead contact upon request.