Abstract
The transcription factor MYC is a well-described oncogene with an important role in lymphomagenesis, but its significance for clinical outcome in mantle cell lymphoma (MCL) remains to be determined. We performed an investigation of the expression of MYC protein in a cohort of 251 MCL patients complemented by analyses of structural aberrations and mRNA, in a sub-cohort of patients. Fourteen percent (n=35) of patients showed high MYC protein expression with >20% positive cells (MYChigh), among whom only one translocation was identified, and 86% (n=216) of patients showed low MYC protein expression. Low copy number gains of MYC were detected in ten patients, but with no correlation to MYC protein levels. However, MYC mRNA levels correlated significantly to MYC protein levels with a R2 value of 0.76. Patients with a MYChigh tumor had both an independent inferior overall survival and an inferior progression-free survival (hazard ratio [HR]=2.03, 95% confidence interval [95% CI]: 1.2-3.4 and HR=2.2, 95% CI: 1.04-4.6, respectively) when adjusted for additional high-risk features. Patients with MYChigh tumors also tended to have additional high-risk features and to be older at diagnosis. A subgroup of 13 patients had concomitant MYChigh expression and TP53/p53 alterations and a substantially increased risk of progression (HR=16.9, 95% CI: 7.4-38.3) and death (HR=7.8, 95% CI: 4.4-14.1) with an average overall survival of only 0.9 years. In summary, we found that at diagnosis a subset of MCL patients (14%) overexpressed MYC protein, and had a poor prognosis but that MYC rearrangements were rare. Tumors with concurrent MYC overexpression and TP53/p53 alterations pinpointed MCL patients with a dismal prognosis with a median overall survival of less than 3 years. We propose that MYC needs to be assessed beyond the current high-risk factors in MCL in order to identify cases in need of alternative treatment.
Introduction
MYC is a pleiotropic transcription factor that regulates 10-15% of the genome and can simultaneously affect protein-coding genes and non-coding RNA products.1,2 It is involved in a plethora of essential cellular mechanisms, such as cell growth, metabolism and protein synthesis, cell adhesion, apoptosis, cell cycle, and angiogenesis.1-3 MYC is an important factor in B-cell proliferation known to be involved in lymphomagenesis,3 and its deregulation is frequently associated with worse outcome.2-4
Translocations involving MYC and immunoglobulin genes are described in other B-cell lymphomas, particularly Burkitt and double-hit lymphomas, and are associated with aggressive behavior of the malignancy.2 Overexpression of MYC without genetic rearrangements also has a negative impact on outcome in B-cell lymphomas in general.5 In mantle cell lymphoma (MCL), mutations of MYC have been shown to occur in around 20% of cases,6 and MYC-regulated pathways are often affected by genetic alterations in subsets of disease.7 Cytogenetic investigations of MYC were recently recommended as part of clinical routine but are not yet clinically implemented in most hospitals.8 The frequency of translocations involving MYC is reportedly low9-11 and most reports have been case studies describing translocations that juxtapose MYC and CCND1.12-15 In general, consensus on the degree of MYC deregulation in MCL is lacking. Here, we aim to describe the frequency of protein expression, mRNA, translocations, and amplifications of MYC in primary MCL and relate the findings to clinicopathological parameters and outcome.
MCL is a disease with a heterogeneous clinical behavior characterized by the chromosomal t(11;14)(q13;q32) that juxtaposes CCND1 to immunoglobulin genes, leading to constitutive cyclin D1 overexpression.16 An established prognostic tool, the MCL International Prognostic Index (MIPI), integrates information on age, performance status, lactate dehydrogenase levels and white blood cell count and stratifies patients into high, intermediate and low risk.17 Additional biological risk factors include TP53 mutations and/ or p53 overexpression, high proliferation, and non-classic morphology.16 Despite recent improvements in treatment,18 MCL patients often have a poor prognosis and frequently relapse.19 Thus, identification and improved understanding of alterations in MCL lymphomagenesis, beyond the already established risk factors, are critical in order to be able to individualize therapeutic decision-making.
To date, a limited number of studies have focused on MYC in MCL. In 2017, Hu et al. showed that MYC rearrangements were present in less than 1.0% of MCL cases at diagnosis, with these cases having a median overall survival (OS) of 31.3 months.20 When compared with other subtypes of lymphoma, MCL tumors seem to have a lower frequency of structural alterations involving MYC.21 Nonetheless, in an evaluation of 88 patients, Wang et al. described 27 with tumors with MYC rearrangements and 21 with extra copies of MYC. Both subgroups of patients showed a lower OS when compared to cases with no MYC aberrations.22 However, the study by Wang et al., and other investigations reporting MYC translocations, were selected cohorts enriched for structural alterations involving MYC.9,20,23 An extensive study evaluating 1,214 lymphomas, including 138 cases of MCL, did not find any MYC rearrangements in MCL cases and only 2% had MYC protein overexpression >26%.11
Overall, MYC aberrations in MCL have been associated with a worse prognosis,10,23,24 non-classic morphology20,21,23,24 and, reportedly, enrichment for p53 overexpression among MYC-overexpressing tumors,24-26 but their additive role in MCL prognosis and clinical characteristics has not been determined. A study in diffuse large B-cell lymphoma showed that tumors with dual MYC/TP53 alterations had distinct clinicopathological characteristics with worse survival compared to wild-type cases.27
In the current study, we investigated the frequency of each molecular layer of MYC deregulation in primary diagnostic samples from a cohort of MCL patients and identified its association with both clinical and molecular high-risk factors.
Methods
Patients’ material
Two hundred and fifty-two MCL patients were included in this study, and 154 patients were part of a population-based cohort that comprised patients registered in the Swedish Lymphoma Register (SLR) and diagnosed in Uppsala and Southern Sweden between 2000-2017. The additional 98 samples were derived from patients enrolled in the Nordic Lymphoma Group clinical trials MCL2 and MCL3 (N-MCL2/3) (Online Supplementary Figure S1). The N-MCL2 trial was registered with ISRCTN.com ID ISRCTN87866680; the N-MCL3 trial was registered with ClinicalTrials.gov ID NCT00514475. Further details are provided in the Online Supplementary Materials and Methods.
This study was approved by the Ethical Regional Committee in Lund (Dnr 2011/593) for part of the SLR cohort (BLISS) and by the Ethical Regional Committee in Uppsala for the N-MCL2/3 samples (Dnr 2009/428) and for part of the SLR cohort (U-CAN) (Dnr 2014/233).
Immunohistochemistry
The patients’ tissue microarrays were stained with anti-MYC antibody (clone Y69 1:50, Abcam; Cambridge, UK), as used in the clinical setting and in previous publications.10,24 Tissue samples were considered to overexpress MYC when the percentage of cells with a dark brown nucleus was ≥20%, in agreement with published data.24 Details about the immunohistochemistry investigaions are provided in the Online Supplementary Materials and Methods.
Fluorescent in-situ hybridization
Fluorescent in-situ hybridization (FISH) was performed on 4 μm tissue sections using split-signal DNA probes for MYC with Vysis MYC Break Apart FISH Probe (Abbott Laboratories; Green Oaks, IL, USA) according to instructions from the manufacturer. An Olympus BX-51 microscope (Prior Lumen200 light source) and GenASIs Capture and Analysis Platform software (Applied Spectral Imaging; Carlsbad, CA, USA) were used to capture digital images of tumor areas. Cases without representative tumor material or with no representative signals were excluded. Positive FISH results on tissue microarrays were validated by evaluating whole-tissue sections.
mRNA in situ hybridization
MYC mRNA was evaluated in 85 fresh-frozen, paraffin-embedded samples from the SLR cohort with the RNAscope® assay (Advanced Cell Diagnostics; Newark, CA, USA) following the manufacturer’s instructions. The H-score was calculated for each sample, and was defined as the dynamic range of MYC expression based on the quantification of the probe signal on a cell-by-cell level. The workflow is described in detail in the Online Supplementary Materials and Methods.
Multiplexed immunofluorescence staining
Tissue microarray slides were stained with anti-CD20 (11.9 µg/mL, clone IGEL/773, Novus Biologicals, Littleton, CO, USA), anti-CD3 (2 µg/mL, clone UM500048CF, OriGene; Rockville, MD, USA) conjugated with AlexaFluor 532 antibody labeling kit (Thermo Fisher Scientific, Waltham, MA, USA), anti-CD163 (1.25 µg/mL, clone EPR14643-36, Abcam; Cambridge, UK) conjugated with AlexaFluor 647 antibody labeling kit (Thermo Fisher Scientific), and Syto13 (500 nM, Nanostring, Seattle, WA, USA).
A software for deep learning artificial intelligence, Aiforia Create Version 5.3 (Aiforia Technologies Plc, Helsinki, Finland), was used for image analyses as further described in the Online Supplementary Materials and Methods.
Statistical analysis
A χ2 test, t test or Wilcoxon signed-rank test was used to evaluate differences between groups. The Pearson correlation coefficient was applied to test correlations between continuous variables. The outcome variables considered in the study were OS and PFS. Maximally selected rank statistics (Max Rank) in R28 was used to determine a cutoff for MYC. Differences were considered statistically significant when the P value was <0.05. A detailed description of the statistical analysis is provided in the Online Supplementary Materials and Methods.
Results
Patients’ clinicopathological characteristics
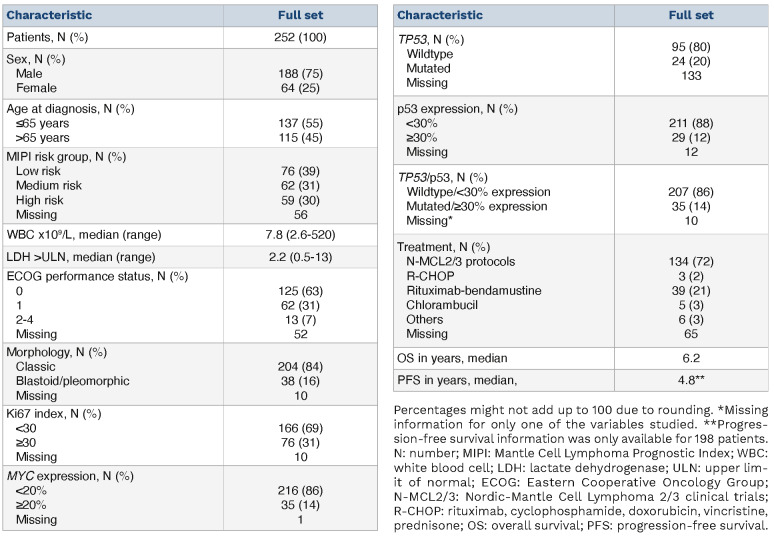
A total of 252 patients were included in this study (Table 1), with 98 patients belonging to the N-MCL2/3 clinical trials and 154 patients being part of the SLR cohort. Male patients were predominant (75%) and the median age at diagnosis was 63 years. Patients were evenly distributed among the different MIPI risk groups, but this information was only available for 196 of the 252 patients. Thirty-one percent (76/242) of the patients had highly proliferative tumors (Ki67 >30%) and 16% (38/242) had non-classic morphology. A subgroup of patients had tumors with high expression of p53 (12%, 29/240) and/or TP53 mutations (20%, 24/119). Thus, 35/242 cases had either high p53 protein expression or a TP53 mutation. The discrepancy in frequency between the p53 and TP53 evaluation is mostly due to the lower number of samples sequenced, restricted by the availability of high-quality material. Overall, patients had a median OS of 6.2 years and a median PFS of 4.8 years. Of note, OS information was available for all patients included, whereas PFS was calculated based on 200 patients. The patients’ clinicopathological characteristics, divided by cohort, can be found in Online Supplementary Table S1.
Table 1.
Clinicopathological characteristics of the patients included in this study.
MYC overexpression
Based on previous studies in which MYC expression was assessed in a cohort of 65 cases of MCL,24 a cutoff of 20% was used to define patients with MYC protein overexpression (MYChigh). Immunohistochemistry was used to determine MYC protein expression. The mean expression was 13.1% (range, 0.14-82.9%) and the median expression was 8.7%. Max Rank statistics showed that OS outcome differences were maximized when groups were dichotomized with a cutoff at 21.4%, supporting the applicability of the 20% cutoff used to define MYC overexpression.24 Using the 20% cutoff, MYC was overexpressed in 14% of all tumor samples studied (35/252) (Table 1). Online Supplementary Figure S2 shows representative immunohistochemistry staining for MYC.
MYC mRNA and immunohistochemistry results are concordant
To evaluate MYC mRNA expression levels, we performed RNAscope®; representative images of the staining are shown in Online Supplementary Figure S3. An H-score for MYC mRNA expression was calculated, which showed a strong correlation (Pearson) to the frequency of positive cells detected by immunohistochemistry (Online Supplementary Figures S4 and S5) with a R2 value of 0.76 (P<0.001), in the same range as previously reported for MCL.10 Information about the cohort used for RNAscope® can be found in Online Supplementary Table S2.
MYChigh is associated with poor outcome
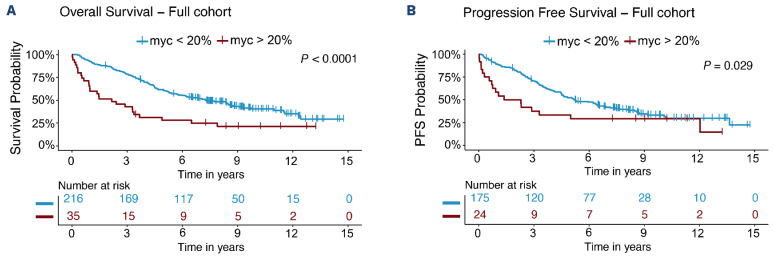
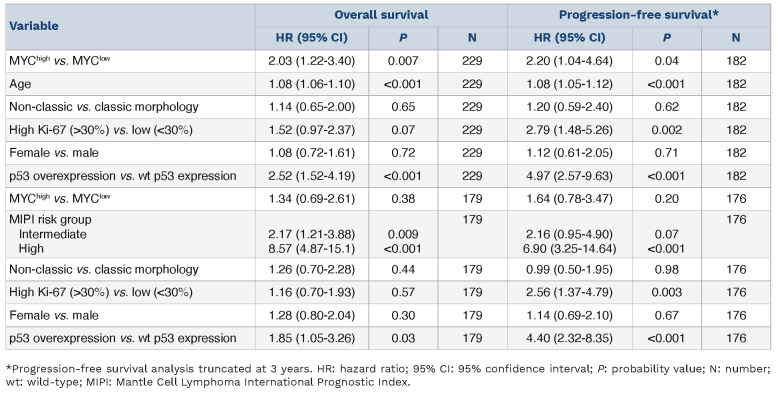
Outcome in patients with MYChigh tumors was inferior compared to that of patients with MYClow tumors (Figure 1). Patients with MYChigh MCL had a median OS of 2.2 years and PFS of 1.8 years, whereas patients with MYClow tumors had a median OS of 7.3 years and PFS of 5.2 years. In concordance, patients with MYChigh tumors also had a significantly higher risk of death (hazard ratio [HR]=2.34, 95% confidence interval [955 CI]: 1.55-3.57) and disease progression (HR=1.73, 95% CI: 1.05-2.86) compared to patients with MYClow tumors. The frequency of MYC-positive cells was also significantly associated with poor outcome as a continuous variable, for both OS and PFS. However, per increased percentage of MYC-positive cells, the risk of death or progression only increased by 3% and 4%, respectively (Table 2). Likewise, for MYC mRNA (as a continuous value), a higher H-score was associated with inferior survival and shorter progression-free survival, albeit with a low hazard ratio per H-score unit increase (Table 2). MYC protein measurements violated the proportional hazards assumption, showing a greater impact on short-term survival (Online Supplementary Figure S6). Of the cases classified as MYChigh, 57% died and 62% progressed within the first 3 years (Figure 1). In a follow-up of 3 years, the proportional hazards assumption for PFS was not violated and a negative impact on survival could be observed (Online Supplementary Table S3). Similar trends were seen when evaluating the effect of MYChigh and MYC frequency as a continuous value on outcome for the different cohorts separately (Online Supplementary Figure S7, Online Supplementary Table S4). However, in the SLR cohort, MYChigh was not statistically prognostic for PFS, probably because of the heterogenous treatment protocols used in this population-based cohort. In the N-MCL2/3 cohort, only six patients were classified as MYChigh and the group reached statistical significance as predictor for PFS, but not OS (Online Supplementary Table S4).
Figure 1.
Patients with tumors with MYChigh protein overexpression have a worse outcome than patients with MYClow tumors. (A, B) Prognostic impact of MYC protein expression on overall survival (A) and progression-free survival (B). Samples (N=252) were categorized based on total percentage of MYC-expressing cells, with a cutoff of 20%. Kaplan-Meier estimates were calculated and are shown. Log-rank statistics were used to evaluate the statistical significance. PFS: progression-free survival.
To understand if there were consistent differences among MYChigh cases depending on whether they had an OS shorter or longer than 3 years, we compared the main clinicopathological parameters of these two groups of patients (Online Supplementary Table S5). The patients with an OS less than 3 years had additional high-risk factors, being in a high-risk MIPI group and the majority also with high proliferation and/ or TP53/p53 aberrations. Surprisingly, the male/female ratio showed a major difference, with only one out of nine female MYChigh patients surviving for more than 3 years.
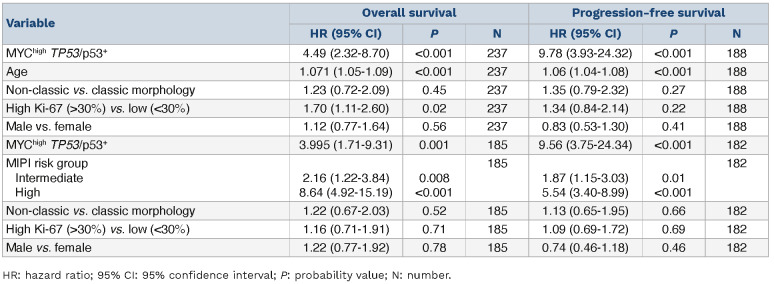
MYChigh tumors remained associated with OS (HR=2.03, 95% CI: 1.22-3.40) and PFS (HR=2.20, 95% CI: 1.04-4.64) when adjusting for gender, age and established high-risk factors (Table 3). MYChigh was not significant when adjusting for MIPI group (Table 3). Of note, evaluation of MYC protein expression on prognosis in MCL remained significant only when considering patients with MIPI information (Online Supplementary Table S6). MYC as a continuous variable was not independent of high-risk factors (data not shown).
MYChigh is associated with high-risk factors
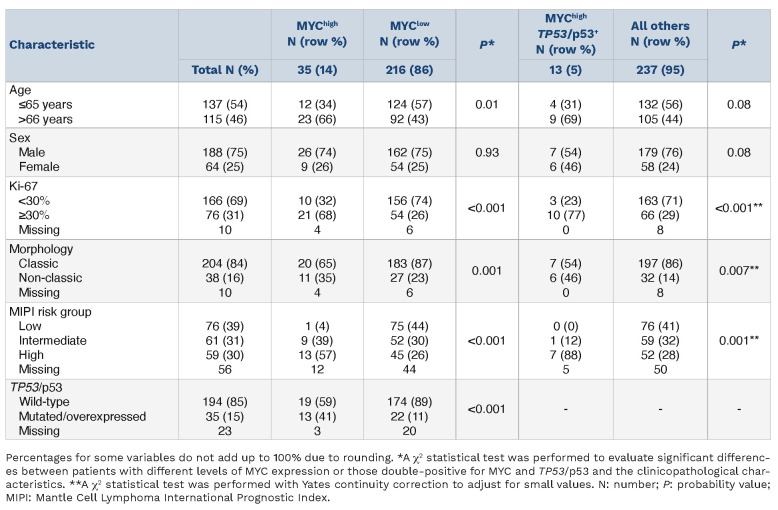
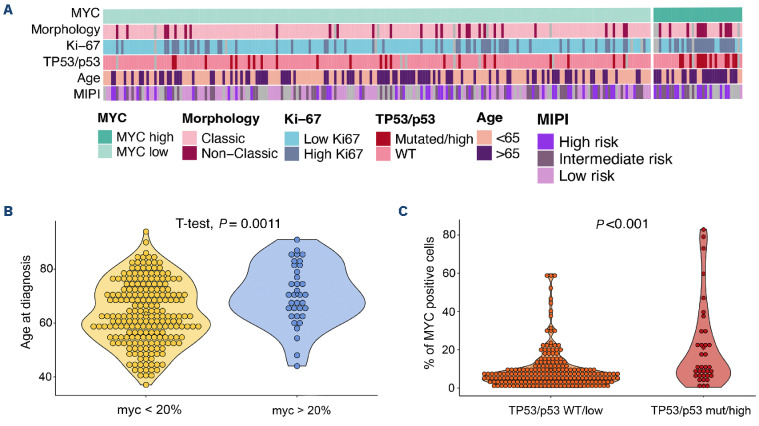
Patients with MYChigh tumors were enriched in other high-risk factors such as age, Ki-67 proliferation index, non-classic morphology, MIPI group and TP53/p53+ aberrations (Figure 2A, Table 4). Patients with MYChigh tumors were on average older at diagnosis (Figure 2B), with a median age at diagnosis of 70.7 years versus 63.6 years for patients with MYClow tumors. MYC protein overexpression (MYChigh) was found to be associated with the presence of TP53 mutations and/or p53 overexpression (hereon referred to as TP53/p53+ tumors, n=35). Dual alterations of MYC and TP53/p53+ (hereon referred to as MYChigh TP53/p53+) were detected in 13 out of 250 patients (Table 4). Tumors with alterations in TP53 had a higher median expression of MYC-positive cells compared to wild-type tumors (P<0.001) (Figure 2C) and MYChigh TP53/ p53+ cases were more likely to have high proliferation, non-classic morphology and be in a high-risk MIPI group, similar to the MYChigh group (Table 4).
MYChigh TP53/p53+ tumors have a dismal prognosis
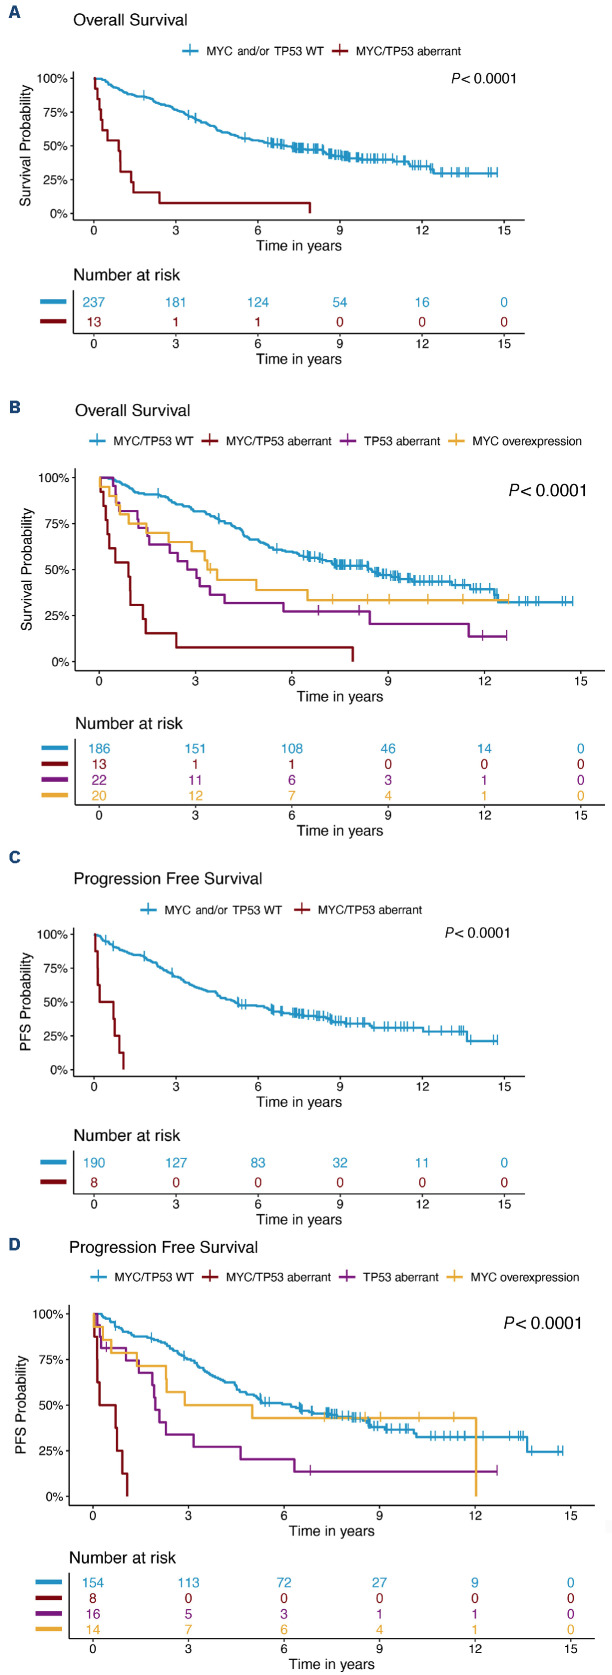
A total of 13 patients had tumors classified as MYChigh TP53/ p53+. These patients had a very short median survival (0.9 years) and a shorter median PFS (0.5 years) compared to patients who did not show concomitant alterations in these molecules. The majority died within 3 years of diagnosis (Figure 3A). This was significantly lower compared to either one of the individual high-risk groups (Figure 3B). All patients with PFS information available with MYChigh TP53/p53+ tumors progressed within 2 years (Figure 3C) and had a shorter time to progression than either of the patient groups presenting with only one of the individual risk factors (Figure 3D). Online Supplementary Figure S8 depicts the process for classification of tumors based on MYC and TP53/p53 status. Double aberrations conferred an increased risk of death (HR=7.83, 95% CI: 4.35-14.09) and disease progression (HR=16.87, 95% CI: 7.43-38.31) (Table 2). MYChigh TP53/p53+ aberrations remained prognostic, for both OS and PFS, when adjusting for additional high-risk factors (Table 5). Of note, prognostic analysis considering only TP53 mutation and MYChigh tumors remained significant for both OS and PFS (Online Supplementary Figure S9).
MYC protein expression is not correlated with genomic aberrations
To explore the hypothesis that MYC protein overexpression can be associated with genomic rearrangements of MYC, a total of 85 cases mounted in tissue microarrays were evaluated by FISH with a MYC break-a-part probe. Of those 85 patients, 70 (82%) showed no signs of genomic alterations of MYC. Among the remaining 15 cases, three showed copy gains in less than 20% of the evaluated cells, 11 showed copy gains in more than 20% of the evaluated cells and one case showed the presence of a translocation (Online Supplementary Figure S10).
To validate the FISH findings, whole tissue sections were used. Diagnostic tissue blocks from 14 out of the 15 patients were available for further evaluation (Online Supplementary Table S7). Results were consistent between tissue microarrays and full tissue sections. No correlation between copy number gains of MYC and protein overexpression was observed, as most of tumors with MYC copy number gains had a low frequency of cells expressing MYC protein (Online Supplementary Table S7). The presence of copy number gains was not associated with outcome (data not shown). The single MYC-translocated MCL case had an OS of over 6 years, no other high-risk factors but a classic morphology, low Ki-67 expression, and was TP53/p53 wild-type.
Table 2.
Univariable Cox proportional hazards models results.
Table 3.
MYC protein multivariable Cox proportional hazards models.
Table 4.
Differences in clinicopathological characteristics with a focus on established high-risk factors comparing MYChigh tumors with MYClow tumors and comparing MYChighTP53/p53+ tumors to all others.
In line with the lack of genomic alterations, MYC showed genetic mutations in only one patient, determined by targeted sequencing of part of the SLR cohort as previously published.29 This MYC mutated case only had 4% of cells expressing MYC protein.
MYChigh tumors showed an increase in M2-like macrophage infiltration
In a recent study, we showed that the frequencies of T cells and M2 macrophages are prognostic in MCL30 and hypothesized that the composition of the microenvironment would be different in MYChigh and MYClow cases. T-cell and M2 macrophage frequencies were determined based on multiplexed immunofluorescence staining using machine learning (Aiforia software). The multiplexed immunofluorescence staining included stains for CD3, CD163 and CD20. For a total of 117 patients, information was available for both multiplexed immunofluorescence and MYC status. T-cell infiltration, marked as CD3 positivity, ranged from 1.48% to 52.58% of total cells. The presence of CD163+ cells, as a surrogate marker for M2 macrophages, varied between 0.02% and 23.09% of total cells. The abundance of T cells and M2-like macrophages and the density of tumor cells in the tumor regions in MYChigh and MYClow cases were compared to assess the association with MYC status. MYChigh cases had a higher infiltration of CD163+ macrophages, whereas no difference was seen for T-cell infiltration or density of tumor cells (Online Supplementary Figure S11).
Discussion
The impact of MYC deregulation on outcome in MCL is consistently reported in the literature,10,22,23 but most studies include limited or selected cohorts. The present study of 252 MCL patients is, to the best of our knowledge, the largest study so far to evaluate clinical impact by exploring MYC protein expression and its association with clinicopathological features including established risk factors. The study is focused on the impact of MYC protein, and the association with gene amplifications, and rearrangements, and transcriptional activity.
Figure 2.
High-risk mantle cell lymphoma is enriched for MYChigh tumors. (A) Heatmap representing the distribution of patients with high and low MYC protein expression, TP53 mutation/p53 expression, morphology variant, proliferation (Ki-67) and age at diagnosis. (B) Association between age at diagnosis and MYChigh tumors. (C) Association between total percentage of MYC-positive cells and TP53/p53 status. Wilcoxon and t-test P values were used to evaluate statistical significance, and P values are shown. WT: wild-type; MIPI: Mantle cell lymphoma International Prognostic Index.
Figure 3.
Patients with MYChighTP53/p53+ form a subgroup with adverse prognosis. (A) Prognostic impact of MYChighTP53/p53+ versus all other states on overall survival. (B) Prognostic impact on overall survival for patients with tumors that were classified only as MYChigh, only TP53/p53+, both MYChighTP53/p53+ or wild-type for both markers. (C) Prognostic impact of MYChighTP53/p53+ versus all other patients on progression-free survival. (D) Prognostic impact on progression-free survival for patients with tumors that were classified only as MYChigh, only TP53/p53+, both MYChighTP53/p53+ or wild-type for both markers. Kaplan-Meier estimates were calculated and are shown. Log-rank statistics were used to evaluate the statistical significance of differences. WT: wild-type; PFS: progression-free survival.
Table 5.
MYChigh TP53/p53+ multivariable Cox proportional hazards models.
Current literature on MYC in MCL has not reached a consensus on a cutoff for the definition of MYChigh.10,25,31,32 Previous studies used 10%, 20% or 26%,10,11,24 which hampers direct comparison of the impact of dichotomized groups. We applied a 20% cutoff based on the findings of a previous study on 65 MCL patients by Choe et al.24 To validate the applicability of the applied cutoff in our cohort, we further used Max Rank statistics that identified 21% as the cutoff maximizing the difference in OS in the present cohort.
Most MCL patients had tumors with a low frequency of MYC-positive cells, but 14% (n=35) of the tumors had >20% positive cells and were defined as MYChigh. The patients with MYChigh tumors had a median OS of 2.2 years and PFS of 1.8 years. These were significantly shorter than the OS of 7.3 years and the PFS of 5.2 years for patients with MYClow tumors. The impact on outcome is similar to that previously reported by Oberley et al.10 Both elevated mRNA and protein MYC levels were associated with poor prognosis. Of interest, MYC levels violated the proportional hazards assumption, indicating that the prognostic effect of MYC protein is time-dependent, with a mainly negative impact in the first 3 years after diagnosis. To understand whether there were other high-risk features that separated MYChigh patients with OS shorter or longer than 3 years, the clinicopathological characteristics were compared and confirmed that additional high-risk factors such as being in a high-risk MIPI group, having TP53/p53 aberrations and high proliferation were more common in MYChigh patients with an OS shorter than 3 years. Of note, women with MYChigh tumors seemed to do even more poorly than men, with only one out of nine women having an OS longer than 3 years. Although numbers are small, this indicates that there might be a sex-related difference in the adverse effects mediated by MYC.
Comparison of MYChigh and MYClow tumors with clinicopathological parameters showed that there is a positive correlation between high age and MYC overexpression in MCL. This has not been reported before. In the study by Aukema et al.26 most patients with high MYC expression were older than 65 years, although this was not specifically mentioned. High expression of MYC is also associated with older age in patients with anaplastic lymphoma kinase-positive large cell lymphomas33 and diffuse large B-cell lymphoma.34
Besides age, patients with MYChigh tumors were also enriched for other high-risk features such as high-risk MIPI group, non-classic morphology, and high proliferation. However, the negative impact of MYC on outcome was independent of these high-risk factors, with the exception of MIPI group, emphasizing the additive effect between molecular factors, which was explored further. The impact of TP53 mutations and/or p53 overexpression in MCL has been widely documented by us and others35,36 and assessment of TP53 status should be performed in routine clinical diagnostics.16 Wild-type p53-mediated apoptosis can be induced by MYC,37 and as MYC overexpression in cancer is believed to lead to deregulation of its physiological targets,38 altered TP53/p53 could synergize with MYC and lead to a more aggressive variant of the disease. Here we show that simultaneous alterations in MYC and TP53/p53 (MYChighTP53/p53+) did indeed have an additive negative prognostic effect compared to either of the aberrations alone, being associated with a median OS and PFS of only 0.9 and 0.5 years, respectively. The MYChighTP53/p53+ subgroup of patients had unfavorable clinical characteristics, with most having highly proliferative tumors, with non-classic morphology and being in a high-risk MIPI group. The presence of tumors with both aberrations had been noted in other studies,23,26,39,40 but this is the first time that an association with prognostic and clinicopathological parameters in MCL is reported. The negative effect of MYC overexpression combined with TP53 mutations, excluding patients with wild-type TP53 but high levels of p53 protein, was also confirmed. The mechanisms behind MYC and TP53/p53 crosstalk remain to be explored, but these aberrations are known to influence each other by involvement of proteins, such as BMI-1, ARF, and microRNA, including microRNA34a.41 Den et al. studied the synergetic effect of MYC and TP53/p53 abnormalities on outcome in patients with diffuse large B-cell lymphoma, similarly to this study on MCL.
In our cohort we identified only one case with MYC rearrangements, but a few cases (1.3% of the 85 evaluated cases) showed copy gains of MYC. These results are in line with prior studies in which MYC rearrangements were rare.10,20,42 When genetic alterations have been observed, they have mainly been amplifications/copy gains rather than chromosomal translocations of MYC.31 A high frequency of MYC abnormalities has been found in only one selected cohort.23 Similarly, concurrent translocations of MYC and CCND1 have been reported only as single cases, except in a selected cohort with overrepresentation of leukemic MCL in which 5% of MCL tumors had these dual aberrations.43 Thus, we can conclude that translocations or other rearrangements involving MYC are rare in MCL at diagnosis, corresponding to less than 2% of all cases in most studies. However, in the present study MYC protein overexpression identified 14% of MCL patients with a poor prognosis and added information on high risk beyond TP53/p53, morphology and proliferation.
In other B-cell lymphomas, such as Burkitt lymphoma and diffuse large B-cell lymphoma, structural alterations involving MYC are a predominant mechanism leading to MYC overexpression.25 In MCL, we found that MYC copy number gains were not correlated with outcome or MYC mRNA or protein overexpression. The expression seems to be driven by transcriptional dysregulation and mRNA and protein expression were highly correlated with similar effects on outcome. Investigations of MYC-driven lymphomagenesis in MCL support this notion, by showing that miRNA, such as miR33b, miR96, and miR503, are pivotal in the regulation of MYC44 and that histone deacetylation is involved in the repression of transcription mediated by MYC.45 In addition, MALT1 has also been proposed as an alternative mechanism for MYC protein stabilization in MCL.46 Studies in other lymphomas show that hotspot mutations in regions that can affect protein stability are selected during lymphomagenesis and are associated with a negative impact on outcome.47 It has also been shown by Nadeau et al. that MYC and TP53 are the only genes whose alterations have an impact on outcome beyond that of the total genomic complexity.48 However, mutations of MYC do not seem to drive relapse in MCL as MYC has been shown to be less mutated in relapsed cases compared to cases at diagnosis.6 In other cancers, MYC has a role in shaping the tumor immune microenvironment, through several mechanisms. Indeed, MYC is capable of immune checkpoint regulation, like PD-L1 and MHC class I and II molecules, and promotes cytokine secretion, leading, as an example, to re-programing M1- to M2-like macrophages.49,50 We hypothesized that MYChigh tumors would have an altered immune microenvironment. Image analyses showed no differences in T-cell infiltration but MYChigh tumors were associated with increased infiltration of CD163+ cells. This suggests that M2 macrophages may contribute to an adverse outcome in such tumors and that MYC is associated with both intrinsic and extrinsic high-risk features.
Previous studies in cancer have shown the potential of MYC inhibition to promote antitumor effects. Nonetheless, due to intrinsically disordered domains and lack of enzymatic sites, MYC has been considered undruggable.51 Several approaches have been proposed to inhibit MYC both directly and indirectly at all its levels of regulation. Recently, the first direct MYC inhibitor, the blocking peptide OMO-103 (Peptomyc), reached clinical phase studies. OMO-103 has been shown to alter the tumor microenvironment, potentiating an antitumor immune response,52 providing hope for future successful clinical use of this agent. MYC has been shown to have a role in ibrutinib resistance.53,54 Thus, also in the ibrutinib era in MCL, we expect that MYC will remain a high-risk marker and that MYC-targeting therapies may play an important role in both the diagnostic and relapsed setting. The current study included 252 MCL patients evaluated at diagnosis; their treatment during the follow-up was not homogenous. As both MYC and p53 aberrations affect a limited group of patients, results need to be validated in independent cohorts of patients, ideally under the same treatment protocol. The analyses are further limited by the fact that no mutational analyses were performed, so no correlation between different mutational sites that may affect protein stability and protein expression could be identified.
In summary, MYC protein is a high-risk marker and, in this study, was overexpressed in a significant subgroup of cases of MCL (14%). Overexpression of MYC (>20% expression) adds prognostic information beyond that of established molecular risk factors, such as TP53/p53, morphology and proliferation, for risk stratification of MCL patients. MCL patients carrying tumors with both MYChigh and TP53/p53 aberrations constitute a subgroup with a dismal prognosis, indicating additive negative effects. Previous efforts at risk stratification have included the presence of upregulation of MYC at the bulk mRNA level together with other markers in a five-gene signature that predicts survival in MCL.55 However, we propose that MYC may be assessed through routine immunohistochemistry, using a cutoff at 20% to separate high from low expression, together with routine assessment of TP53/p53 status, proliferation and MIPI group.
Supplementary Material
Acknowledgments
The authors would like to thank the Nordic Lymphoma Group, and specifically the Nordic MCL network, the Department of Laboratory Medicine, Medical Service in Skåne, FoU-department at the Pathology Department, Uppsala University Hospital and Histohub, Division of Oncology, Department of Clinical Sciences, Lund University for assisting in the immunohistochemistry and tissue cuts.
Funding Statement
Funding: This project has received funding from the European Union’s Horizon 2020 research and innovation programme under Marie Skłodowska-Curie grant agreement N 754299, Cancerfonden (2016/465, 19 0309Pj and 21 1561 Pj), Mats Paulssons Stiftelse för forskning, innovation och samhällsbyggande, Stiftelsen Stefan Paulssons cancerfond, and CREATE Health. All financial support was granted to SE.
Data-sharing statement
Original data and protocols are available upon request.
References
- 1.Meyer N, Penn LZ. Reflecting on 25 years with MYC. Nat Rev Cancer. 2008;8(12):976-990. [DOI] [PubMed] [Google Scholar]
- 2.Cai Q, Medeiros LJ, Xu X, Young KH. MYC-driven aggressive B-cell lymphomas: biology, entity, differential diagnosis and clinical management. Oncotarget. 2015;6(36):38591-38616. [DOI] [PMC free article] [PubMed] [Google Scholar]
- 3.Filip D, Mraz M. The role of MYC in the transformation and aggressiveness of ‘indolent’ B-cell malignancies. Leuk Lymphoma. 2020;61(3):510-524. [DOI] [PubMed] [Google Scholar]
- 4.Ziepert M, Lazzi S, Santi R, et al. A 70% cut-off for MYC protein expression in diffuse large B cell lymphoma identifies a high-risk group of patients. Haematologica. 2020;105(11):2667-2670. [DOI] [PMC free article] [PubMed] [Google Scholar]
- 5.Riedell PA, Smith SM. Double hit and double expressors in lymphoma: definition and treatment. Cancer. 2018;124(24):4622-4632. [DOI] [PubMed] [Google Scholar]
- 6.Hill HA, Qi X, Jain P, et al. Genetic mutations and features of mantle cell lymphoma: a systematic review and meta-analysis. Blood Adv. 2020;4(13):2927-2938. [DOI] [PMC free article] [PubMed] [Google Scholar]
- 7.Yi S, Yan Y, Jin M, et al. Genomic and transcriptomic profiling reveals distinct molecular subsets associated with outcomes in mantle cell lymphoma. J Clin Invest. 2022;132(3):e153283. [DOI] [PMC free article] [PubMed] [Google Scholar]
- 8.Jain P, Wang ML. Mantle cell lymphoma in 2022 - a comprehensive update on molecular pathogenesis, risk stratification, clinical approach, and current and novel treatments. Am J Hematol. 2022;97(5):638-656. [DOI] [PubMed] [Google Scholar]
- 9.Setoodeh R, Schwartz S, Papenhausen P, et al. Double-hit mantle cell lymphoma with MYC gene rearrangement or amplification: a report of four cases and review of the literature. Int J Clin Exp Pathol. 2013;6(2):155-167. [PMC free article] [PubMed] [Google Scholar]
- 10.Oberley MJ, Rajguru SA, Zhang C, et al. Immunohistochemical evaluation of MYC expression in mantle cell lymphoma. Histopathology. 2013;63(4):499-508. [DOI] [PMC free article] [PubMed] [Google Scholar]
- 11.Chisholm KM, Bangs CD, Bacchi CE, Molina-Kirsch H, Cherry A, Natkunam Y. Expression profiles of MYC protein and MYC gene rearrangement in lymphomas. Am J Surg Pathol. 2015;39(3):294-303. [DOI] [PubMed] [Google Scholar]
- 12.Seok Y, Kim J, Choi JR, et al. CD5-negative blastoid variant mantle cell lymphoma with complex CCND1/IGH and MYC aberrations. Ann Lab Med. 2012;32(1):95-98. [DOI] [PMC free article] [PubMed] [Google Scholar]
- 13.Durot E, Patey M, Luquet I, Gaillard B, Kolb B, Delmer A. An aggressive B-cell lymphoma with rearrangements of MYC and CCND1 genes: a rare subtype of double-hit lymphoma. Leuk Lymphoma. 2013;54(3):649-652. [DOI] [PubMed] [Google Scholar]
- 14.Delas A, Sophie D, Brousset P, Laurent C. Unusual concomitant rearrangements of cyclin D1 and MYC genes in blastoid variant of mantle cell lymphoma: case report and review of literature. Pathol Res Pract. 2013;209(2):115-119. [DOI] [PubMed] [Google Scholar]
- 15.Liu W, Chen X, Fan J, et al. Quadruple-hit pleomorphic mantle cell lymphoma with MYC, BCL2, BCL6, and CCND1 gene rearrangements. Br J Haematol. 2021;195(4):634-637. [DOI] [PubMed] [Google Scholar]
- 16.Silkenstedt E, Linton K, Dreyling M. Mantle cell lymphoma - advances in molecular biology, prognostication and treatment approaches. Br J Haematol. 2021;195(2):162-173. [DOI] [PubMed] [Google Scholar]
- 17.Hoster E, Klapper W, Hermine O, et al. Confirmation of the mantle-cell lymphoma International Prognostic Index in randomized trials of the European Mantle-Cell Lymphoma Network. J Clin Oncol. 2014;32(13):1338-1346. [DOI] [PubMed] [Google Scholar]
- 18.Wallace D, Reagan PM. Novel treatments for mantle cell lymphoma: from targeted therapies to CAR T cells. Drugs. 2021;81(6):669-684. [DOI] [PubMed] [Google Scholar]
- 19.Kumar A, Sha F, Toure A, et al. Patterns of survival in patients with recurrent mantle cell lymphoma in the modern era: progressive shortening in response duration and survival after each relapse. Blood Cancer J. 2019;9(6):50. [DOI] [PMC free article] [PubMed] [Google Scholar]
- 20.Hu Z, Medeiros LJ, Chen Z, et al. Mantle cell lymphoma with MYC rearrangement: a report of 17 patients. Am J Surg Pathol. 2017;41(2):216-224. [DOI] [PubMed] [Google Scholar]
- 21.Hernandez L, Hernandez S, Bea S, et al. c-myc mRNA expression and genomic alterations in mantle cell lymphomas and other nodal non-Hodgkin’s lymphomas. Leukemia. 1999;13(12):2087-2093. [DOI] [PubMed] [Google Scholar]
- 22.Wang L, Tang G, Medeiros JL, et al. MYC rearrangement but not extra MYC copies is an independent prognostic factor in patients with mantle cell lymphoma. Haematologica. 2021;106(5):1381-1389. [DOI] [PMC free article] [PubMed] [Google Scholar]
- 23.Yi S, Zou D, Li C, et al. High incidence of MYC and BCL2 abnormalities in mantle cell lymphoma, although only MYC abnormality predicts poor survival. Oncotarget. 2015;6(39):42362-42371. [DOI] [PMC free article] [PubMed] [Google Scholar]
- 24.Choe JY, Yun JY, Na HY, et al. MYC overexpression correlates with MYC amplification or translocation, and is associated with poor prognosis in mantle cell lymphoma. Histopathology. 2016;68(3):442-449. [DOI] [PubMed] [Google Scholar]
- 25.Nguyen L, Papenhausen P, Shao H. The role of c-MYC in B-cell lymphomas: diagnostic and molecular aspects. Genes (Basel). 2017;8(4):116. [DOI] [PMC free article] [PubMed] [Google Scholar]
- 26.Aukema SM, Croci GA, Bens S, et al. Mantle cell lymphomas with concomitant MYC and CCND1 breakpoints are recurrently TdT positive and frequently show high-grade pathological and genetic features. Virchows Arch. 2021;479(1):133-145. [DOI] [PubMed] [Google Scholar]
- 27.Deng M, Xu-Monette ZY, Pham LV, et al. Aggressive B-cell lymphoma with MYC/TP53 dual alterations displays distinct clinicopathobiological features and response to novel targeted agents. Mol Cancer Res. 2021;19(2):249-260. [DOI] [PMC free article] [PubMed] [Google Scholar]
- 28.Hothorn T, Zeileis A. Generalized maximally selected statistics. Biometrics. 2008;64(4):1263-1269. [DOI] [PubMed] [Google Scholar]
- 29.Rodrigues JM, Porwit A, Hassan M, Ek S, Jerkeman M. Targeted genomic investigations in a population-based cohort of mantle cell lymphoma reveal novel clinically relevant targets. Leuk Lymphoma. 2021;62(11):2637-2647. [DOI] [PubMed] [Google Scholar]
- 30.Rodrigues JM, Nikkarinen A, Hollander P, et al. Infiltration of CD163-, PD-L1- and FoxP3-positive cells adversely affects outcome in patients with mantle cell lymphoma independent of established risk factors. Br J Haematol. 2021;193(3):520-531. [DOI] [PubMed] [Google Scholar]
- 31.Sander B, Wallblom A, Ekroth A, Porwit A, Kimby E. Characterization of genetic changes in MCL by interphase FISH on tissue sections. Leuk Lymphoma. 2007;48(7):1344-1352. [DOI] [PubMed] [Google Scholar]
- 32.Gong Y, Zhang X, Chen R, Wei Y, Zou Z, Chen X. Cytoplasmic expression of C-MYC protein is associated with risk stratification of mantle cell lymphoma. PeerJ. 2017;5:e3457. [DOI] [PMC free article] [PubMed] [Google Scholar]
- 33.Lyapichev KA, Tang G, Li S, et al. MYC expression is associated with older age, common morphology, increased MYC copy number, and poorer prognosis in patients with ALK+ anaplastic large cell lymphoma. Hum Pathol. 2021;108:22-31. [DOI] [PubMed] [Google Scholar]
- 34.Paul U, Richter J, Stuhlmann-Laiesz C, et al. Advanced patient age at diagnosis of diffuse large B-cell lymphoma is associated with molecular characteristics including ABC-subtype and high expression of MYC. Leuk Lymphoma. 2018;59(5):1213-1221. [DOI] [PubMed] [Google Scholar]
- 35.Rodrigues JM, Hassan M, Freiburghaus C, et al. p53 is associated with high-risk and pinpoints TP53 missense mutations in mantle cell lymphoma. Br J Haematol. 2020;191(5):796-805. [DOI] [PMC free article] [PubMed] [Google Scholar]
- 36.Ferrero S, Rossi D, Rinaldi A, et al. KMT2D mutations and TP53 disruptions are poor prognostic biomarkers in mantle cell lymphoma receiving high-dose therapy: a FIL study. Haematologica. 2020;105(6):1604-1612. [DOI] [PMC free article] [PubMed] [Google Scholar]
- 37.Hoffman B, Liebermann DA. Apoptotic signaling by c-MYC. Oncogene. 2008;27(50):6462-6472. [DOI] [PubMed] [Google Scholar]
- 38.Sabo A, Kress TR, Pelizzola M, et al. Selective transcriptional regulation by Myc in cellular growth control and lymphomagenesis. Nature. 2014;511(7510):488-492. [DOI] [PMC free article] [PubMed] [Google Scholar]
- 39.Malarikova D, Berkova A, Obr A, et al. Concurrent TP53 and CDKN2A gene aberrations in newly diagnosed mantle cell lymphoma correlate with chemoresistance and call for innovative upfront therapy. Cancers (Basel). 2020;12(8):2120. [DOI] [PMC free article] [PubMed] [Google Scholar]
- 40.Yamashita T, Vollbrecht C, Hirsch B, Kleo K, Anagnostopoulos I, Hummel M. Integrative genomic analysis focused on cell cycle genes for MYC-driven aggressive mature B-cell lymphoma. J Clin Exp Hematop. 2020;60(3):87-96. [DOI] [PMC free article] [PubMed] [Google Scholar]
- 41.Yu L, Yu TT, Young KH. Cross-talk between Myc and p53 in B-cell lymphomas. Chronic Dis Transl Med. 2019;5(3):139-154. [DOI] [PMC free article] [PubMed] [Google Scholar]
- 42.Michaux L, Wlodarska I, Theate I, et al. Coexistence of BCL1/ CCND1 and CMYC aberrations in blastoid mantle cell lymphoma: a rare finding associated with very poor outcome. Ann Hematol. 2004;83(9):578-583. [DOI] [PubMed] [Google Scholar]
- 43.Aukema SM, Siebert R, Schuuring E, et al. Double-hit B-cell lymphomas. Blood. 2011;117(8):2319-2331. [DOI] [PubMed] [Google Scholar]
- 44.Karkhanis V, Alinari L, Ozer HG, et al. Protein arginine methyltransferase 5 represses tumor suppressor miRNAs that down-regulate CYCLIN D1 and c-MYC expression in aggressive B-cell lymphoma. J Biol Chem. 2020;295(5):1165-1180. [DOI] [PMC free article] [PubMed] [Google Scholar]
- 45.Zhang X, Zhao X, Fiskus W, et al. Coordinated silencing of MYC-mediated miR-29 by HDAC3 and EZH2 as a therapeutic target of histone modification in aggressive B-Cell lymphomas. Cancer Cell. 2012;22(4):506-523. [DOI] [PMC free article] [PubMed] [Google Scholar] [Retracted]
- 46.Dai B, Grau M, Juilland M, et al. B-cell receptor-driven MALT1 activity regulates MYC signaling in mantle cell lymphoma. Blood. 2017;129(3):333-346. [DOI] [PubMed] [Google Scholar]
- 47.Cucco F, Barrans S, Sha C, et al. Distinct genetic changes reveal evolutionary history and heterogeneous molecular grade of DLBCL with MYC/BCL2 double-hit. Leukemia. 2020;34(5):1329-1341. [DOI] [PMC free article] [PubMed] [Google Scholar]
- 48.Nadeu F, Martin-Garcia D, Clot G, et al. Genomic and epigenomic insights into the origin, pathogenesis, and clinical behavior of mantle cell lymphoma subtypes. Blood. 2020;136(12):1419-1432. [DOI] [PMC free article] [PubMed] [Google Scholar]
- 49.Dhanasekaran R, Baylot V, Kim M, et al. MYC and Twist1 cooperate to drive metastasis by eliciting crosstalk between cancer and innate immunity. Elife. 2020;9:e50731. [DOI] [PMC free article] [PubMed] [Google Scholar]
- 50.Dhanasekaran R, Deutzmann A, Mahauad-Fernandez WD, Hansen AS, Gouw AM, Felsher DW. The MYC oncogene - the grand orchestrator of cancer growth and immune evasion. Nat Rev Clin Oncol. 2022;19(1):23-36. [DOI] [PMC free article] [PubMed] [Google Scholar]
- 51.Dang CV, Reddy EP, Shokat KM, Soucek L. Drugging the ‘undruggable’ cancer targets. Nat Rev Cancer. 2017;17(8):502-508. [DOI] [PMC free article] [PubMed] [Google Scholar]
- 52.Soucek L, Whitfield J, Martins CP, et al. Modelling Myc inhibition as a cancer therapy. Nature. 2008;455(7213):679-683. [DOI] [PMC free article] [PubMed] [Google Scholar]
- 53.Lee J, Zhang LL, Wu W, et al. Activation of MYC, a bona fide client of HSP90, contributes to intrinsic ibrutinib resistance in mantle cell lymphoma. Blood Adv. 2018;2(16):2039-2051. [DOI] [PMC free article] [PubMed] [Google Scholar]
- 54.Scapinello G, Riva M, Branca A, et al. A case of “double hit” mantle cell lymphoma carrying CCND1 and MYC translocations relapsed/refractory to rituximab bendamustine cytarabine (R-BAC) and ibrutinib. Ann Hematol. 2020;99(11):2715-2717. [DOI] [PubMed] [Google Scholar]
- 55.Hartmann E, Fernandez V, Moreno V, et al. Five-gene model to predict survival in mantle-cell lymphoma using frozen or formalin-fixed, paraffin-embedded tissue. J Clin Oncol. 2008;26(30):4966-4972. [DOI] [PubMed] [Google Scholar]
Associated Data
This section collects any data citations, data availability statements, or supplementary materials included in this article.
Supplementary Materials
Data Availability Statement
Original data and protocols are available upon request.


