

Abstract
The chemosensor literature contains many reports of fluorescence sensing using polyaromatic hydrocarbon fluorophores such as pyrene, tetraphenylethylene, or polyaryl(ethynylene), where the fluorophore is excited with ultraviolet light (<400 nm) and emits in the visible region of 400–500 nm. There is a need for general methods that convert these “turn-on” hydrocarbon fluorescent sensors into ratiometric sensing paradigms. One simple strategy is to mix the responsive hydrocarbon sensor with a second non-responsive dye that is excited by ultraviolet light but emits at a distinctly longer wavelength and thus acts as a reference signal. Five new cyanine dye cassettes were created by covalently attaching a pyrene, tetraphenylethylene, or biphenyl(ethynylene) component as ultraviolet-absorbing energy donor directly to the pentamethine chain of a deep-red cyanine (Cy5) energy acceptor. Fluorescence emission studies showed that these Cy5-cassettes exhibited large pseudo-Stokes shifts and high through bond energy transfer efficiencies upon excitation with ultraviolet light. Practical potential was demonstrated with two examples of ratiometric fluorescence sensing using a single ultraviolet excitation wavelength. One example mixed a Cy5-cassette with a pyrene-based fluorescent indicator that responded to changes in Cu2+ concentration, and the other example mixed a Cy5-cassette with the fluorescent pH sensing dye, pyranine.
Graphical Abstract

INTRODUCTION
The last two decades has seen major and ongoing development of intensiometric fluorescent sensors that respond to the presence of specific analytes with ‘turn on” fluorescence.1 2 3 Many of the classic examples of fluorescence sensing involve polyaromatic hydrocarbon fluorophores such as pyrene,4 5 6 tetraphenylethylene (TPE),7 8 and polyaryl(ethynylene),9 10 and in each case the fluorophore is excited with ultraviolet light (<400 nm), with subsequent emission in the visible region of 400–500 nm. It is well established that many quantitative sensing procedures are more reliable if they monitor a change in the ratio of two emission signals (ratiometric sensing),11 12 and thus there is a need for general methods that convert the classic “turn-on” hydrocarbon fluorescent sensors into ratiometric sensing paradigms. One simple strategy is to mix the responsive hydrocarbon sensor with a second non-responsive dye that emits at a distinctly longer wavelength and thus it acts as a reference signal (Scheme 1a).13,14 In addition, it is often a technical advantage if the two fluorescent signals for this dye mixture can be produced by exciting the sample at a single wavelength (Scheme 1b).15 This requires the second non-responsive, long wavelength dye to be excited with ultraviolet light which means the dye must exhibit a reasonably intense ultraviolet absorption band and also a very large Stokes shift16 17 18 (or pseudo-Stokes shift19 20) which is a very unusual combination.
Scheme 1.

Schematic illustration of (a) intensiometric (turn on) fluorescence sensing using a sample containing a responsive aromatic hydrocarbon fluorescent sensor (e.g., pyrene, TPE or biphenyl(ethynylene)), and (b) how ratiometric sensing is generated by including a non-responsive, deep-red Cy5-cassette dye in the same sample. (c) Chemical structures of Cy5-cassettes 1P, 1T, 1B, 2P, and 2T, along with control Cy5 dyes 1H and 2H.
One way to produce a fluorescent dye with a large pseudo-Stokes shift is to design a fluorescent dye cassette, that is, a two-component molecule that has a short wavelength excitation component (energy donor) covalently attached to a long wavelength emission component (energy acceptor). After excitation of the donor, there is intramolecular energy transfer to the emissive acceptor. The mechanism for energy transfer can be through space (Förster resonance energy transfer, FRET)21,22 or through bonds (through bond energy transfer, TBET). Unlike FRET, the TBET process does not require donor/acceptor spectral overlap, but efficient TBET dye cassettes must be a conjugated in way that connects the π-electrons of the donor and acceptor components.23–25
The deep-red, pentamethine cyanine (Cy5) dye with fluorescence emission in the wavelength range 660–720 nm matches a common filter setting on many fluorescence detectors and cameras, and therefore is a good choice as the energy acceptor in a dye cassette. But examples of TBET using cyanine cassette dyes are rare, and the very few examples have attached the donor component to the terminal heterocycles of the cyanine acceptor.19 20 26 27 Here we describe a different molecular design strategy that attaches the polyaromatic hydrocarbon donor directly to the center of a Cy5 pentamethine chain. Specifically, we report three new classes of cyanine TBET cassettes, the pyrene-Cy5 analogues 1P and 2P, the TPE-Cy5 analogues 1T and 2T, and the biphenyl(ethynylene)-Cy5 1B (Scheme 1c). We provide evidence for efficient TBET, and demonstrate potential utility with two examples of ratiometric fluorescence sensing using a method that employs a single excitation wavelength.
RESULTS AND DISCUSSION
Fluorophore Synthesis
The Cy5-cassettes (1P, 1T, 2P, and 2T) were prepared by conducting palladium mediated Suzuki coupling reactions that attached each polyaromatic donor chromophore to the central 3’ position of a cyanine pentamethine dye,28 while 1B was prepared by conducting palladium mediated Sonogashira coupling reaction (Scheme 2). The control Cy5 dyes 1H and 2H were commercially available.
Scheme 2.
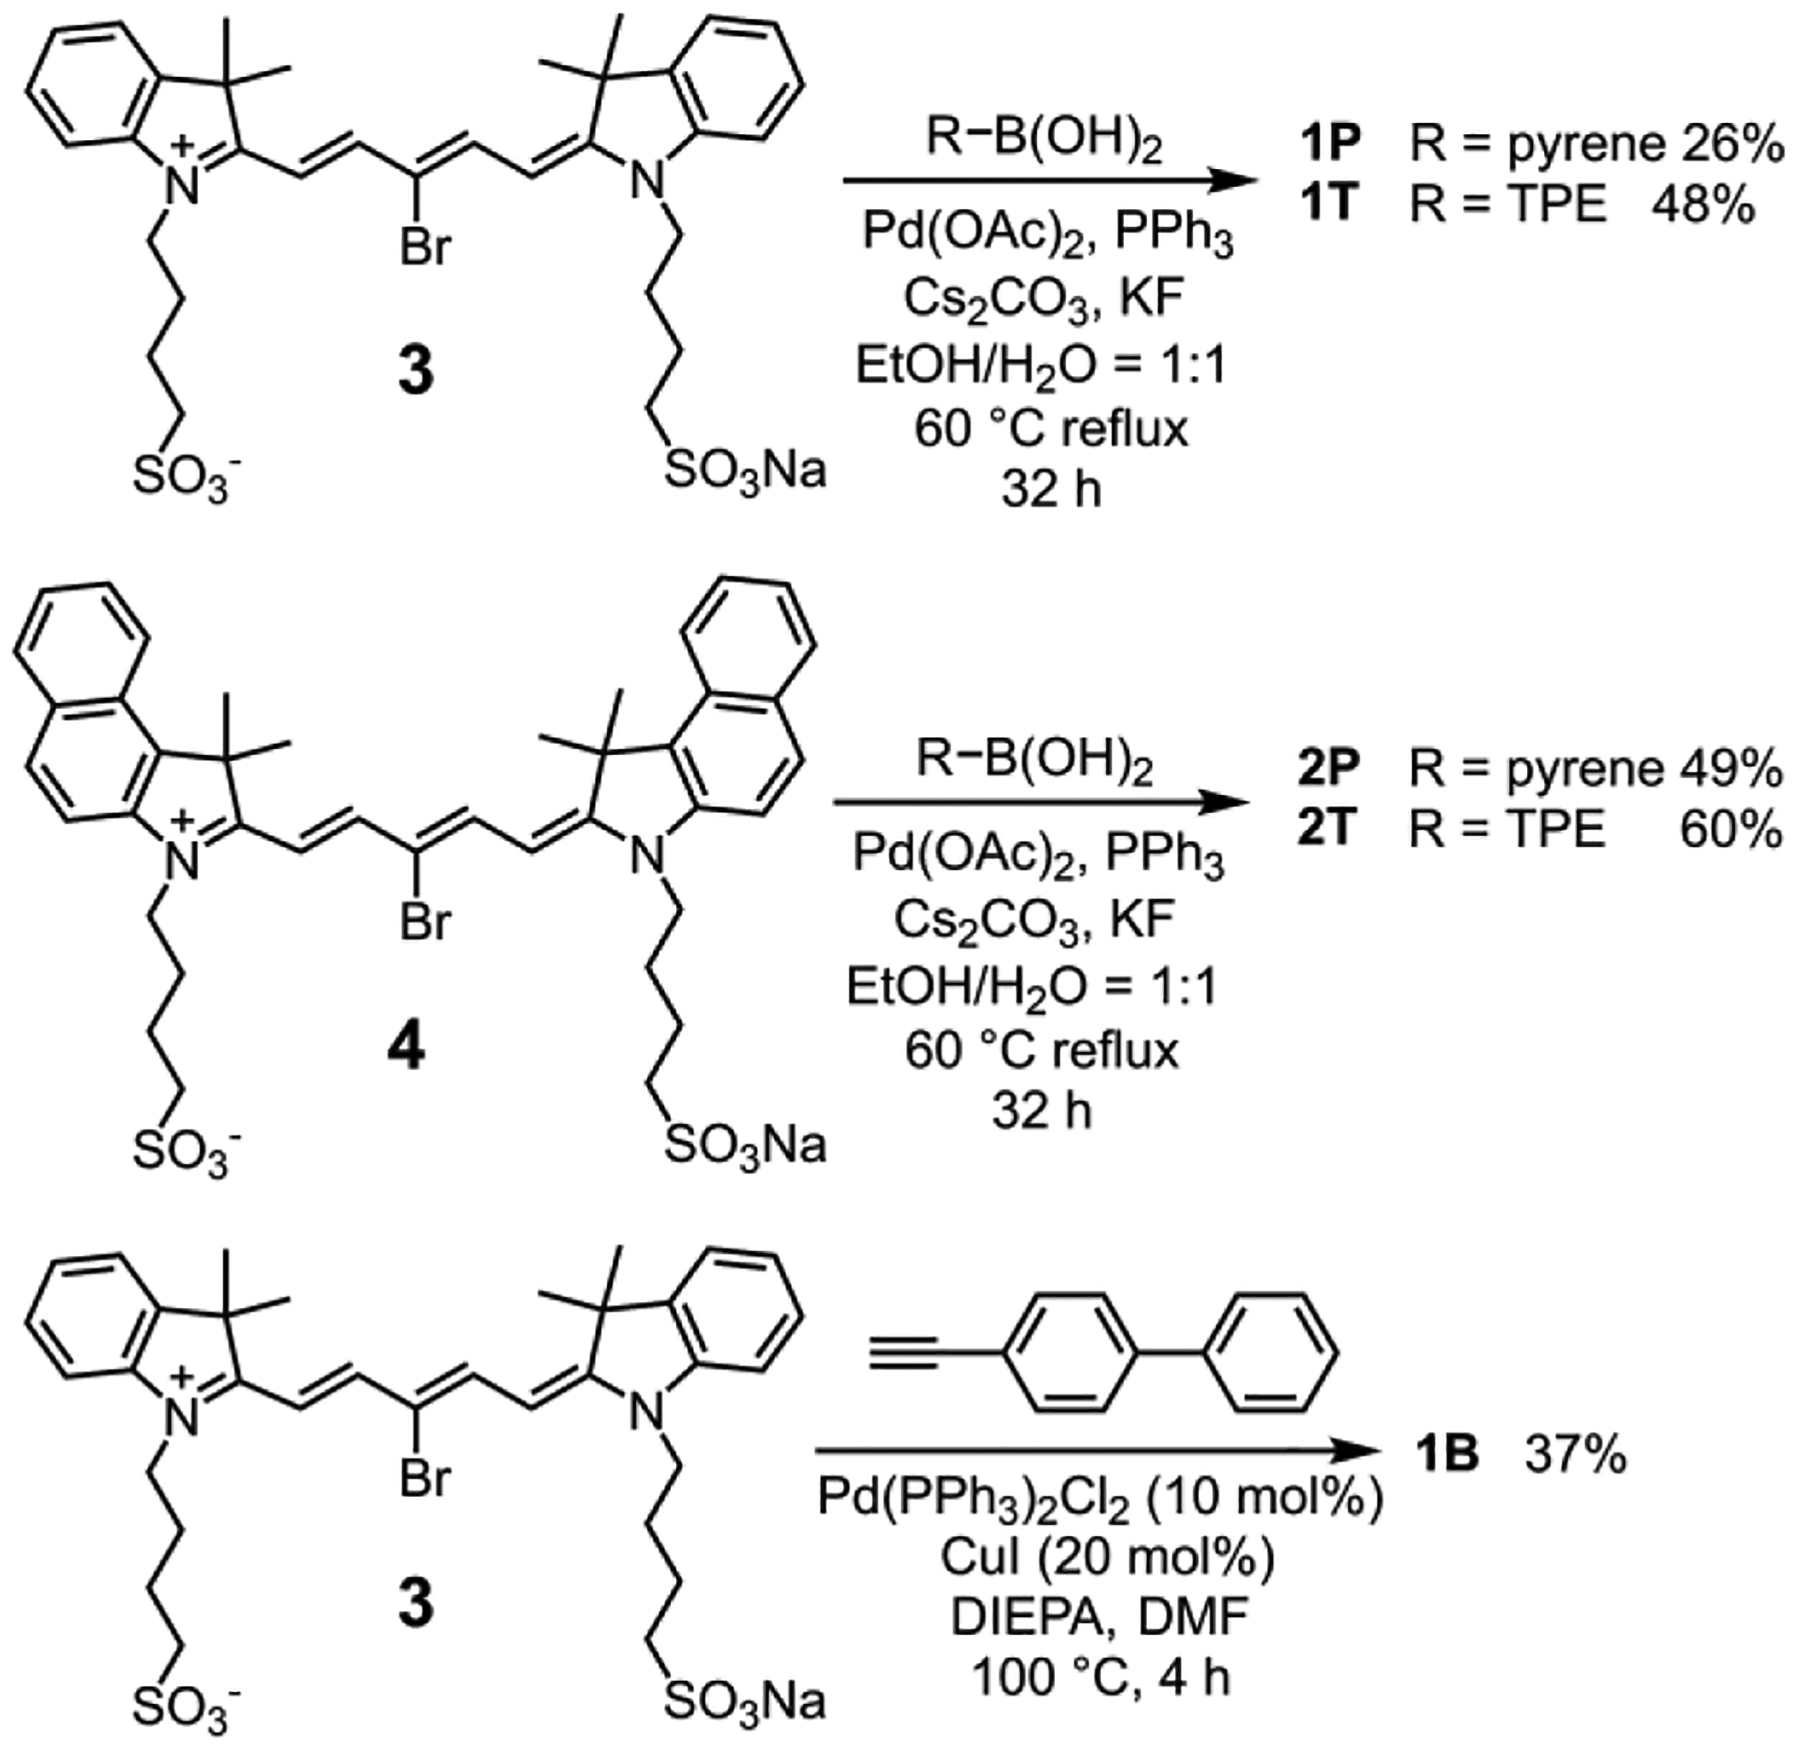
Synthesis of Cy5 cassettes 1P, 2P, 1T, 2T, and 1B.
Spectral Studies in Methanol
Initial spectral studies focused on the pyrene and TPE Cy5-cassettes (1P, 1T, 2P, and 2T) and control Cy5 dyes 1H and 2H in methanol, where the compounds are readily soluble, chemically stable, and there is no self-aggregation (see Table 1 for a list of spectral data). The absorption spectra exhibit an intense deep-red absorption band corresponding the Cy5 component and a weak ultraviolet absorption band corresponding to the indole or benzoindole units at the ends of the pentamethine chain, and also the appended pyrene or TPE components on the Cy5-cassettes (Figure 1).
Table 1.
Spectra data in methanol at room temperature
| Cy5-Cassette | Absorption | Emission | ||||||
|---|---|---|---|---|---|---|---|---|
| [nm][a] | [nm][b] | ε [M−1cm−1] | [nm][c] | ΦF [%][d] | ETE [%][e] | FEF[f] | Δλ [nm][g] | |
| 1P | 342 | 645 | 159 000 | 664 | 20.3±0.9 | 97 | 9.0 | 322 |
| 2P | 374 | 682 | 188 000 | 703 | 20.0±0.7 | 84 | 1.6 | 329 |
| 1T | 339 | 647 | 142 000 | 668 | 18.4±0.4 | 93 | 4.6 | 329 |
| 2T | 373 | 684 | 173 000 | 707 | 23.8±0.5 | 78 | 1.5 | 334 |
| 1B | 417 | 652 | 149 000 | 673 | 27.2±0.9 | -[h] | 21.6 | 256 |
Absorption maxima of donor.
Absorption maxima of acceptor.
Emission maxima of acceptor.
Absolute fluorescence quantum yield of the Cy5 component measured directly by photon counting.
Energy transfer efficiency = [1-(IDA/ID)]x100. IDA is the integrated emission of the donor; ID is the integrated emission of the donor as free molecule.29
Fluorescence enhancement factor.
Pseudo-Stokes shift of Cy5-cassette.
ETE of 1B cannot be obtained by this method.
Figure 1.

Absorption spectra of each dye (4 μM) in methanol.
Clear evidence of TBET was gained by comparing separate methanol solutions of 1P, 1H, or pyrene (Figure 2a); 2P, 2H, or pyrene (Figure 2b); 1T, 2H, or TPE (Figure 2c); 2T, 2H, or TPE (Figure 2d). As expected, ultraviolet excitation of free pyrene or TPE did not produce any deep-red fluorescence. In the case of control Cy5 dyes 1H and 2H, ultraviolet excitation produced moderate deep-red emission, presumably due to excitation of the indole or benzoindole units at the ends of the pentamethine chains. A comparison of the dyes with indole termini, that is 1P or 1T with 1H (Figures 2a,c) produced a fluorescence enhancement factor (FEF) of 9.0 and 4.6, respectively. A similar comparison of the dyes with benzoindole termini, that is 2P or 2T with 2H (Figures 2b,d) produced a FEF of 1.6 and 1.5, respectively. These smaller FEF values reflect increased TBET to the Cy5 acceptor from the terminal benzoindole units. The energy transfer efficiency (ETE) for each Cy5 cassette was quantified by measuring the integrated fluorescence emission of the donor component as a free molecule (i.e., free pyrene or TPE) and when the donor was part of a Cy5-cassette (i.e., 1P, 1T, 2P, or 2T). In all cases the ETE values in methanol were very high (Table 1).
Figure 2.

Evidence for TBET. Emission spectra of (a) 1P, 1H, and pyrene (λex = 350 nm), (b) 2P, 2H, and pyrene (λex = 370 nm), (c) 1T, 1H, and TPE (λex = 350 nm), and (d) 2T, 2H, and TPE (λex = 370 nm). Each dye is 4 μM in methanol.
A manifestation of the strong absorption of Cy5 dyes is the appearance of fluorescence inner filter effects even at relatively low, micromolar dye concentrations.30 31 However, the dual excitation of Cy5 cassettes provides a way to mitigate the inner effect. As shown in Figure 3, the absorption spectra for 1T and 2T in methanol exhibit linear Beer-Lambert relationships for concentration up to 10 μM, but the emission spectra with 630 nm excitation exhibit classic inner filter effects. That is, the Cy5 fluorescence intensity is a maximum at 4 μM and decreases with higher concentration (attenuation of the excitation beam due to the primary inner filter effect) along with a noticeable red-shift in the peak maxima wavelength (reabsorption of the deep-red emission due secondary inner filter effect). However, these inner filter effects are avoided when the Cy5 emission spectra for 1T or 2T are generated with 350 nm where there is much less absorption of the ultraviolet excitation light by other Cy5-cassette molecules in the solution. The same trends were observed with solutions of 1P and 2P in methanol (Figure S1).
Figure 3.

(a) Absorption spectra of 1T (Insert: Beer-Lambert plot of absorption over 1–10 μM) in MeOH. Emission spectra of 1T in MeOH: (b) λex = 630 nm, and (c) λex = 350 nm. (d) Absorption spectra of 2T (Insert: Beer-Lambert plot of absorption over 1–10 μM) in MeOH. Emission spectra of 2T in MeOH: (e) λex = 660 nm, and (f) λex = 370 nm.
Spectral Studies in Aqueous Solution
Deep-red cyanine dyes are known to self-aggregate in aqueous solution and form non-fluorescent aggregates. On the other hand, pyrene dyes can form excimers in self-aggregation conditions,4 5 6 32–36 and TPE is also well-known for aggregation induced enhancement (AIE).7 8 To probe the change in fluorescent properties upon dye cassette self-aggregation, we acquired absorption (Figure 4a–d) and emission (Figure S2–S5) spectra for each dye in water/methanol mixtures. In the case of the relatively hydrophobic dyes, 1P or 1T, the transition from 100% methanol to 99.5% water induced minor spectral changes indicating little formation of dye self-aggregates. But with the more hydrophobic dyes, 2P or 2T, the transition from 100% methanol to 99.5% water induced large changes in the Cy5 absorption profiles, namely, conversion of an emissive Cy5 monomer absorption band at ~680 nm to a self-quenched H-aggregate band at ~620 or ~570 nm (Figure S6–S7). The photographs of illuminated vials in Figure 4e visually illustrate the contrast in AIE exhibited by TPE, where fluorescence is enhanced when there is ≤50% methanol, to the aggregation-caused-quenching (ACQ) exhibited by 2T where fluorescence is decreased when there is ≤30% methanol. Additional studies that compared absorption and emission spectra for the Cy5-cassettes in water and PBS solution consistently observed increased self-aggregation and loss of fluorescence in PBS solution (Figure S8). It is notable that these Cy5-cassettes exhibit ACQ and not AIE. The lack of AIE for self-aggregated 1T and 2T, each with an appended TPE component, is rare but matches the findings of other literature studies.37 38 39 In these cases, we assume there is energy transfer from the excited state TPE component to the appended Cy5 component which is non-emissive due to its intrinsic ACQ property.
Figure 4.

Absorption spectra for (a) 1P, (b) 2P, (c) 1T, and (d) 2T in binary solvent mixtures ranging from 100% methanol to 99.5% water. Each dye is 5 μM. (e) Photographs of vials containing 2T or tetraphenylethylene (TPE) in different methanol (MeOH)/water mixtures with illumination by ultraviolet light (365 nm).
Ratiometric Sensing of Copper(II) in Methanol
The propensity of pyrene to form excimers with visible emission is often exploited for fluorescence sensing.4 5 6 For example, the pyrene-based probe L is known to form an excimer complex (L2•Cu2+) in the presence of Cu2+ with “turn-on” fluorescence at 430 nm (Figure 5a).32 By simply mixing “responsive” probe L with non-responsive cassette 2P, we achieved ratiometric sensing of Cu2+ with a single excitation wavelength of 380 nm. Shown in Figure 5b are emission spectra for a binary mixture of 2P and L in methanol treated with different concentrations of Cu2+. The fluorescence intensity ratio (F430/F710) increased over 24 hours by nearly 3.5-fold upon addition of the Cu2+ (Figure 5c). The 24-hour time period needed for the ratiometric signal to reach equilibrium is a technical drawback for some applications but not all, such as automated environmental testing protocols that can easily accommodate an overnight waiting period. This simple result is proof of concept that ratiometric fluorescence sensing with a single excitation wavelength is achieved when the non-responsive cassette 2P is mixed with a responsive aromatic hydrocarbon fluorescent sensor.
Figure 5.

(a) Responsive probe L forms an excimer complex with Cu2+ that “turns-on” fluorescence at 430 nm. (b) Emission spectra of non-responsive cassette 2P (10 μM) and responsive probe L (4 μM) mixed with different concentrations of Cu2+ (0−2 μM). The 1 mM of Cu2+ stock solution was prepared by dissolving CuSO4·5H2O in methanol at room temperature. Emission spectra was acquired 24 h after sample preparation to ensure the sample is at equilibrim. λex = 380 nm. (c) Plot of fluorescence intensity ratio (F430/F710) versus [Cu2+]. Error bars represent standard deviation for triplicate experiments.
Ratiometric Sensing of Aqueous pH
To better demonstrate the scope and impact of these Cy5 cassettes we decided to create a ratiometric sensing system for measuring pH in a completely aqueous solution. Fluorescent pH sensors are broadly useful in many technology sectors such as food production, environmental science, and clinical diagnostics, in part because many biochemical assays are designed to produce a change in pH as an observable signal for assay read out.40 41 42 To ensure proper operation in water, we modified the sensing components in two ways. First, we decided to employ the sulfonated pyrene dye, pyranine (hydroxypyrene-1,3,6-trisulfonic acid) as a pH responsive sensor whose emission intensity at 510 nm (425 nm excitation) increases with pH.43 44 Second, we needed to ensure that the non-responsive, long wavelength reference dye was sufficiently soluble in water and that efficient TBET transfer could be achieved upon excitation with 425 nm light. To meet both criteria, we synthesize the Cy5-cassette 1B with an appended biphenyl(ethynylene) as the donor component and found that it exhibited a very high fluorescence enhancement factor in methanol reflecting efficient TEBT (Table 1, Figure S10). The absorption spectrum of 1B in water indicated some H-aggregation (Figure S9), and so we assessed the capacity of various water-soluble cyclodextrin host compounds to capture 1B as a more emissive monomer. We found that 2-hydroxyisopropyl β-cyclodextrin was quite effective at reducing 1B self-aggregation (Figure S11) and enabling efficient TBET with 425 nm excitation. As shown in Figure 6, the mixture of 1B, 2-hydroxyisopropyl β-cyclodextrin, and pyranine acted as a ratiometric fluorescent pH sensor with a near-linear change in output signal over the pH range of 6–8. Looking to future applications, it should be feasible to incorporate the binary mixture of 1B and pyranine within suitable nanoparticles and create robust nanoscale sensing probes for ratiometric diagnostics and multiplex microscopy using a single excitation wavelength.13,14 45 46
Figure 6.

(a) Pyranine is a pH responsive probe that “turns-on” fluorescence at 510 nm (λex= 425 nm) with increasing pH. (b) Fluorescence spectra of non-responsive cassette 1P (10 μM), pH responsive probe pyranine (1 μM), and 2-hydroxypropyl β-cyclodextrin (800 μM) in citrate buffer at different pH values. λex = 425 nm, λem = 460–900 nm. (c) Plot of fluorescence intensity ratio (F510/F668) versus pH. Error bars represent standard deviation for triplicate experiments.
Conclusions
Five new Cy5-cassettes were created by directly attaching a pyrene, TPE, or biphenyl(ethynylene) component, as an ultraviolet-absorbing energy donor, to the pentamethine chain of a deep-red Cy5 acceptor. The fluorescent Cy5-cassettes exhibited large pseudo-Stokes shifts and high TBET efficiencies upon excitation with ultraviolet light. In predominantly aqueous solutions, the Cy5-cassettes exhibited aggregation-caused-quenching, but in the case of biphenyl(ethynylene) derivative 1B, this was mitigated by supramolecular complexation of the Cy5-cassette. Potential utility was demonstrated with two examples of ratiometric fluorescence sensing using a single excitation wavelength. One example mixed a Cy5-cassette (2P) with a pyrene-based fluorescent probe (L) that responded to changes in Cu2+ concentration, and the other example mixed a Cy5-cassette (1B) with the fluorescent pH sensor pyranine. To the best of our knowledge, these two examples are among the first demonstrations of ratiometric fluorescence sensing based on the TBET principle using a single excitation wavelength.14 15 The enabling chemical advance is the large pseudo-Stokes shifts generated by the Cy5-cassettes. This TBET approach is a more general than other literature ways to excite two dyes with a single wavelength, such as a binary mixture of one and two photon excitation dyes,47 or a mixture that exploits energy upconversion within a nanoparticle.48 In the long term, it should be possible to combine an analyte-responsive pyrene, TPE, or polyaryl(ethynylene) fluorescent indicator with a non-responsive Cy5-cassette within solid matrices or nanoscale assemblies and create a broad platform of ratiometric fluorescent sensors with single wavelength excitation.
Experimental Section
General materials and methods.
Organic reactions were performed under an atmosphere of argon using anhydrous solvents unless otherwise noted. Reagents and solvents including 1H and 2H were purchased from Sigma-Aldrich, VWR, Oakwood, Alfa Aesar, Ambeed, TCI America, Alfa Chemistry, and used without further purification. Column Chromatography was performed using Biotage Sfär C18 Duo columns (part # FSUD-0401). Reverse phase thin layer chromatography (TLC) experiments were performed on C18 TLC plates with F254s indicator (MilliporeSigma, part # 1.15683). 1H NMR spectra and 13C NMR were recorded on a Bruker 500 NMR spectrometer installed with TopSpin™ software. Multiplicities were given as singlet (s), doublet (d), doublet of doublets (dd), triplet (t) or multiplet (m). Spectra were visualized and analyzed using MestReNova™ software (version 14.2). Chemical shifts are presented in ppm and referenced by residual solvent peaks. High-resolution mass spectrometry (HRMS) was performed using a time-of-flight (TOF) analyzer with electrospray ionization (ESI). Absorption spectra were recorded on an Evolution 201 UV/vis spectrometer with Thermo Insight software. Emission spectra were collected on a Horiba Fluoromax-4 fluorometer with FluoroEssence™ software. Analyte solutions were prepared in HPLC grade water (Sigma-Aldrich), HPLC grade methanol (Sigma-Aldrich), or phosphate buffered saline (Thermo Fisher). All absorption and emission spectra were collected using quartz cuvettes at room temperature (1 mL, 1 cm path length; for emission spectra, slit width = 2 nm, unless stated otherwise).
Absolute quantum yields measurement.
Absolute quantum yields of 1B, 1P, 1T, 2P, and 2T were measured on a Horiba FluoromaxPlus spectrometer with an integrating sphere. Samples were excited at 640 nm for 1B, 1P and 1T, and 680 nm for 2T and 2P with optical density ≤ 0.05. First, all the photons were recorded with an integrating sphere after the excitation of a blank solvent reference, then the reference was replaced by a sample solution, and the spectrum (630–800 nm for 1B, 1P and 1T, and 670–800 nm for 2T and 2P) was acquired again. The quantum yield was calculated by the equation below:
where P is the number of photons, F is the fluorescence intensity and E is the intensity at the excitation wavelength. Experiments were conducted in triplicates with the reported absolute quantum yields corresponding to the mean value ± standard deviation.
General procedure for bromo-substituted pentamethine dyes 3 and 4 (Scheme S1).49
A mixture of indolium salt (5 or 6) (2.633 mmol, 2.5 equiv.), N-((1E,2Z)-2-Bromo-3-(phenylamino)allylidene) benzenaminium bromide (1.053 mmol, 1.0 equiv.), sodium acetate (3.159 mmol, 3.0 equiv.), and acetic anhydride (5 mL, cat.) in EtOH (10 mL) was stirred in an oil bath at 70 °C for 16 h under Ar in the dark. The solvent was evaporated from the reaction mixture under reduced pressure and the residue was purified by reverse phase column chromatography (C18, 0–60% methanol in H2O). The products were obtained as blue solids.
Purification by reverse phase column chromatography (C18, 0–60% methanol in H2O) gave 3 (0.74 g, 98%). 1H NMR (500 MHz, DMSO-d6) δ 8.50 (d, J = 13.4 Hz, 2H), 7.67 (d, J = 6.1 Hz, 2H), 7.55 (d, J = 8.2 Hz, 2H), 7.43 (td, J = 7.7, 1.3 Hz, 2H), 7.30 (d, J = 7.4 Hz, 2H), 6.33 (d, J = 13.4 Hz, 1H), 4.18 (t, J = 7.4 Hz, 4H), 2.52–2.47 (m, 4H), 1.89–1.79 (m, 4H), 1.75–1.65 (m, 16H). 13C{1H} NMR (125 MHz, DMSO-d6) δ 174.2, 149.4, 141.9, 141.4, 128.6, 125.5, 122.5, 119.0, 115.8, 112.0, 102.2, 50.8, 49.5, 44.0, 26.7, 26.1, 22.6. HRMS (ESI-TOF) m/z: [M]− Calcd for C33H40BrN2O6S2− 703.1517; Found 703.1508.
Purification by reverse phase column chromatography (C18, 0–60% methanol in H2O) gave 4 (0.65 g, 74%). 1H NMR (500 MHz, DMSO-d6) δ 8.65 (d, J = 13.4 Hz, 2H), 8.26 (d, J = 8.6 Hz, 2H), 8.09 (t, J = 8.9 Hz, 4H), 7.88 (d, J = 9.0 Hz, 2H), 7.70 (t, J = 8.0 Hz, 2H), 7.54 (t, J = 7.6 Hz, 2H), 6.40 (d, J = 13.4 Hz, 2H), 4.31 (t, J = 7.4 Hz, 4H), 2.50–2.46 (m, 4H), 1.98 (s, 12H), 1.94–1.87 (m, 4H), 1.77–1.69 (m, 4H). 13C{1H} NMR (125 MHz, DMSO-d6) δ 175.2, 148.5, 139.6, 133.7, 131.6, 130.4, 130.0, 127.8, 127.4, 125.2, 122.2, 115.9, 112.1, 101.8, 51.2, 50.7, 44.2, 26.4, 26.3, 22.6. HRMS (ESI-TOF) m/z: [M]− Calcd for C41H44BrN2O6S2− 803.1830; Found 803.1812.
General procedure for Cy5-cassettes.28
To a solution of bromo-substituted Cy5 dyes (3 or 4) (0.110 mmol, 1.0 equiv.), commercially available boronic acids (pyren-2-ylboronic acid or (4-(1,2,2-triphenylvinyl)phenyl) boronic acid) (0.220 mmol, 2.0 equiv.), potassium fluoride (0.242 mmol, 2.2 equiv.) and cesium carbonate (0.242 mmol, 2.2 equiv.) in a mixture of EtOH (2 mL) and water (2 mL) under Ar at room temperature, was added palladium acetate (0.011 mmol, 0.1 equiv.) and triphenylphosphine (0.044 mmol, 0.4 equiv.). The reaction mixture was stirred in an oil bath at 60 °C for 16 h in the dark. Then boronic acid (0.033 mmol, 0.3 equiv.), palladium acetate (0.011 mmol, 0.1 equiv.) and triphenylphosphine (0.044 mmol, 0.4 equiv.) were added to the reaction mixture. It was stirred in an oil bath at 60 °C for additional 16 h in the dark. The reaction progress was monitored by reverse phase TLC. The solvent was then evaporated from the reaction mixture under vacuum. The residue was purified by reverse phase column chromatography (C18, 0–80% methanol in H2O). The products were obtained as blue solids.
Purification by reverse phase column chromatography (C18, 0–80% methanol in H2O) gave 1P (24 mg, 26%) m.p. > 150 °C (dec). 1H NMR (500 MHz, DMSO-d6) δ 8.68 (d, J = 14.1 Hz, 2H), 8.45 (d, J = 8.9 Hz, 2H), 8.37–8.31 (m, 4H), 8.24 (d, J = 9.0 Hz, 2H), 8.12 (t, J = 7.7 Hz, 0H), 7.65 (d, J = 7.4 Hz, 2H), 7.38–7.30 (m, 4H), 7.24 (ddd, J = 8.1, 6.4, 2.0 Hz, 2H), 5.89 (d, J = 14.1 Hz, 2H), 3.59 (t, J = 6.9 Hz, 2H), 2.36 (t, J = 7.4 Hz, 2H), 1.82 (s, 12H), 1.65–1.56 (m, 4H), 1.42–1.32 (m, 4H). 13C{1H} NMR (125 MHz, DMSO-d6) δ 173.0, 152.8, 142.0, 141.2, 134.4, 131.3, 130.8, 128.4, 127.7, 127.6, 126.8, 126.3, 125.2, 124.9, 123.7, 123.1, 122.4, 111.4, 101.4, 50.8, 49.1, 43.3, 27.1, 26.0, 22.5. HRMS (ESI-TOF) m/z: [M]− Calcd for C49H49N2O6S2− 825.3038; Found 825.3034.
Purification by reverse phase column chromatography (C18, 0–80% methanol in H2O) gave 1T (52 mg, 48%) m.p. > 150 °C (dec). 1H NMR (500 MHz, DMSO-d6) δ (ppm): 8.43 (d, J = 14.1 Hz, 2H), 7.63 (d, J = 7.4 Hz, 2H), 7.44–7.35 (m, 4H), 7.28–7.07 (m, 17H), 7.07–7.00 (m, 4H), 5.62 (d, J = 14.1 Hz, 2H), 3.77 (t, J = 6.9 Hz, 2H), 2.33 (t, J = 7.3 Hz, 4H), 1.72 (s, 12H), 1.66–1.59 (m, 4H), 1.49–1.41 (m, 4H). 13C{1H} NMR (125 MHz, DMSO-d6) δ 172.7, 152.4, 143.4, 143.2, 143.1, 143.1, 143.0, 142.1, 141.1, 140.8, 140.6, 140.5, 131.5, 130.9, 130.8, 130.7, 130.6, 129.8, 128.5, 128.0, 127.9, 127.8, 127.8, 127.8, 126.8, 126.6, 124.9, 122.5, 111.4, 101.3, 50.8, 49.0, 43.5, 27.9, 27.1, 26.1, 22.6. HRMS (ESI-TOF) m/z: [M]− Calcd for C59H59N2O6S2− 955.3820; Found 955.3818.
Purification by reverse phase column chromatography (C18, 0–80% methanol in H2O) gave 2P (51 mg, 49%) m.p. > 150 °C (dec). 1H NMR (500 MHz, DMSO-d6) δ 8.81 (d, J = 14.3 Hz, 2H), 8.47 (d, J = 9.0 Hz, 2H), 8.40–8.33 (m, 4H), 8.31–8.23 (m, 4H), 8.13 (t, J = 7.7 Hz, 1H), 8.06–7.97 (m, 4H), 7.72–7.64 (m, 4H), 7.51 (t, J = 7.6 Hz, 2H), 5.95 (d, J = 14.1 Hz, 2H), 3.81–3.62 (m, 4H), 2.37 (t, J = 7.3 Hz, 4H), 2.09 (s, 12H), 1.73–1.63 (m, 4H), 1.46–1.36 (m, 4H). 13C{1H} NMR (125 MHz, DMSO-d6) δ 174.0, 151.8, 139.8, 133.2, 131.4, 130.8, 130.3, 129.9, 127.7, 127.7, 127.6, 127.5, 126.8, 126.4, 125.2, 124.8, 123.7, 123.2, 122.1, 111.7, 101.1, 50.9, 50.7, 43.5, 26.8, 26.2, 22.5. HRMS (ESI-TOF) m/z: [M]− Calcd for C57H53N2O6S2− 925.3351; Found 925.3290.
Purification by reverse phase column chromatography (C18, 0–80% methanol in H2O) gave 2T (71 mg, 60%) m.p. > 150 °C (dec).1H NMR (500 MHz, DMSO-d6) δ (ppm): 8.56 (d, J = 14.1 Hz, 2H), 8.25 (d, J = 8.5 Hz, 2H), 8.08–8.03 (m, 4H), 7.77 (d, J = 8.8 Hz, 2H), 7.68 (t, J = 7.6 Hz, 2H), 7.51 (t, J = 7.5 Hz, 2H), 7.28–7.10 (m, 15 H), 7.06 (t, J = 7.6 Hz, 4H), 5.69 (d, J = 14.0 Hz, 2H), 3.91 (d, J = 7.3 Hz, 2H), 2.38 (t, J = 7.3 Hz, 4H), 1.99 (s, 12H), 1.75–1.64 (m, 4H), 1.55–1.45 (m, 4H). 13C{1H} NMR (125 MHz, DMSO-d6) δ 173.6, 151.4, 143.4, 143.1, 143.1, 143.0, 140.8, 140.5, 139.8, 133.1, 131.4, 131.4, 130.9, 130.7, 130.6, 130.3, 129.9, 129.8, 127.9, 127.8, 127.8, 127.6, 126.8, 126.6, 124.8, 122.1, 111.8, 101.0, 50.8, 50.7, 26.7, 26.2, 22.5. HRMS (ESI-TOF) m/z: [M]− Calcd for C67H63N2O6S2− 1055.4133; Found 1055.4161.
Synthesis of 1B.
To a solution of bromo-substituted Cy5 dye 3 (59 mg, 0.081 mmol, 1.0 equiv.), 4-ethynyl-1,1′-biphenyl (43 mg, 0.243 mmol, 3.0 equiv.), and DIPEA (28 μL, 0.162 mmol, 2.0 equiv.) in degassed DMF (4 mL), was added CuI (3.1 mg, 0.016 mmol, 20 mol%), and [Pd(PPh3)2Cl2] (5.7 mg, 0.008 mmol, 10 mol%) at room temperature. The reaction mixture was stirred in an oil bath at 100 °C for 4 h in the dark. After cooling to room temperature, the solvent was evaporated under vacum and the residue purified by reverse phase column chromatography (C18, 0–80% methanol in H2O). The product 1B was obtained as a blue solid (25 mg, 37%) m.p. > 150 °C (dec). 1H NMR (500 MHz, DMSO-d6) δ 8.50 (d, J = 14.0 Hz, 2H), 7.93 (d, J = 8.6 Hz, 2H), 7.78 (d, J = 7.1 Hz, 2H), 7.69 (dd, J = 7.7, 5.3 Hz, 4H), 7.65–7.58 (m, 6H), 7.57 – 7.52 (m, 1H), 7.49 (t, J = 7.7 Hz, 2H), 7.45 (t, J = 7.8 Hz, 2H), 7.40 (t, J = 7.3 Hz, 1H), 7.32 (t, J = 7.4 Hz, 2H), 6.62 (d, J = 14.1 Hz, 2H), 4.23 (t, J = 7.6 Hz, 4H), 2.56 (t, J = 7.4 Hz, 4H), 1.95–1.87 (m, 4H), 1.87–1.79 (m, 4H), 1.74 (s, 12H). 13C{1H} NMR (125 MHz, DMSO-d6) δ 174.0, 153.5, 141.9, 141.4, 140.0, 139.2, 133.1, 132.3, 132.1, 132.0, 131.6, 131.5, 131.4, 129.0, 128.8, 128.7, 128.6, 127.8, 127.5, 126.7, 125.4, 122.5, 121.3, 112.7, 111.9, 102.0, 100.5, 83.7, 50.9, 49.5, 44.3, 26.9, 26.2, 23.0. HRMS (ESI-TOF) m/z: [M]− Calcd for C47H49N2O6S2− 801.3038; Found 801.3043.
Supplementary Material
ACKNOWLEDGMENTS
We are grateful for funding support from the US NIH grants R35GM136212 and T32GM075762.
Footnotes
Complete contact information is available at: https://pubs.acs.org/doi/10.1021
Supporting Information
The Supporting Information is available free of charge at https://pubs.acs.org/doi/10.1021.
Synthesis of literature compounds, copies of NMR and mass spectra for each compound, photophysical data (PDF). FAIR Data is available as Supporting Information for Publication and includes the primary NMR FID files for compounds 1B, 1P, 1T, 2P, 2T, 3, and 4.
The authors declare no competing financial interest.
Data Availability
The data underlying this study are available in the published article and its Supporting Information.
REFERENCES
- (1).Wu D; Sedgwick AC; Gunnlaugsson T; Akkaya EU; Yoon J; James TD Fluorescent Chemosensors: The Past, Present and Future. Chem. Soc. Rev 2017, 46, 7105–7123. [DOI] [PubMed] [Google Scholar]
- (2).Sun W; Guo S; Hu C; Fan J; Peng X Recent Development of Chemosensors Based on Cyanine Platforms. Chem. Rev 2016, 116, 7768–7817. [DOI] [PubMed] [Google Scholar]
- (3).Gao M; Tang BZ Fluorescent Sensors Based on Aggregation-Induced Emission: Recent Advances and Perspectives. ACS Sens. 2017, 2, 1382–1399. [DOI] [PubMed] [Google Scholar]
- (4).Shellaiah M; Sun KW Pyrene-Based AIE Active Materials for Bioimaging and Theranostics Applications. Biosensors 2022, 12, 550. [DOI] [PMC free article] [PubMed] [Google Scholar]
- (5).Manandhar E; Wallace KJ Host-Guest Chemistry of Pyrene-Based Molecular Receptors. Inorganica Chim. Acta 2012, 381, 15–43. [Google Scholar]
- (6).Jun YW; Wilson DL; Kietrys AM; Lotsof ER; Conlon SG; David SS; Kool ET An Excimer Clamp for Measuring Damaged-Base Excision by the DNA Repair Enzyme NTH1. Angew. Chem., Int. Ed 2020, 59, 7450–7455. [DOI] [PMC free article] [PubMed] [Google Scholar]
- (7).Mei J; Hong Y; Lam JWY; Qin A; Tang Y; Tang BZ Aggregation-Induced Emission: The Whole Is More Brilliant than the Parts. Adv. Mater 2014, 26, 5429–5479. [DOI] [PubMed] [Google Scholar]
- (8).Sharath Kumar KS; Girish YR; Ashrafizadeh M; Mirzaei S; Rakesh KP; Hossein Gholami M; Zabolian A; Hushmandi K; Orive G; Kadumudi FB; Dolatshahi-Pirouz A; Thakur VK; Zarrabi A; Makvandi P; Rangappa KS AIE-Featured Tetraphenylethylene Nanoarchitectures in Biomedical Application: Bioimaging, Drug Delivery and Disease Treatment. Coord. Chem. Rev 2021, 447, 214135. [Google Scholar]
- (9).Bhosale RS; Aljabri M; La DD; Bhosale SV; Jones LA; Bhosale SV Tetraphenylethene Derivatives: A Promising Class of AIE Luminogens-Synthesis, Properties, and Applications. In Principles and Applications of Aggregation-Induced Emission; Tang Y, Tang BZ, Eds.; Springer International Publishing: Cham, 2019; pp 223–264. [Google Scholar]
- (10).Krywko-Cendrowska A; Szweda D; Szweda R Well-Defined Conjugated Macromolecules Based on Oligo(Arylene Ethynylene)s in Sensing. Processes 2020, 8, 539. [Google Scholar]
- (11).Lee MH; Kim JS; Sessler JL Small Molecule-Based Ratiometric Fluorescence Probes for Cations, Anions, and Biomolecules. Chem. Soc. Rev 2015, 44, 4185–4191. [DOI] [PMC free article] [PubMed] [Google Scholar]
- (12).Qi Y-L; Li Y-Z; Tan M-J; Yuan F-F; Murthy N; Duan Y-T; Zhu H-L; Yang S-Y Recent Advances in Organic Near-Infrared Ratiometric Small-Molecule Fluorescent Probes. Coord. Chem. Rev 2023, 486, 215130. [Google Scholar]
- (13).Wang XD; Meier RJ; Wolfbeis OS Fluorescent pH-Sensitive Nanoparticles in an Agarose Matrix for Imaging of Bacterial Growth and Metabolism. Angew. Chem., Int. Ed 2013, 52, 406–409. [DOI] [PubMed] [Google Scholar]
- (14).Wang XD; Stolwijk JA; Lang T; Sperber M; Meier RJ; Wegener J; Wolfbeis OS Ultra-Small, Highly Stable, and Sensitive Dual Nanosensors for Imaging Intracellular Oxygen and pH in Cytosol. J. Am. Chem. Soc 2012, 134, 17011–17014. [DOI] [PubMed] [Google Scholar]
- (15).Wu S; Wu S; Yi Z; Zeng F; Wu W; Qiao Y; Zhao X; Cheng X; Tian Y Hydrogel-Based Fluorescent Dual pH and Oxygen Sensors Loaded in 96-Well Plates for High-Throughput Cell Metabolism Studies. Sensors 2018, 18, 564. [DOI] [PMC free article] [PubMed] [Google Scholar]
- (16).Gao MJ; Hua Y; Xu JQ; Zhang LX; Wang S; Kang YF Near-Infrared Fluorescence Probe with a Large Stokes Shift for Selectively Imaging of Hydrogen Peroxide in Living Cells and in vivo. Dye. Pigment 2022, 197, 109930. [Google Scholar]
- (17).Wickramasinghe NI; Corbin B; Kanakarathna DY; Pang Y; Abeywickrama CS; Wijesinghe KJ Bright NIR-Emitting Styryl Pyridinium Dyes with Large Stokes’ Shift for Sensing Applications. Biosensors 2023, 13, 799. [DOI] [PMC free article] [PubMed] [Google Scholar]
- (18).Dhara A; Sadhukhan T; Sheetz EG; Olsson AH; Raghavachari K; Flood AH Zero-Overlap Fluorophores for Fluorescent Studies at Any Concentration. J. Am. Chem. Soc 2020, 142, 12167–12180. [DOI] [PubMed] [Google Scholar]
- (19).Han J; Engler A; Qi J; Tung CH Ultra Pseudo-Stokes Shift near Infrared Dyes Based on Energy Transfer. Tetrahedron Lett. 2013, 54, 502–505. [DOI] [PMC free article] [PubMed] [Google Scholar]
- (20).Fang M; Xia S; Bi J; Wigstrom TP; Valenzano L; Wang J; Mazi W; Tanasova M; Luo FT; Liu H A Cyanine-Based Fluorescent Cassette with Aggregation-Induced Emission for Sensitive Detection of pH Changes in Live Cells. Chem. Commun 2018, 54, 1133–1136. [DOI] [PMC free article] [PubMed] [Google Scholar]
- (21).Gui B; Liu X; Yu G; Zeng W; Mal A; Gong S; Yang C; Wang C Tuning of Förster Resonance Energy Transfer in Metal–Organic Frameworks: Toward Amplified Fluorescence Sensing. CCS Chem. 2021, 3, 2054–2062. [Google Scholar]
- (22).Wang X; Mal A; Gui B; Wang C Tuning Energy Transfer in Metal-Organic Frameworks for Fluorescence Turn-on Sensing of Hg(II) Ions. Chin. J. Chem 2023, 41, 1051–1056. [Google Scholar]
- (23).Chen Y; Zhang W; Cai Y; Kwok RTK; Hu Y; Lam JWY; Gu X; He Z; Zhao Z; Zheng X; Chen B; Gui C; Tang BZ AIEgens for Dark Through-Bond Energy Transfer: Design, Synthesis, Theoretical Study and Application in Ratiometric Hg2+ Sensing. Chem. Sci 2017, 8, 2047–2055. [DOI] [PMC free article] [PubMed] [Google Scholar]
- (24).Wan CW; Burghart A; Chen J; Bergström F; Johansson LB.; Wolford MF; Kim TG; Topp MR; Hochstrasser RM; Burgess K Anthracene - BODIPY Cassettes: Syntheses and Energy Transfer. Chem. Eur. J 2003, 9, 4430–4441. [DOI] [PubMed] [Google Scholar]
- (25).Cao D; Zhu L; Liu Z; Lin W Through Bond Energy Transfer (TBET)-Based Fluorescent Chemosensors. J. Photochem. Photobiol. C: Photochem. Rev 2020, 44, 100371. [Google Scholar]
- (26).Abe M; Nishihara R; Ikeda Y; Nakajima T; Sato M; Iwasawa N; Nishiyama S; Paulmurugan R; Citterio D; Kim SB; Suzuki K Near-Infrared Bioluminescence Imaging with a through-Bond Energy Transfer Cassette. ChemBioChem 2019, 20, 1919–1923. [DOI] [PubMed] [Google Scholar]
- (27).Ueno Y; Jose J; Loudet A; Pérez-Bolívar C; Anzenbacher P; Burgess K Encapsulated Energy-Transfer Cassettes with Extremely Well Resolved Fluorescent Outputs. J. Am. Chem. Soc 2011, 133, 51–55. [DOI] [PMC free article] [PubMed] [Google Scholar]
- (28).Gamsey S; Bernat V; Kutyavin A; Clary JW; Pradhan S Near-IR Luminescent Glucose Sensors. U.S. Patent WO 2020006248, January 2, 2020
- (29).Xue X; Jin S; Li Z; Zhang C; Guo W; Hu L; Wang PC; Zhang J; Liang X Through‐Bond Energy Transfer Cassette with Dual‐Stokes Shifts for Double Checked Cell. Adv. Sci 2017, 4, 1700229. [DOI] [PMC free article] [PubMed] [Google Scholar]
- (30).Kumar Panigrahi S; Kumar Mishra A Inner Filter Effect in Fluorescence Spectroscopy: As a Problem and as a Solution. J. Photochem. Photobiol. C: Photochem. Rev 2019, 41, 100318. [Google Scholar]
- (31).Tucker SA; Amszi VL; Acree WE Primary and Secondary Inner Filtering. Effect of K2Cr2O7 on Fluorescence Emission Intensities of Quinine Sulfate. J. Chem. Educ 1992, 69, A8. [Google Scholar]
- (32).Shellaiah M; Venkatesan P; Thirumalaivasan N; Wu SP; Sun KW Pyrene-Based Fluorescent Probe for “Off-on-Off” Sequential Detection of Cu2+ and CN− with HeLa Cells Imaging. Chemosensors 2023, 11, 1–17. [Google Scholar]
- (33).Kowser Z; Rayhan U; Akther T; Redshaw C; Yamato T A Brief Review on Novel Pyrene Based Fluorometric and Colorimetric Chemosensors for the Detection of Cu2+. Mater. Chem. Front 2021, 5, 2173–2200. [Google Scholar]
- (34).Wilson JN; Cho Y; Tan S; Cuppoletti A; Kool ET Quenching of Fluorescent Nucleobases by Neighboring DNA: The “Insulator” Concept. ChemBioChem 2008, 9, 279–285. [DOI] [PubMed] [Google Scholar]
- (35).Wang HF; Wu SP A Pyrene-Based Highly Selective Turn-on Fluorescent Sensor for Copper(II) Ions and Its Application in Living Cell Imaging. Sens. Actuators, B 2013, 181, 743–748. [DOI] [PubMed] [Google Scholar]
- (36).Zhang X; Gou Z; Zuo Y; Lin W Pyrene-Based Polymer Fluorescent Materials for the Detection of 2,4,6-Trinitrophenol and Cell Imaging. J. Photochem. Photobiol., A 2021, 410, 113183. [Google Scholar]
- (37).Ma X; Chi W; Han X; Wang C; Liu S; Liu X; Yin J Aggregation-Induced Emission or Aggregation-Caused Quenching? Impact of Covalent Bridge between Tetraphenylethene and Naphthalimide. Chin. Chem. Lett 2021, 32, 1790–1794. [Google Scholar]
- (38).Chua MH; Ni Y; Garai M; Zheng B; Huang KW; Xu QH; Xu J; Wu J Towards Meso-Ester BODIPYs with Aggregation-Induced Emission Properties: The Effect of Substitution Positions. Chem. Asian J 2015, 10, 1631–1634. [DOI] [PubMed] [Google Scholar]
- (39).Chua MH; Zhou H; Lin TT; Wu J; Xu J Triphenylethylene- and Tetraphenylethylene-Functionalized 1,3-Bis(pyrrol-2-yl)squaraine Dyes: Synthesis, Aggregation-Caused Quenching to Aggregation-Induced Emission, and Thiol Detection. ACS Omega 2018, 3, 16424–16435. [Google Scholar]
- (40).Brooks AD; Yeung K; Lewis GG; Phillips ST A Strategy for Minimizing Background Signal in Autoinductive Signal Amplification Reactions for Point-of-Need Assays. Anal. Methods 2015, 7, 7186–7192. [DOI] [PMC free article] [PubMed] [Google Scholar]
- (41).Steinegger A; Wolfbeis OS; Borisov SM Optical Sensing and Imaging of pH Values: Spectroscopies, Materials, and Applications. Chem. Rev 2020, 120, 12357–12489. [DOI] [PMC free article] [PubMed] [Google Scholar]
- (42).Shamsipur M; Barati A; Nematifar Z Fluorescent pH Nanosensors: Design Strategies and Applications. J. Photochem. Photobiol. C 2019, 39, 76–141. [Google Scholar]
- (43).Daleke DL; Hong K; Papahadjopoulos D Endocytosis of Liposomes by Macrophages: Binding, Acidification and Leakage of Liposomes Monitored by a New Fluorescence Assay. Biochim. Biophys. Acta - Biomembr 1990, 1024 (2), 352–366. [DOI] [PubMed] [Google Scholar]
- (44).Avnir Y; Barenholz Y pH Determination by Pyranine: Medium-Related Artifacts and Their Correction. Anal. Biochem 2005, 347, 34–41. [DOI] [PubMed] [Google Scholar]
- (45).Wolfbeis OS An Overview of Nanoparticles Commonly Used in Fluorescent Bioimaging. Chem. Soc. Rev 2015, 44, 4743–4768. [DOI] [PubMed] [Google Scholar]
- (46).Rodriguez-Sevilla P; Thompson SA; Jaque D Multichannel Fluorescence Microscopy: Advantages of Going beyond a Single Emission. Advanced Nanobiomed Research. 2022, 2, 2100084. [Google Scholar]
- (47).Alexander T; Tran CD Simultaneous Measurement of One- and Two-Photon Excited Fluorescence from a Single Sample: A Detection Method for Oligonucleotides. Appl. Opt 2002, 41, 2285–2291. [DOI] [PubMed] [Google Scholar]
- (48).Wang N; Yu X; Deng T; Zhang K; Yang R; Li J Two-Photon Excitation/Red Emission, Ratiometric Fluorescent Nanoprobe for Intracellular pH Imaging. Anal. Chem 2020, 92, 583–587. [DOI] [PubMed] [Google Scholar]
- (49).Owens EA; Hyun H; Tawney JG; Choi HS; Henary M Correlating Molecular Character of NIR Imaging Agents with Tissue-Specific Uptake. J. Med. Chem 2015, 58, 4348–4356. [DOI] [PMC free article] [PubMed] [Google Scholar]
Associated Data
This section collects any data citations, data availability statements, or supplementary materials included in this article.
Supplementary Materials
Data Availability Statement
The data underlying this study are available in the published article and its Supporting Information.