Abstract
Background & Aims:
Non-alcoholic steatohepatitis (NASH) is characterized by steatosis, lobular inflammation, hepatocyte ballooning degeneration and fibrosis, all of which increase the risk of progression to end-stage liver disease. Osteopontin (OPN, SPP1) plays an important role in macrophage (MF) biology, but whether macrophage-derived OPN affects NASH progression is unknown.
Methods:
we analyzed publicly available transcriptomic datasets from patients with NASH, and used mice with conditional overexpression or ablation of Spp1 in myeloid cells and liver MFs, and fed them a high-fat, fructose and cholesterol diet mimicking the Western diet, to induce NASH.
Results:
this study demonstrated that MFs expressing high SPP1 are enriched in patients and mice with NAFLD, and show metabolic but not inflammatory properties. Spp1KI Mye or Spp1KI LvMF conferred protection, whereas OpnΔMye worsened NASH. The protective effect was mediated by induction of arginase-2 (ARG2), which enhanced fatty acid oxidation (FAO) in hepatocytes. Induction of ARG2 stemmed from enhanced production of oncostatin-M (OSM) in MFs from Spp1KI Mye mice. OSM activated STAT3 signaling, which upregulated ARG2. In addition to hepatic effects, Spp1KI Mye also protected through sex-specific extrahepatic mechanisms.
Conclusion:
MF-derived OPN protects from NASH, by upregulating OSM, which increases ARG2 through STAT3 signaling. Further, the ARG2-mediated increase in FAO reduces steatosis. Therefore, enhancing the OPN–OSM–ARG2 crosstalk between MFs and hepatocytes may be beneficial for NAFLD patients.
Keywords: arginase 2, inflammation, steatosis
INTRODUCTION
Non-alcoholic fatty liver disease (NAFLD) encompasses a broad spectrum of chronic liver diseases affecting ~25% of the population worldwide1. NAFLD is caused by excessive energy intake leading to fat accumulation in hepatocytes. Intracellular lipids enhance oxidative damage, endoplasmic reticulum stress, cell injury and death, driving progression to steatohepatitis2. Non-alcoholic steatohepatitis (NASH) is a severe form of NAFLD, characterized by significant steatosis, lobular inflammation, hepatocyte ballooning degeneration and fibrosis, all of which increase the risk of progression to end-stage liver disease3.
Myeloid cells, specifically monocytes and macrophages (MFs), play an important role in progression of NASH4. Single-cell RNA sequencing (scRNAseq) identified heterogeneous MF phenotypes in NAFLD5. In addition to monocyte-derived macrophages (MoMFs) and Kupffer cells (KCs), there appears to be a novel lipid-associated MF (LAM) population in the liver that is prevalent in NAFLD and NASH, with a unique transcriptome5–7. LAMs express high levels of TREM2, CD9, GPNMB and SPP16 compared to MoMFs and KCs. However, their roles are inconclusive7, 8.
Osteopontin (OPN) correlates with liver triglycerides (TGs) in NAFLD patients9. However, previous studies on the role of OPN in NASH progression using Spp1−/− mice, showed inconsistent results10–12. A likely explanation is the cellular and tissular source of OPN13. For example, induction of hepatocyte-derived OPN protects from alcohol-associated liver injury by blocking gut-derived LPS and TNFα effects in the liver14. At physiological levels, hepatocyte-derived OPN acts as tumor suppressor by regulating the acute response to diethylnitrosamine, and the presence of cancer stem cells, while induction of OPN is pro-tumorigenic15. Overexpression of OPN in hepatic stellate cells, treatment with OPN or co-culture with biliary epithelial cells (BECs) that secrete OPN, upregulate COL1 and promote liver fibrosis16, 17. In BECs, OPN induces ductular reaction and TGFB production18. Hence, there is a need to better understand the contribution of the cellular source of OPN to NASH.
The role of OPN in MFs has been studied mostly in vitro, however whether MF-derived OPN contributes to NASH remains unknown. OPN promotes an immunosuppressive and anti-inflammatory phenotype in MFs to favor tumorigenesis19. Further, loss of OPN increases inducible nitric oxide synthase in MFs, exacerbating inflammation in ischemia reperfusion injury20. Here, we hypothesized that MF-derived OPN protects from NASH. To test this, we analyzed publicly available transcriptomic datasets from patients with NASH, and used mice with conditional overexpression or ablation of Spp1 in myeloid cells and liver MFs, and fed them a high-fat, fructose and cholesterol (HFFC) diet that mimics the Western diet, to induce NASH21.
MATERIALS AND METHODS
Mice.
Spp1fl/fl mice were developed in our laboratory15. Spp1.Stopfl/fl mice were provided by Dr. Vily Panoutsakopoulou (Biomedical Research Foundation, Academy of Athens, Greece)22. Spp1fl/fl and Spp1.Stopfl/fl mice were bred with Lyz2.Cre mice (JAX004781, Jackson Laboratory, Bar Harbor, ME) to generate myeloid-specific knock-out (Spp1ΔMye) and knock-in (Spp1KI Mye) mice. Lyz2.Cre mice were used as littermate controls and are referred to as WT for simplicity only. Clec4f.TdT mice (JAX033296) were bred with Spp1-Stopfl/fl mice to obtain Spp1KI LvMF. Arg2fl/fl mice (JAX 036077) were bred with Albumin.Cre (JAX003574) to generate hepatocyte-specific knock-out mice (Arg2ΔHep). All mice were in C57BL/6J background.
Induction of NASH.
Male and female mice were fed between 6 weeks and 6 months with HFFC diet to induce NASH (D16010101, Research Diets Inc., New Brunswick, NJ). The HFFC diet contained 40% of calories from fat, 20% from fructose, and 18 g/kg cholesterol. Control mice were fed an isocaloric control diet (D09100304), where calories were balanced with carbohydrates. On the day mice were euthanized, food was removed at 8 am, systemic blood was drawn from the submandibular vein at 12 pm, and tissues were harvested under 2.5% isoflurane anesthesia.
Study approvals.
All animals received humane care according to criteria outlined in the Guide for the Care and Use of Laboratory Animals, prepared by the National Academy of Sciences, and published by the National Institutes of Health. Housing and husbandry conditions were IACUC approved prior to initiating the studies. All in vivo experiments were carried out according to ARRIVE guidelines. De-identified human liver biopsies were obtained from the University of Illinois at Chicago Health Biorepository and evaluated by a pathologist for NASH. The study was approved by the Institutional Review Board at University of Illinois at Chicago.
Statistics.
Data are expressed as mean ± standard error of the mean (SEM). R was used for all computational and statistical analyses. Unpaired Student’s t test or Mann–Whitney U test was used to compare continuous or discontinuous variables between groups. A p-value <0.05 was considered as statistically significant.
RESULTS
Patients with higher SPP1 mRNA expression in KCs, have relatively lower steatosis scores.
Analysis of transcriptome dataset GSE135251 (n=206 NAFLD patients) from the Gene Expression Omnibus (GEO), revealed significant correlation of SPP1 mRNA expression with the NAFLD activity score (NAS) and fibrosis score (Fig. 1A). Analysis of transcriptome datasets GSE126848, GSE135251 and GSE167523 (n=335 NAFLD patients), showed 45 genes in common correlated with SPP1 expression (Table S1). Mapping these 45 genes against human scRNAseq dataset GSE136103 (healthy individuals and patients with cirrhosis), identified 9 genes expressed in myeloid cells, with three being myeloid cell-specific (TREM2, MMP9, OLR1) (Fig. 1B & S1A, B). Cell clustering of scRNAseq dataset GSE136103, identified a MF population with high SPP1 expression (SPP1High MFs) (Fig. S1C, cluster 0), also high for TREM2, a marker of LAM. In this dataset, MF SPP1 expression increased in cirrhotic patients compared to uninjured (Fig. S1C). In addition, RNA-seq of primary KCs from NASH patients (NCT01672879, Gilead Sciences), revealed that those with higher SPP1 expression in KCs, had relatively lower steatosis score (Fig. 1C). Hence, although hepatic SPP1 mRNA correlated with NASH progression, whether MF-derived OPN protects or damages the liver, needed further investigation.
Figure 1. Patients with higher SPP1 mRNA expression in KCs, have relatively lower steatosis scores.
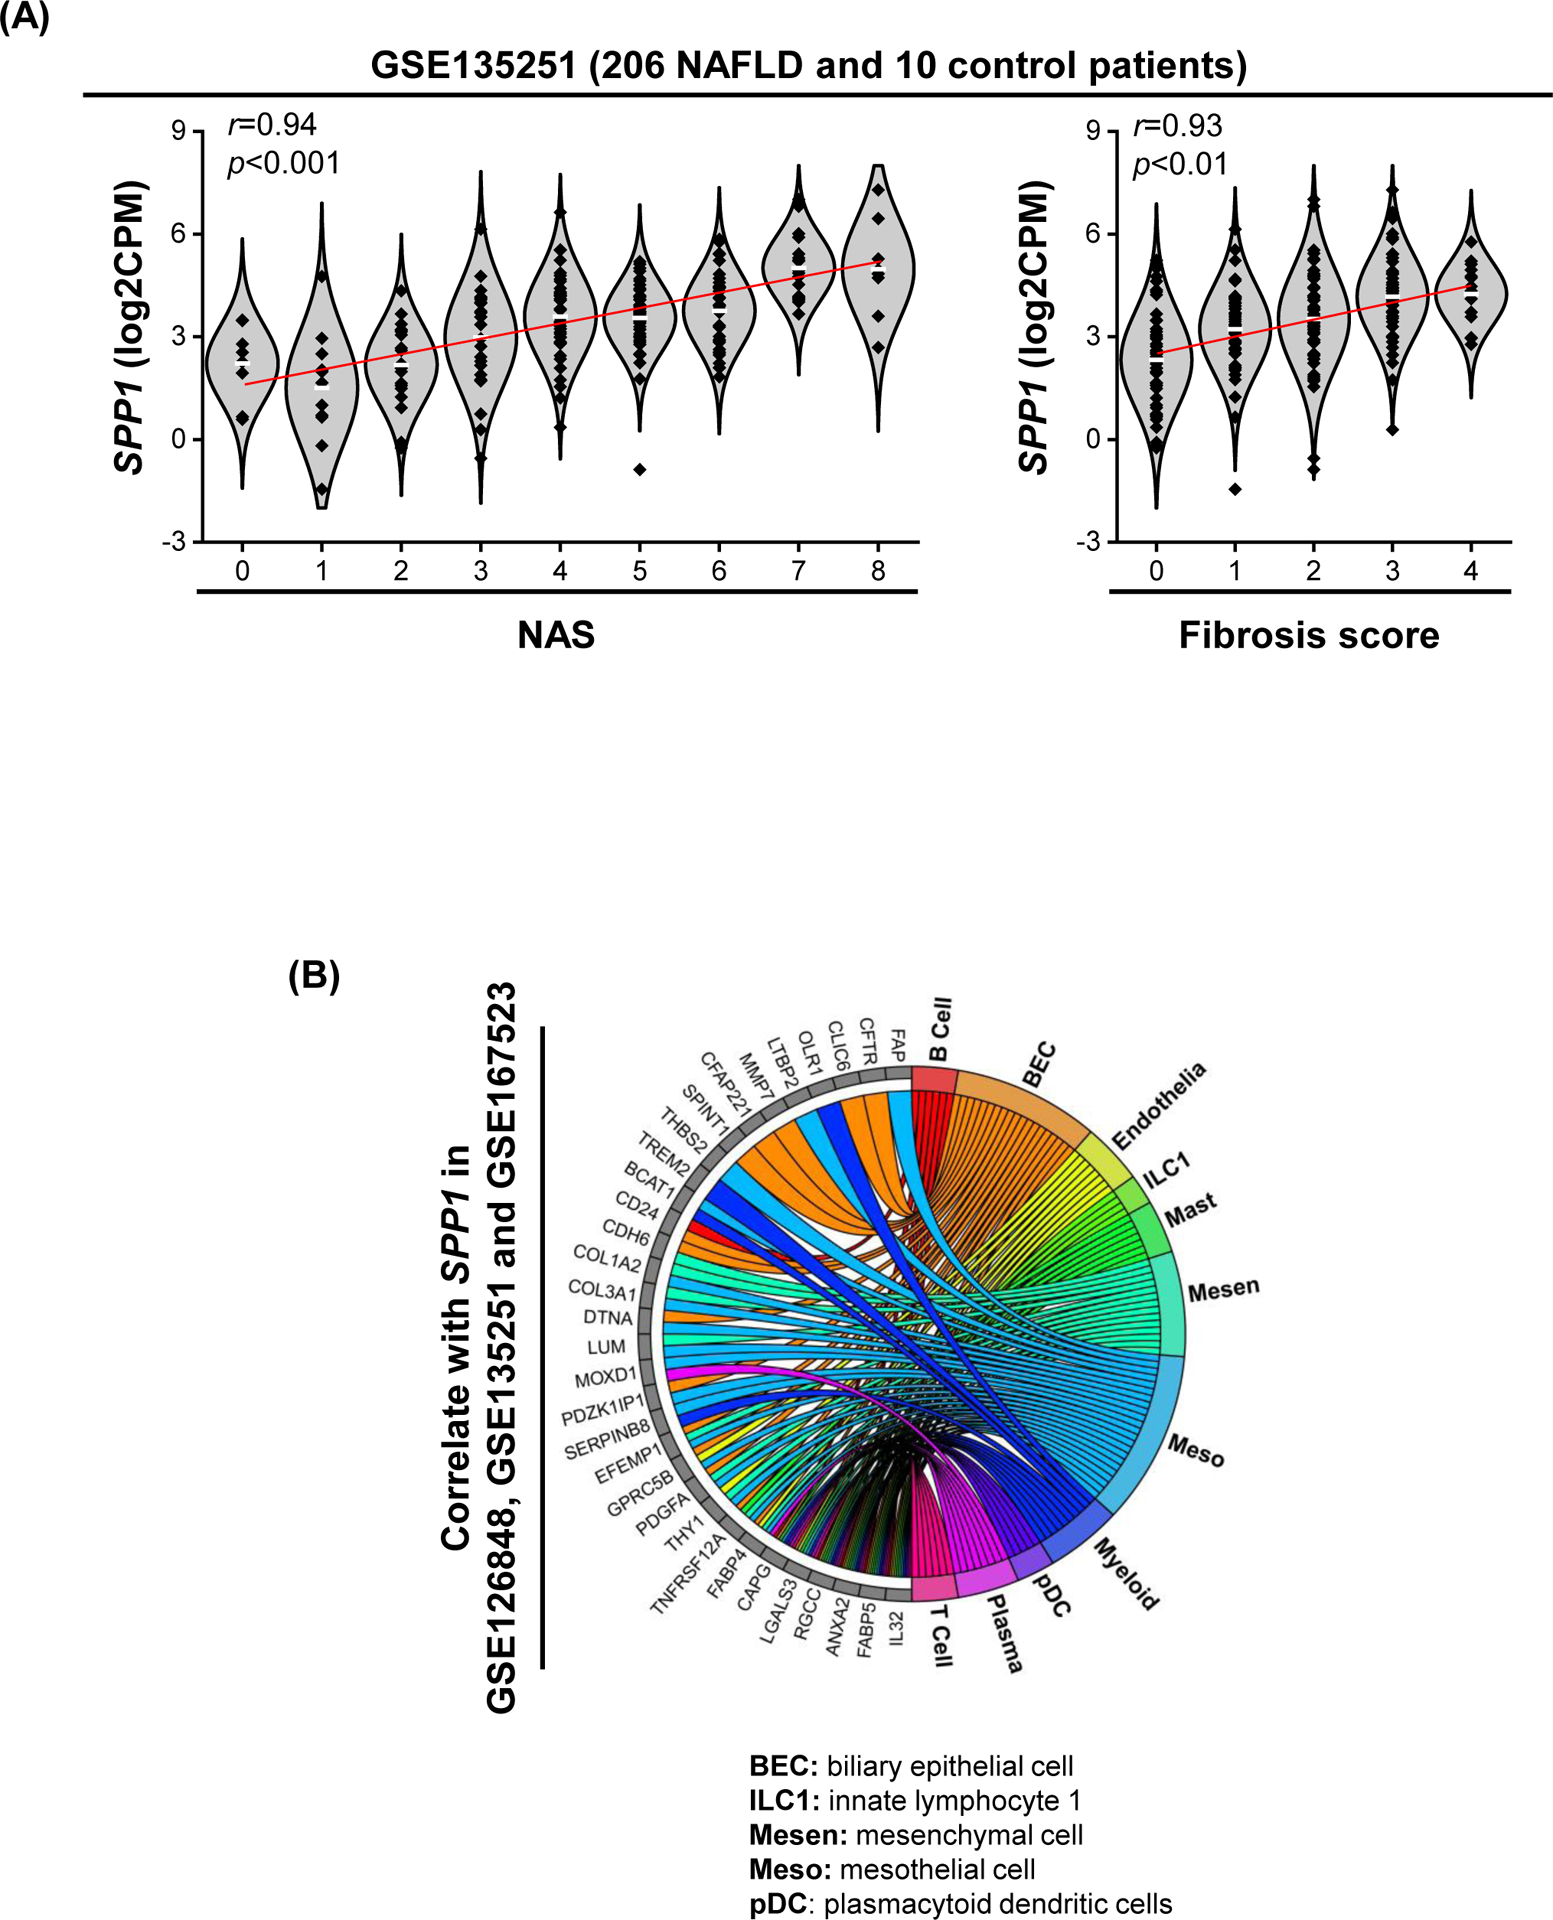
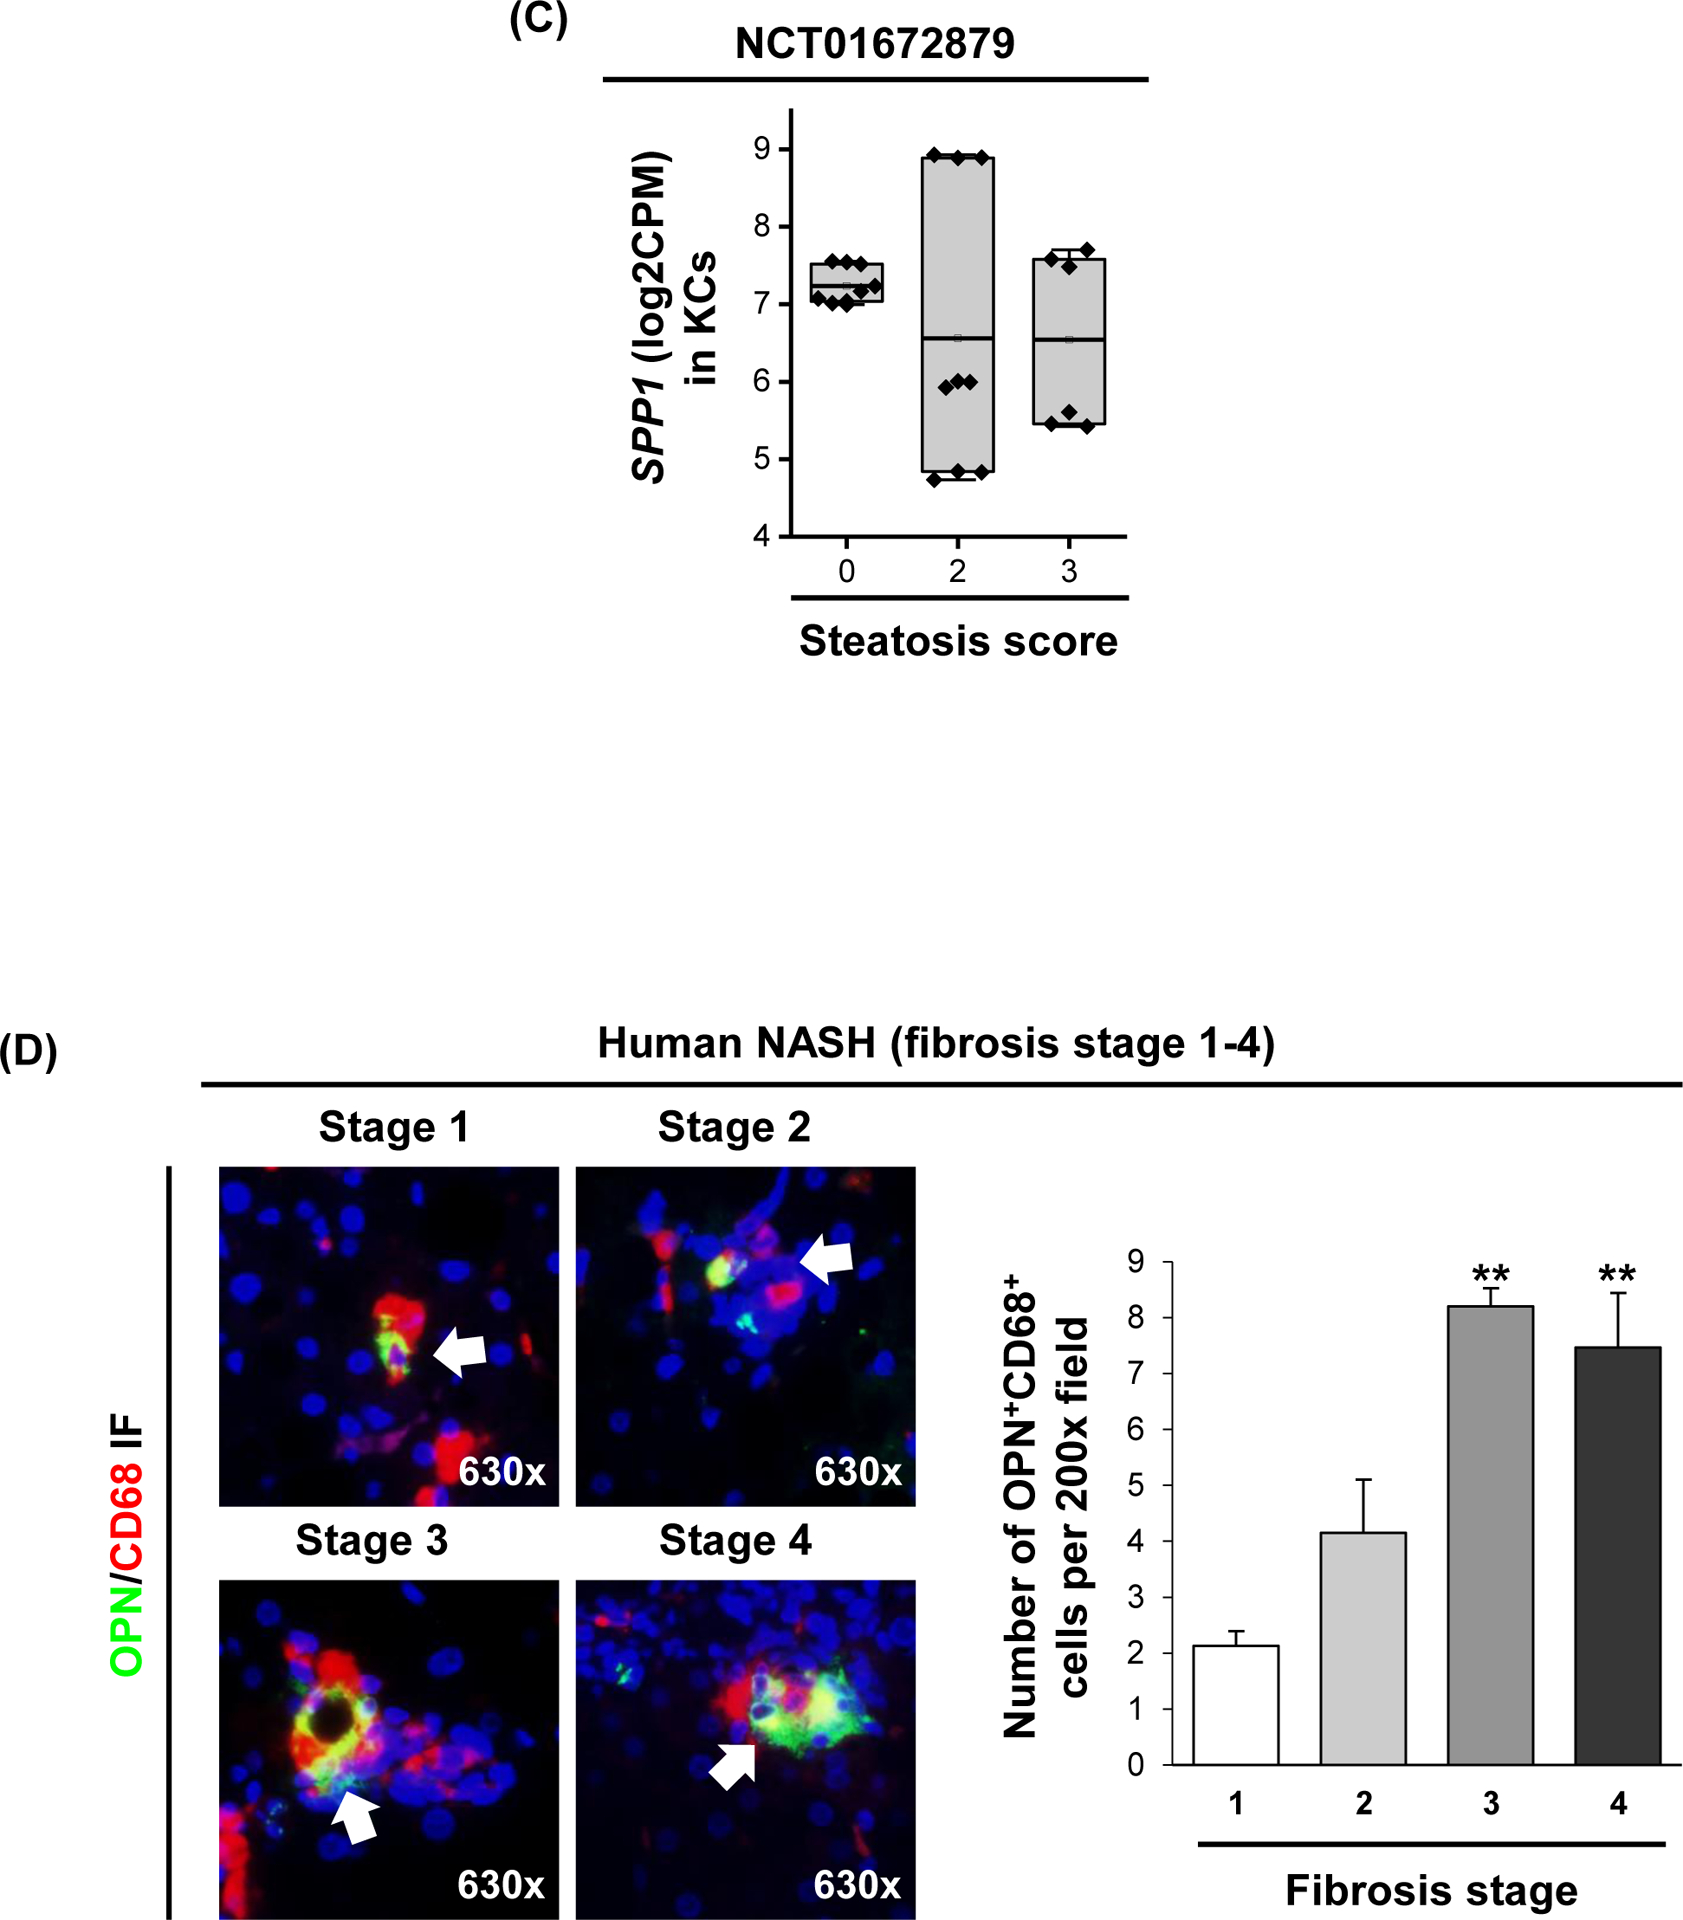
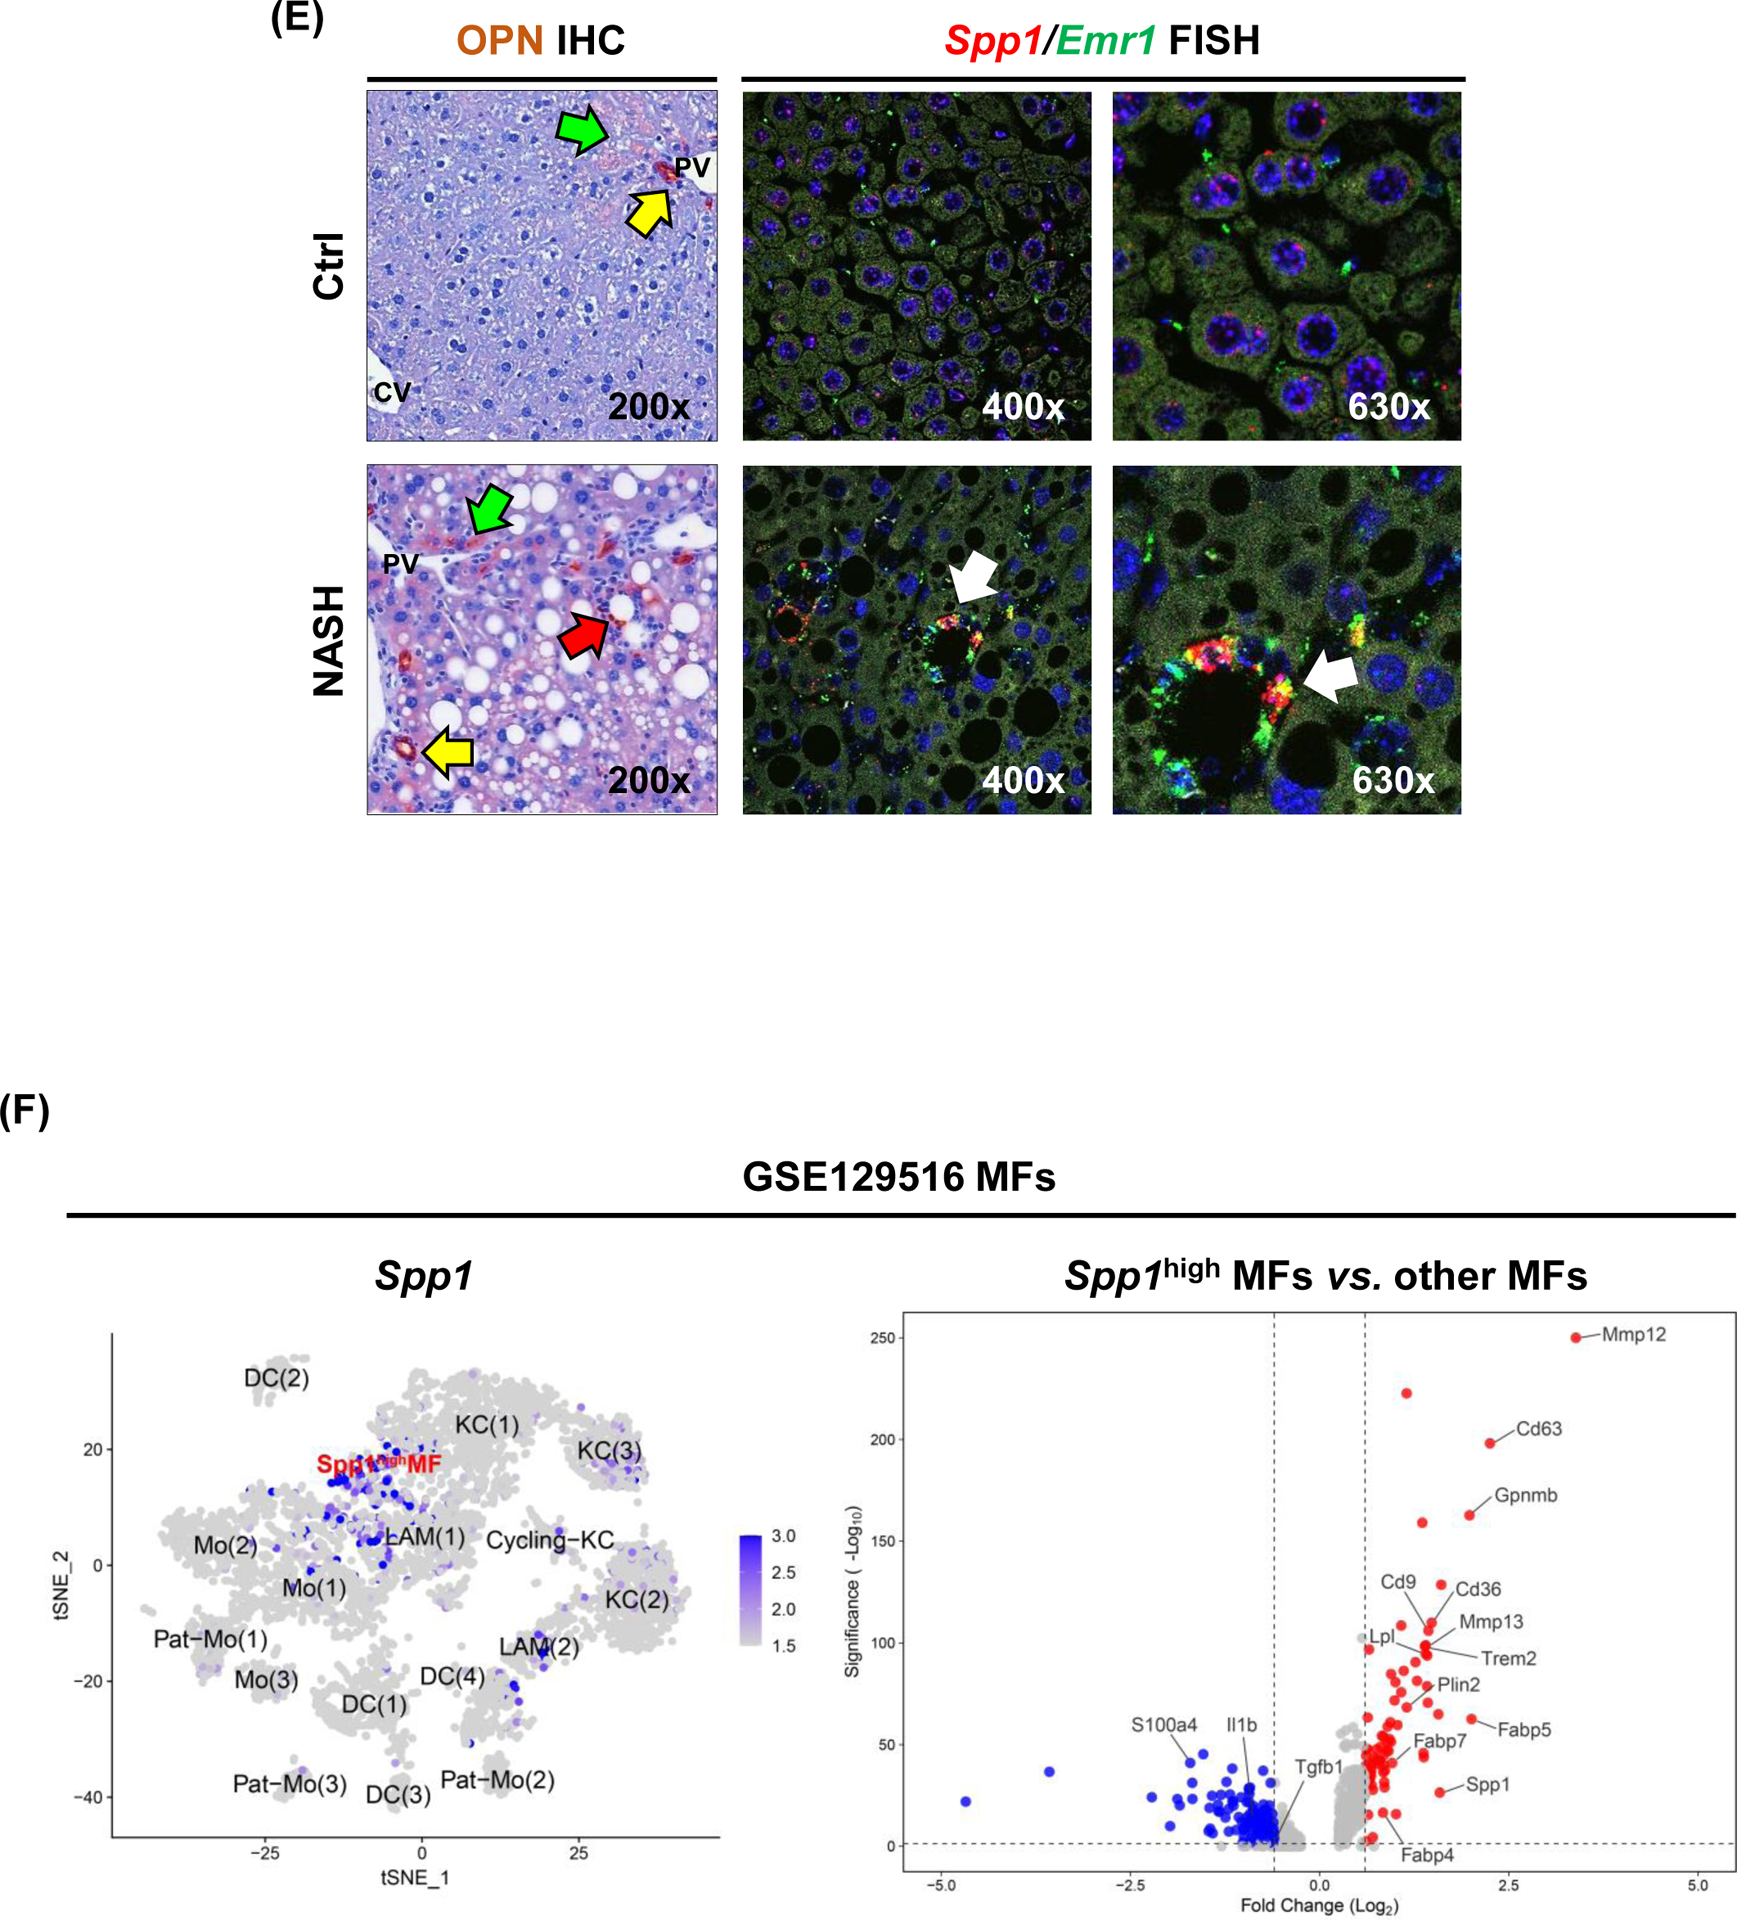
(A) Violin plots for SPP1 log2CPM in GSE135251 in which patients were stratified by NAS (left) or fibrosis score (right). Linear regression was performed, and mean expression (white line) and r and p values are shown. (B) Chord diagram showing cell populations expressing the 45 genes correlated with SPP1. (C) Relative SPP1 mRNA expression in MFs from NASH patients stratified by steatosis score. (D) Human liver biopsies from NASH patients with fibrosis stage 1–4, immunostained with OPN (green) and CD68 (red) by IF (white arrows: OPN+CD68+ cells) (left) and quantification (right). (E) Liver sections from mice with NASH immunostained for OPN (yellow arrows: OPN+ BECs; green arrows: OPN+ hepatocytes; red arrows: OPN+ inflammatory cells) and FISH (white arrow: Spp1+Emr1+). (F) Identification of a MF population with high Spp1 expression in mice with NASH. Feature plot of Spp1 in different MF clusters (left) and volcano plot of DE genes between Spp1High MFs and other MFs (right).
OPN protein expression increases in MFs from patients and mice with NASH.
To confirm the main cellular source of OPN during progression to NASH, we immunostained human liver biopsies (NASH, fibrosis stage 1–4) and tissues from mice with NASH. OPN staining gradually increased with fibrosis stage in NASH patients, along with clusters of OPN+ MFs, identified by colocalization of OPN (or SPP1) and CD68 by immunohistochemistry (IHC) (Fig. 1D) or fluorescent in situ hybridization (FISH) (Fig. S1D). Mice fed control diet displayed restricted OPN protein expression in BECs and minimal staining in surrounding hepatocytes and non-parenchymal cells (Fig. 1E, top). Mice with NASH showed induction of OPN expression in hepatocytes (Fig. 1E, bottom left) and MFs, the latter further demonstrated by co-localization of Spp1 and Emr1 (encoding F4/80) (Fig. 1E, bottom right). These results confirm that MFs have increased OPN expression in human and mouse NASH.
MFs with upregulation of OPN mRNA expression show a metabolic phenotype in NASH.
To understand the functional role of OPN+ MFs, we re-analyzed a publicly available scRNAseq dataset from mice with NASH (GSE129516). Sub-clustering of MF populations identified five clusters [KC(1), Cycling-KC, LAM(1), LAM(2), Spp1High MFs] with increased Spp1 expression in NASH compared to control (Fig. S1E). Among them, Spp1High MFs showed highest Spp1 expression along with expression of LAM markers (Trem2, Gpnmb, Cd9) (Fig. 1F & S1E). Further analysis revealed that 99% of Spp1High MFs originated from mice with NASH (Fig. S1E). Differential expression (DE) analysis unveiled that Spp1High MFs had relatively lower levels of genes involved in inflammation (Il1b, S100a4) and fibrosis (Tgfb), but higher of genes involved in lipid metabolism (Cd36, Lpl, Fabp5, Fabp4, Fabp7) and extracellular matrix remodeling (Mmp12, Mmp13) (Fig. 1F). Likewise, these differences were observed in Spp1High MFs compared to other LAMs, however they were lower compared to LAM(2), with mid-level Spp1 expression (Fig. S1F). Ingenuity Pathway Analysis (IPA) predicted inhibition of pathways involved in inflammation (leukocyte extravasation, IL6, HMGB1) in Spp1High compared to other MFs, but up-regulation in lipid metabolism (LXR/RXR, PPARα/RXRα) (Table S2). These results suggest that upregulation of OPN in MFs confers metabolic, but not inflammatory properties, in NASH.
Knock-in mice of Spp1 in myeloid cells (Spp1KI Mye) are protected from NASH.
To understand how OPN induction in MFs contributes to NASH progression, Spp1KI Mye mice were generated. To validate overexpression, myeloid cells were sorted (Fig. S2A). qPCR analysis showed highest Spp1 overexpression in KCs, followed by monocytes (Fig. S2B). However, Spp1KI Mye did not affect Spp1 expression in total liver tissue, but increased expression in spleen (with abundant myeloid cells) and isolated MFs (Fig. S2C). In MFs, there was more expression of OPN and its cleavage products in Spp1KI Mye but not in wild-type (WT, Lyz2.Cre) mice at baseline (Fig. S2D).
Then, Spp1KI Mye and WT mice were fed for 6 months with control or NASH-inducing diet. Both male and female WT mice developed NASH, presenting severe steatosis, inflammation and hepatocyte ballooning degeneration, with fine distribution of micro- and macrovascular steatosis close to central and portal regions, respectively (Fig. 2A, B). WT males presented more severe pathology (NAS=6.4) than females (NAS=4.8). Both genders of Spp1KI Mye had significantly decreased NAS, liver-to-body weight ratio, lipid droplets, liver TGs and cholesterol (CHO), and ALT activity, compared to WT mice with NASH (Figs. 2B–D and S3A). Notably, male and female Spp1KI Mye fed control diet, had lower NAS and liver TGs than WT mice (Fig. 2B–D).
Figure 2. Spp1KI Mye mice are protected from NASH.
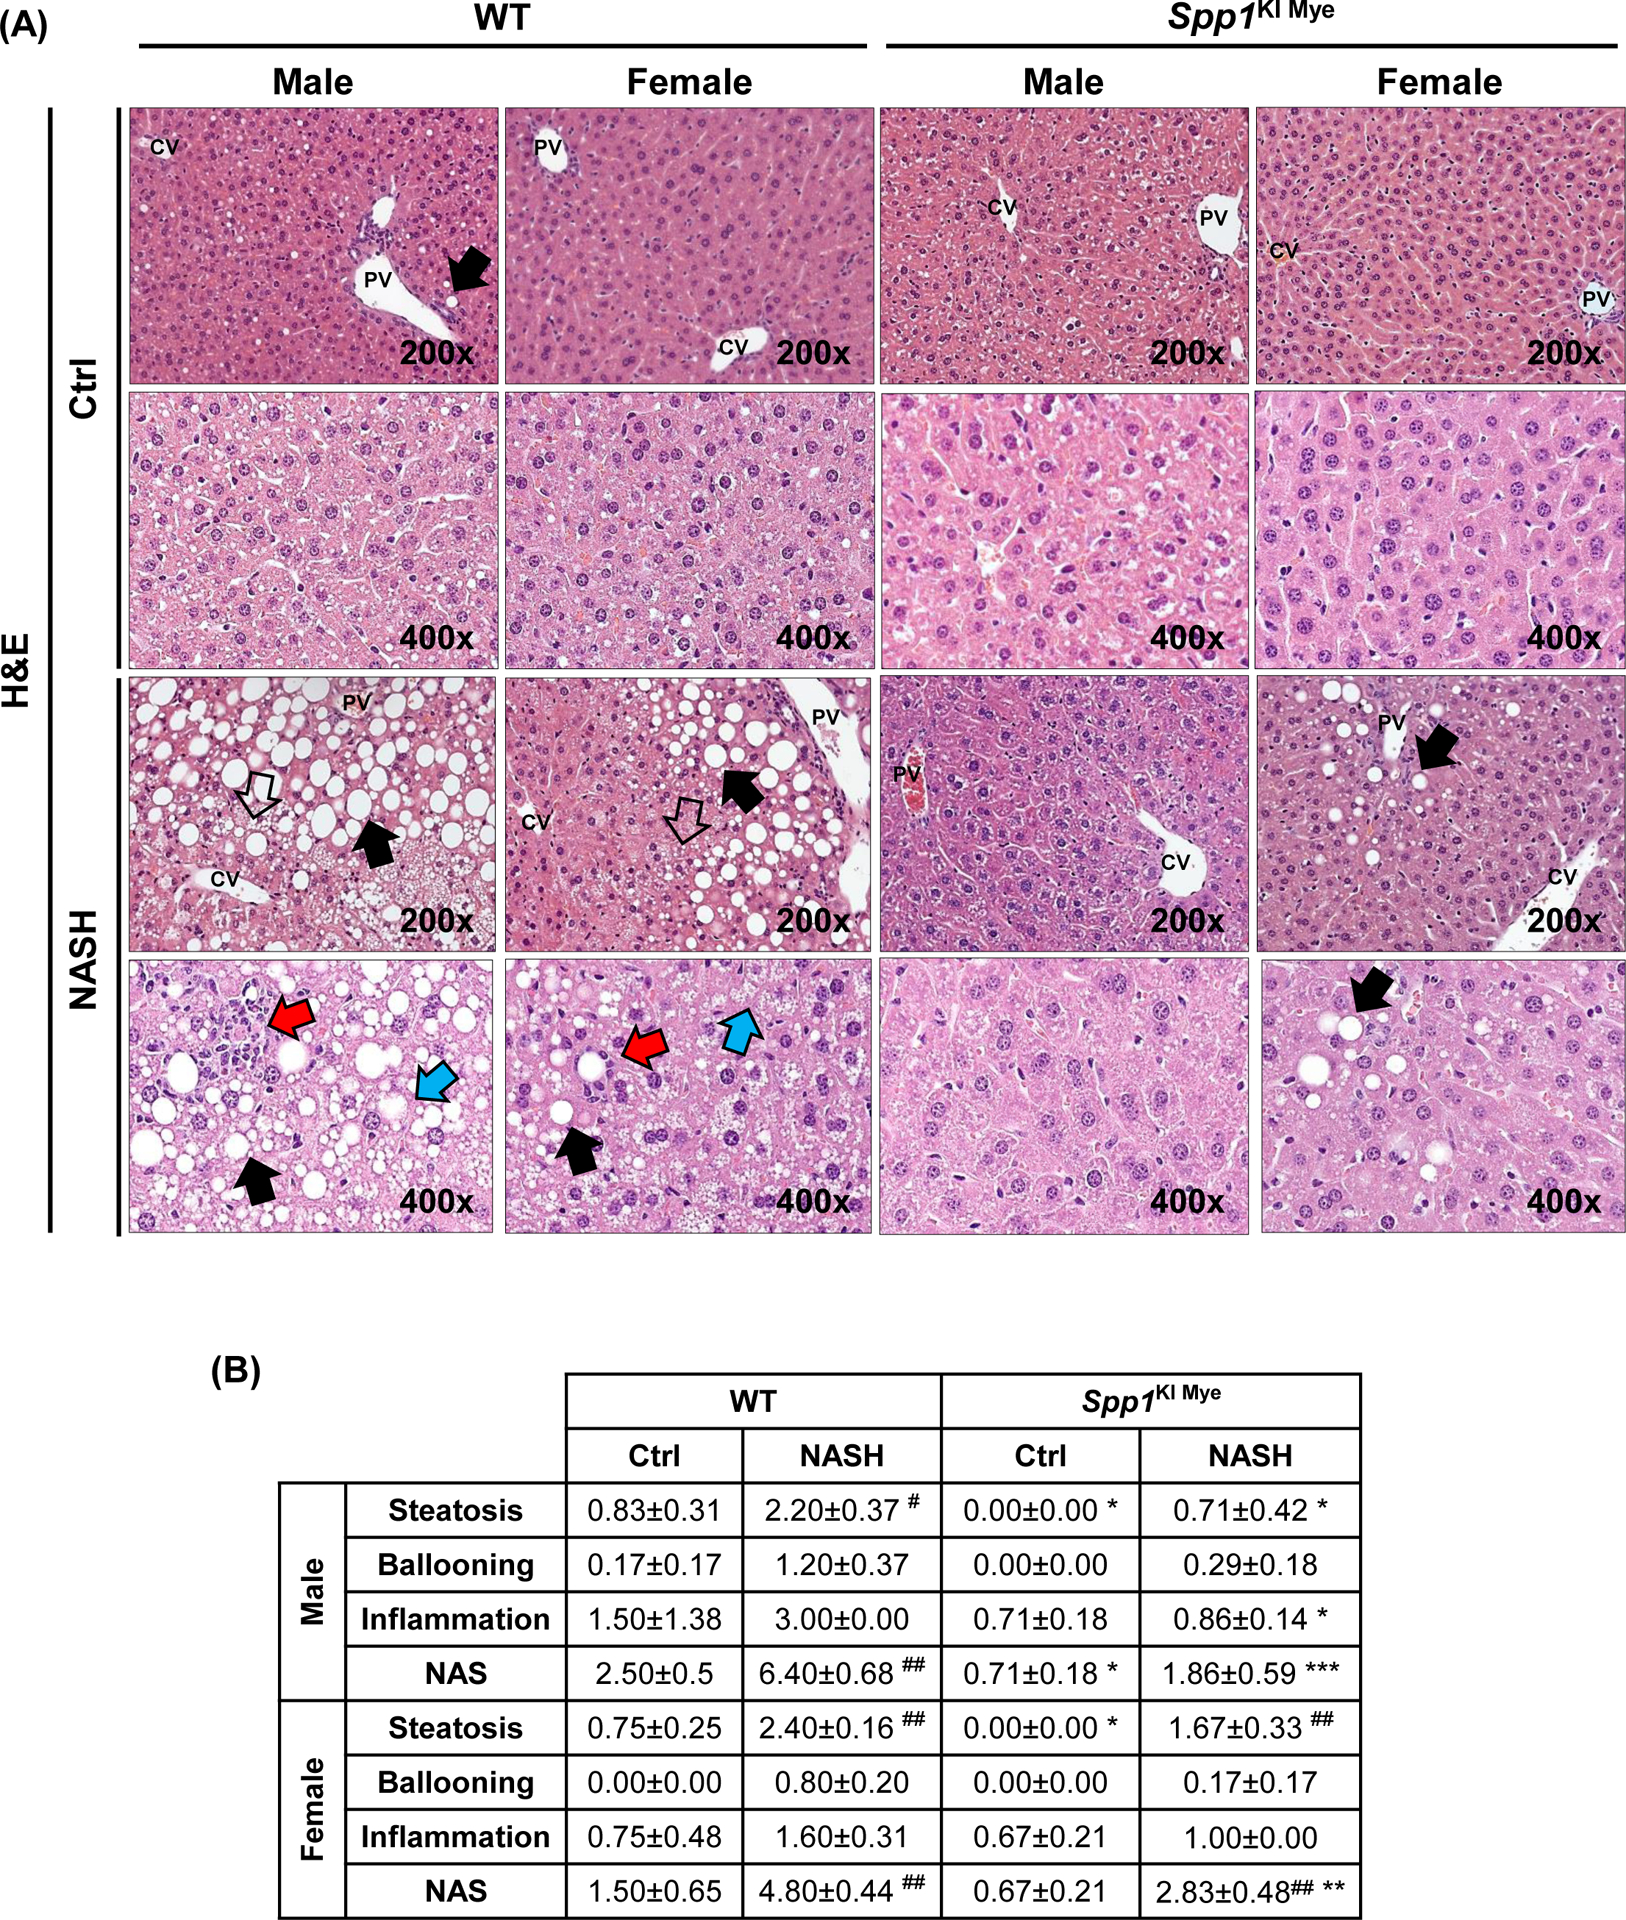
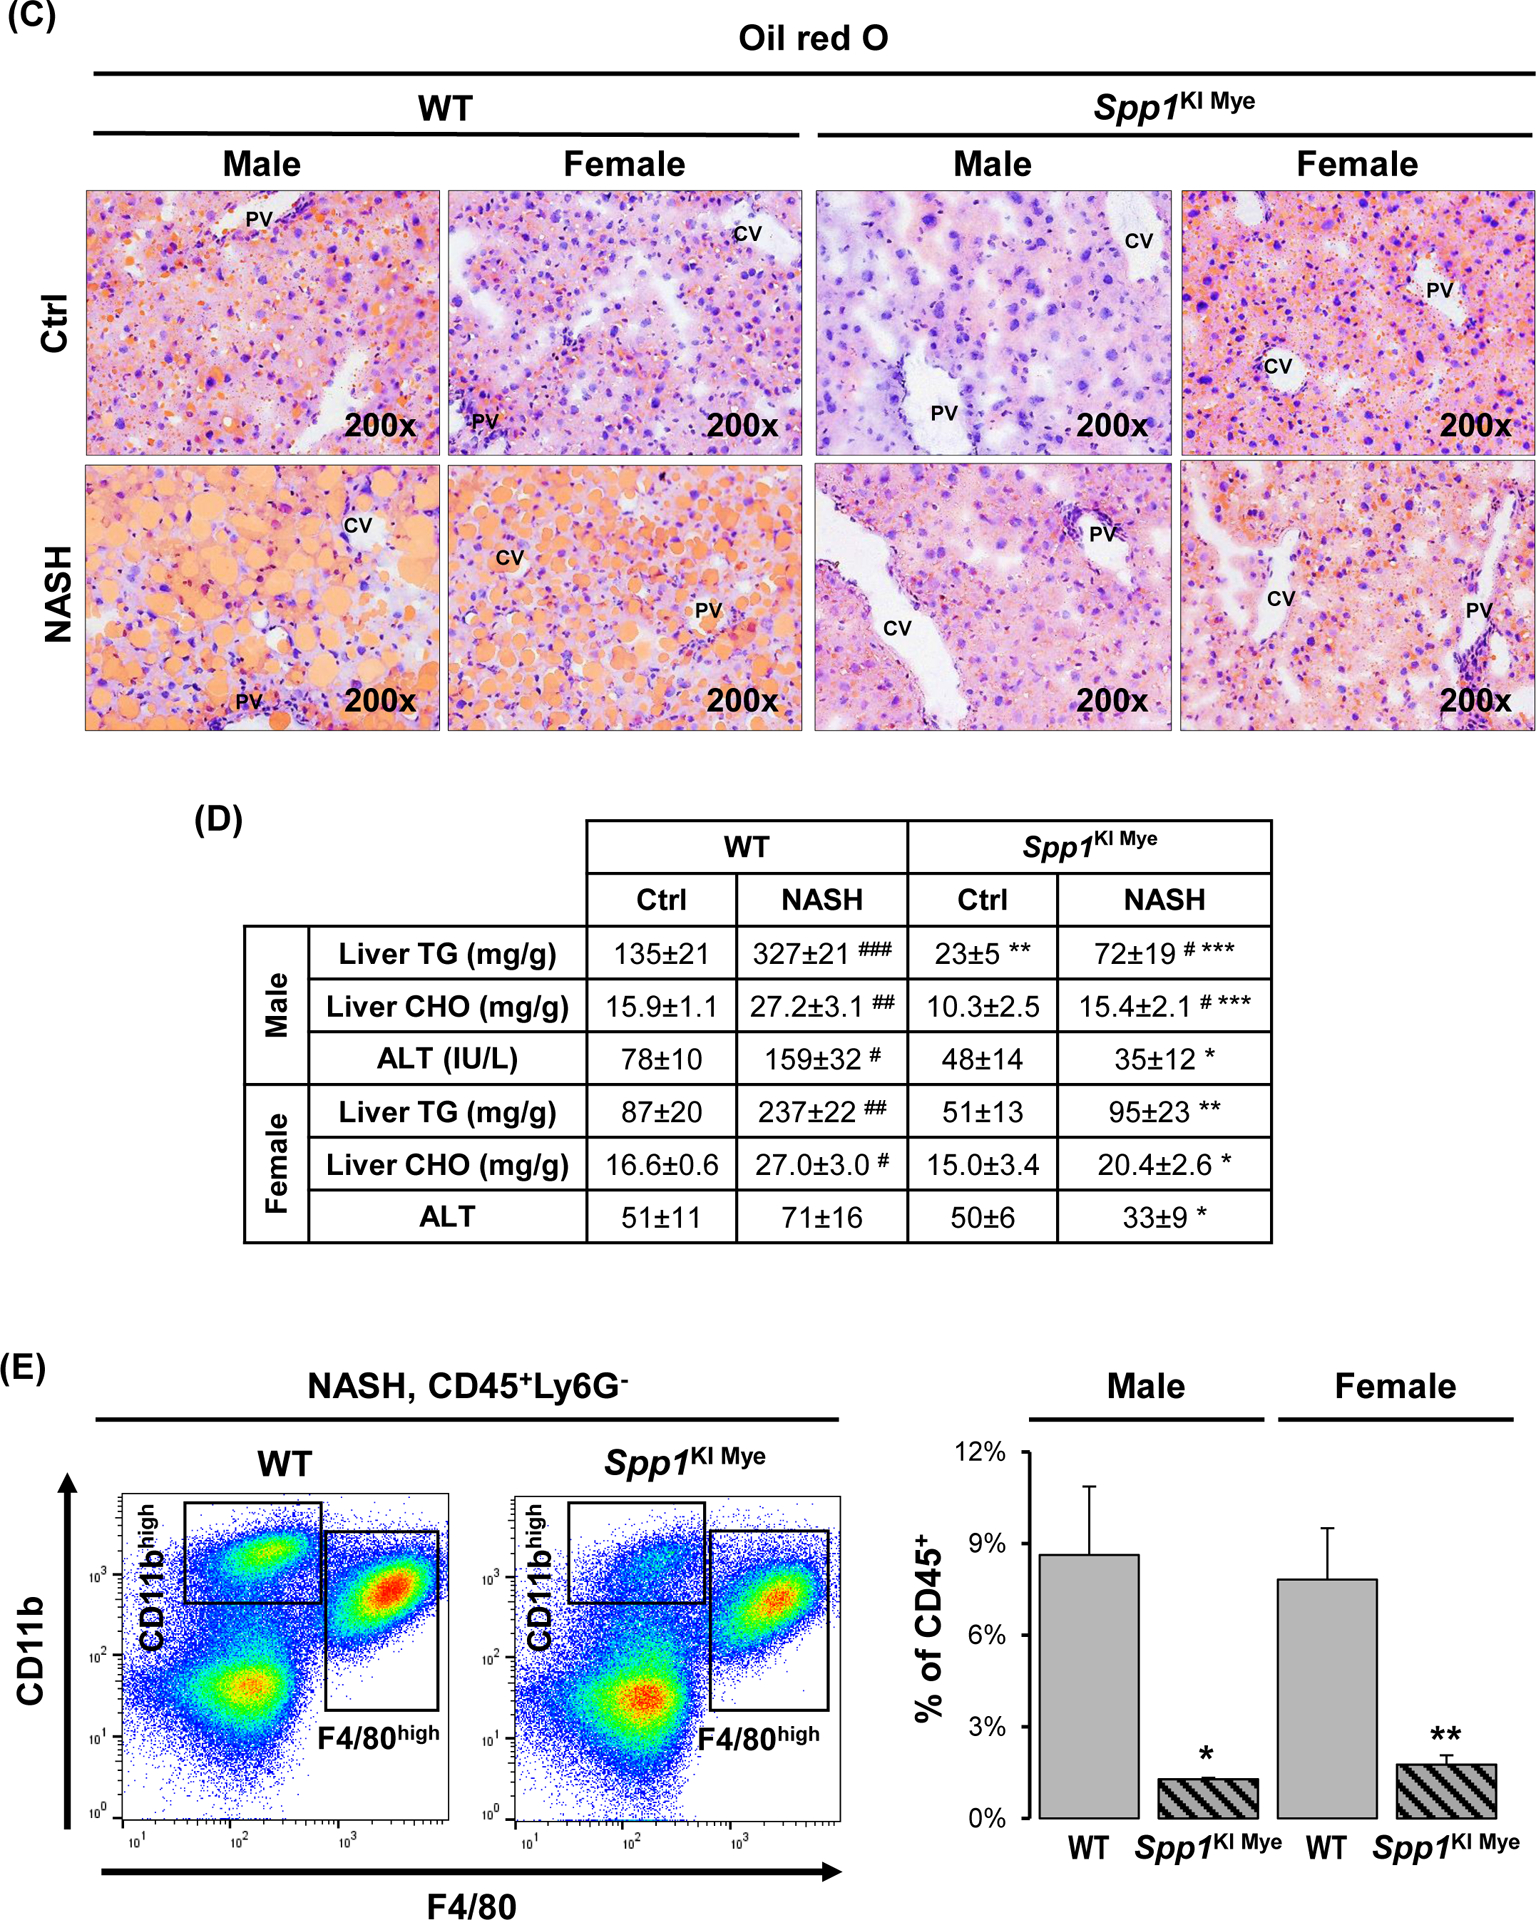
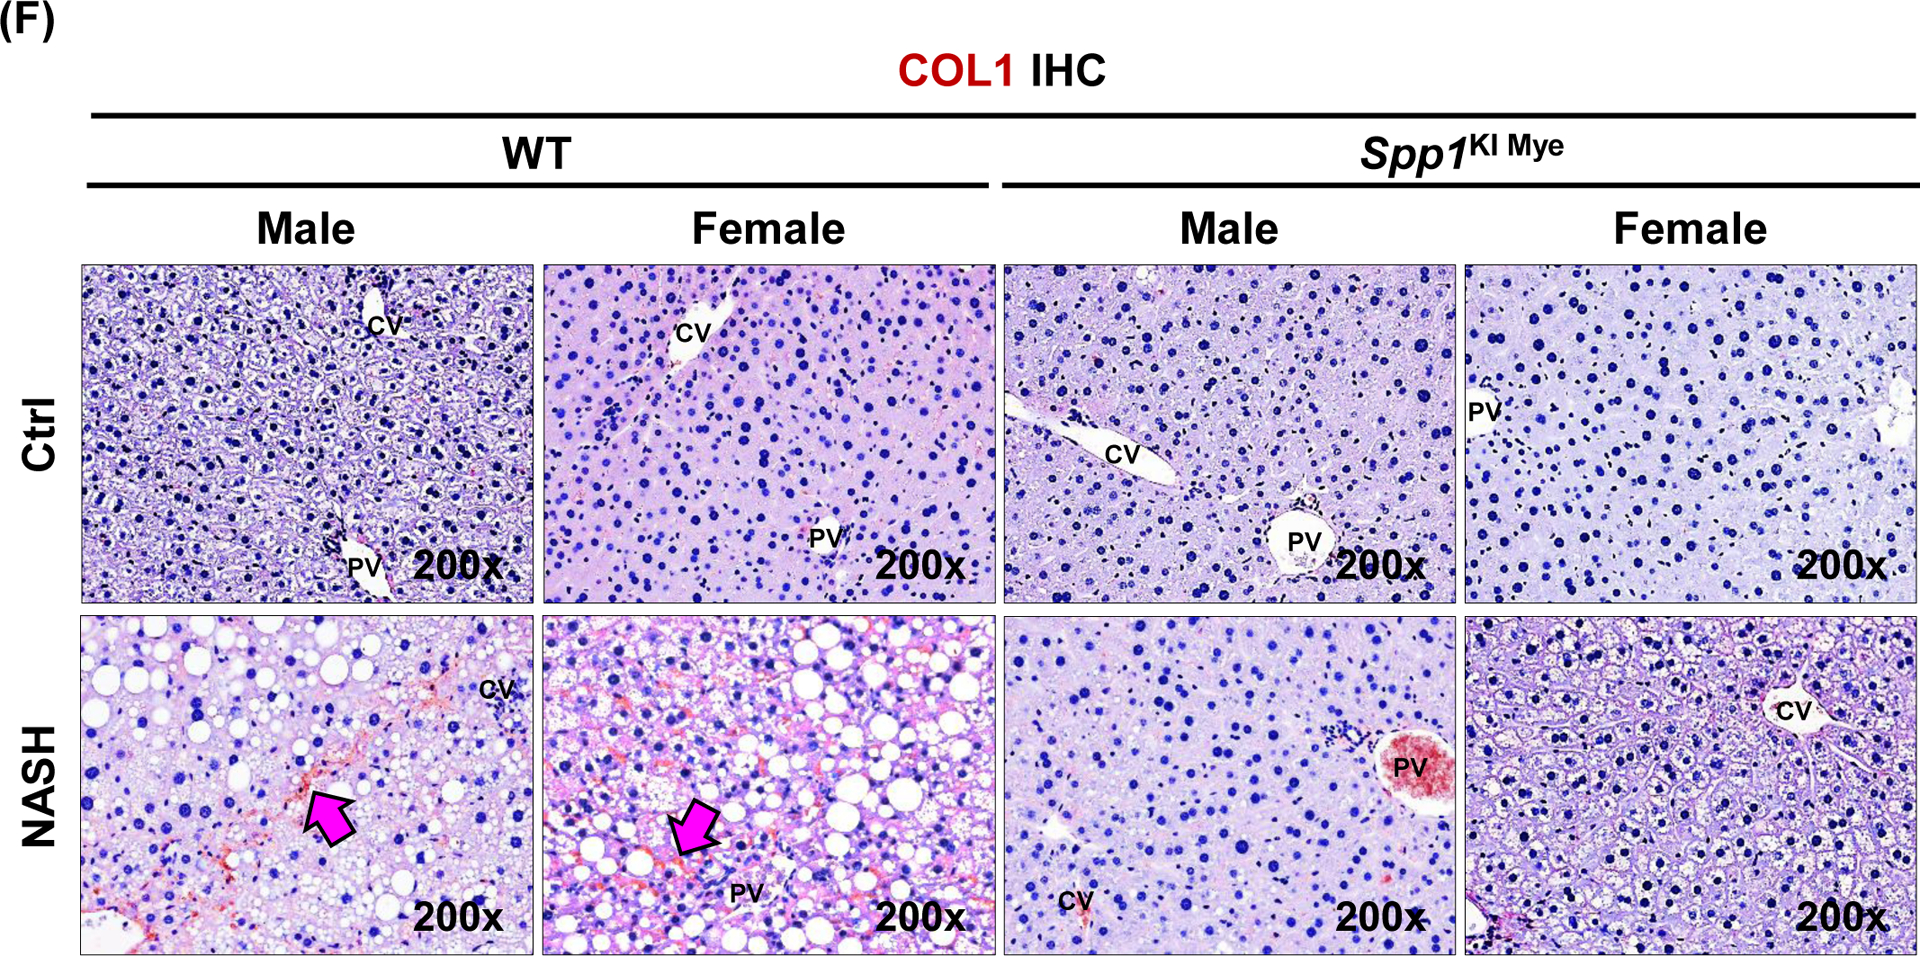
Spp1KI Mye and WT mice were fed for 6 months with control or NASH-inducing diet. (A) H&E staining of liver (black arrows: macrovesicular steatosis; black open arrows: microvesicular steatosis; red arrows: inflammatory foci; blue arrows: hepatocyte ballooning degeneration). (B) Individual scores and NAS. (C) Oil red O staining of liver. (D) Liver TGs and CHO normalized by protein, and serum ALT activity. (E) Flow cytometry analysis of immune cells based on CD11b and F4/80 (left) and quantification of infiltrating MoMFs (n=3/genotype) (right). (F) IHC for COL1 (pink arrows: collagen fibrils). Results are expressed as mean ± SEM; n≥6/group. #p<0.05, ##p<0.01 and ###p<0.001 vs. control with same genotype; *p<0.05, **p<0.01 and ***p<0.001 vs. WT with same diet.
The number of MoMFs (CD45+CD11bHighF4/80LowLy6G−) decreased in liver from Spp1KI Mye compared to WT mice (Fig. 2E). Chicken-wire fibrosis was present in WT with NASH but absent in Spp1KI Mye mice (Fig. 2F and S3B). Transcriptomics analysis of total liver tissue revealed downregulation of key chemokine receptors and ligands (Ccl2, Ccr2, Il33, Tnf) and pro-fibrogenic markers (Tgfb1, Col1a1, Col1a2, Igfbp3) in Spp1KI Mye with NASH compared to WT mice (Fig. S3C). Significant changes in these genes were greater in males than females. However, none of the lipid metabolism pathways were consistently different between sexes (Fig. S3D). Fatty acid (FA) transport was downregulated in males, whereas FA and cholesterol synthesis were downregulated in females (Fig. S3D). In summary, Spp1KI Mye mice, especially males, are protected from NASH.
Knock-in mice of Spp1 in liver resident MFs are also protected from NASH.
As Lyz2.Cre targets both intra- and extrahepatic MFs (Fig. S2B & S4A), mice overexpressing Spp1 only in liver resident MFs (Spp1KI LvMF) were generated. While Spp1KI Mye had significant Spp1 overexpression in circulating monocytes, it was lacking in Spp1KI LvMF mice (Fig. S4A). After feeding NASH-inducing diet for 6 months, Spp1KI LvMF mice were protected from NASH, shown by H&E staining, reduced liver-to-body weight ratio, NAS, liver TGs and CHO (Fig. S4B, C). However, unlike Spp1KI Mye, males and females were equally protected. Therefore, liver resident MFs play a major role in the protective effect of Spp1KI Mye mice in NASH.
Mice with ablation of Spp1 in myeloid cells (Spp1ΔMye) have accelerated progression to NASH.
To investigate if ablating Spp1 in myeloid cells exacerbated NASH, we generated Spp1ΔMye mice and fed them control or NASH-inducing diet up to 6 months. Spp1ΔMye had exacerbated NASH compared to WT mice, particularly at early time-points (1 and 3 months) compared to 6 months, as shown by H&E staining, NAS, liver TGs and CHO (Fig. S5A–C). At 6 months, livers had more inflammation characterized by increased inflammatory foci, crown-like structures and Tnf and Mpo expression (Fig. S5D, E). Therefore, Spp1ΔMye accelerates progression to NASH at early time-points and increases inflammation later.
Spp1KI Mye mice with NASH have less saturated and monounsaturated fatty acids containing TGs.
To determine if changes in FA metabolism accounted for the protection from NASH in Spp1KI Mye compared to WT mice, we performed untargeted metabolomics and lipidomics analyses of their livers. Peak intensity from the identified TGs revealed that the FC between Spp1KI Mye and WT mice showed strong positive correlation with total number of carbon atoms of TGs and moderate correlation with saturation state (Fig. S6A). Statistical analysis showed that 35 TGs were significantly changed in Spp1KI Mye with NASH compared to WT mice (Table S3). Among the main changes, most TGs containing saturated fatty acids were downregulated, while TGs containing very long-chain polyunsaturated fatty acids (PUFAs) were upregulated in Spp1KI Mye mice with NASH (Fig. 3A & S6B).
Figure 3. Increase in urea cycle and upregulation of Arg2 correlate with the protective effect of Spp1KI Mye mice.
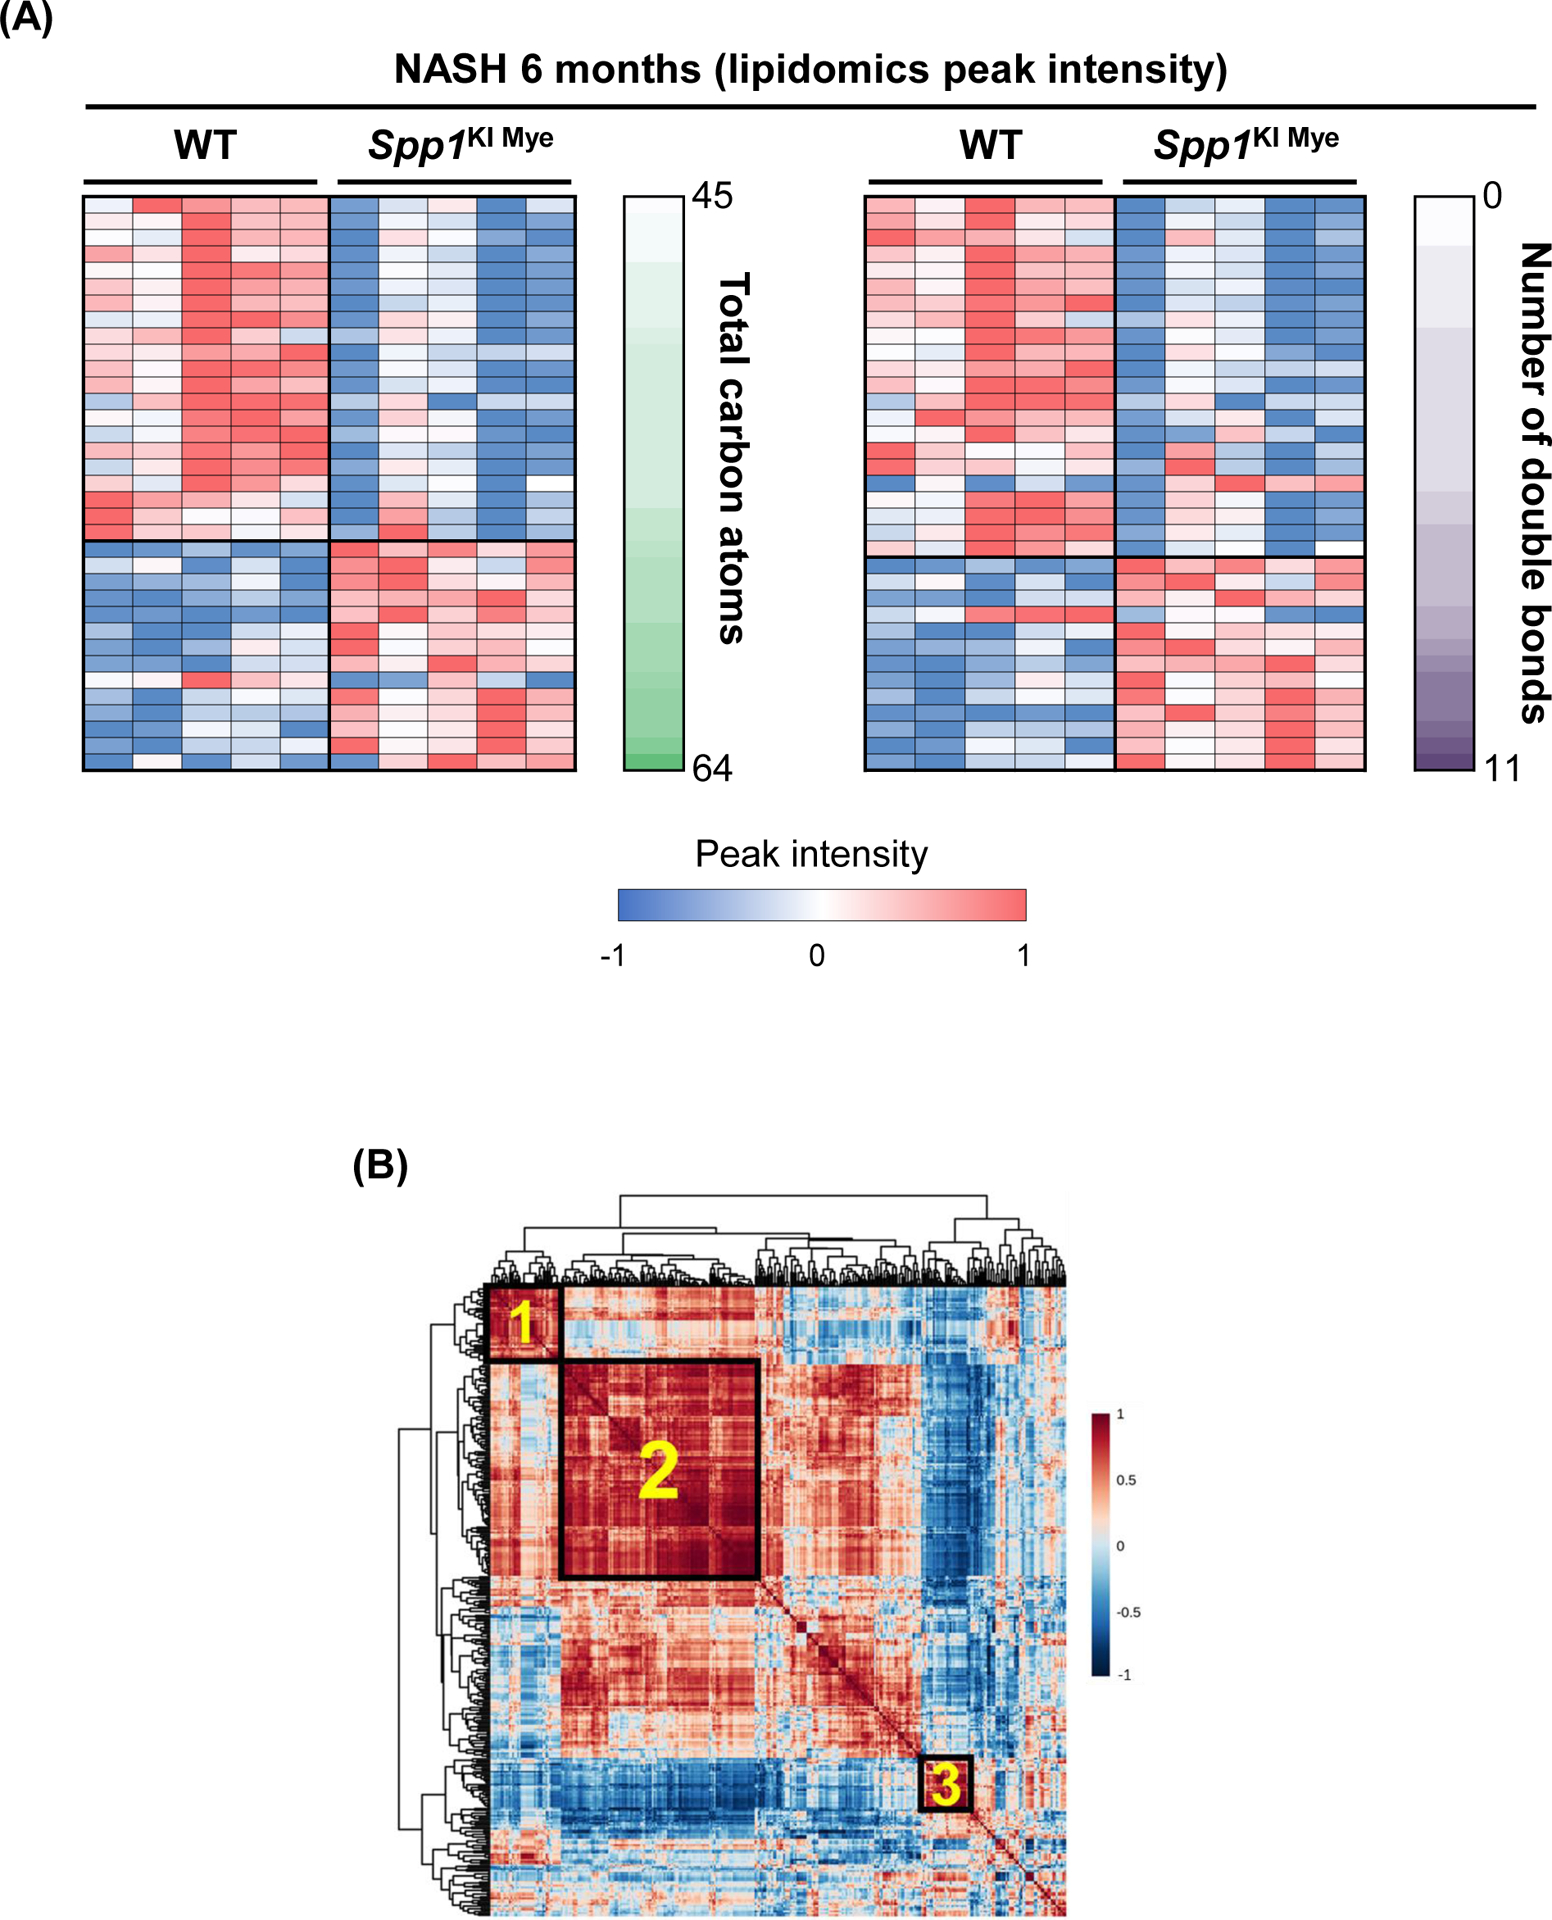
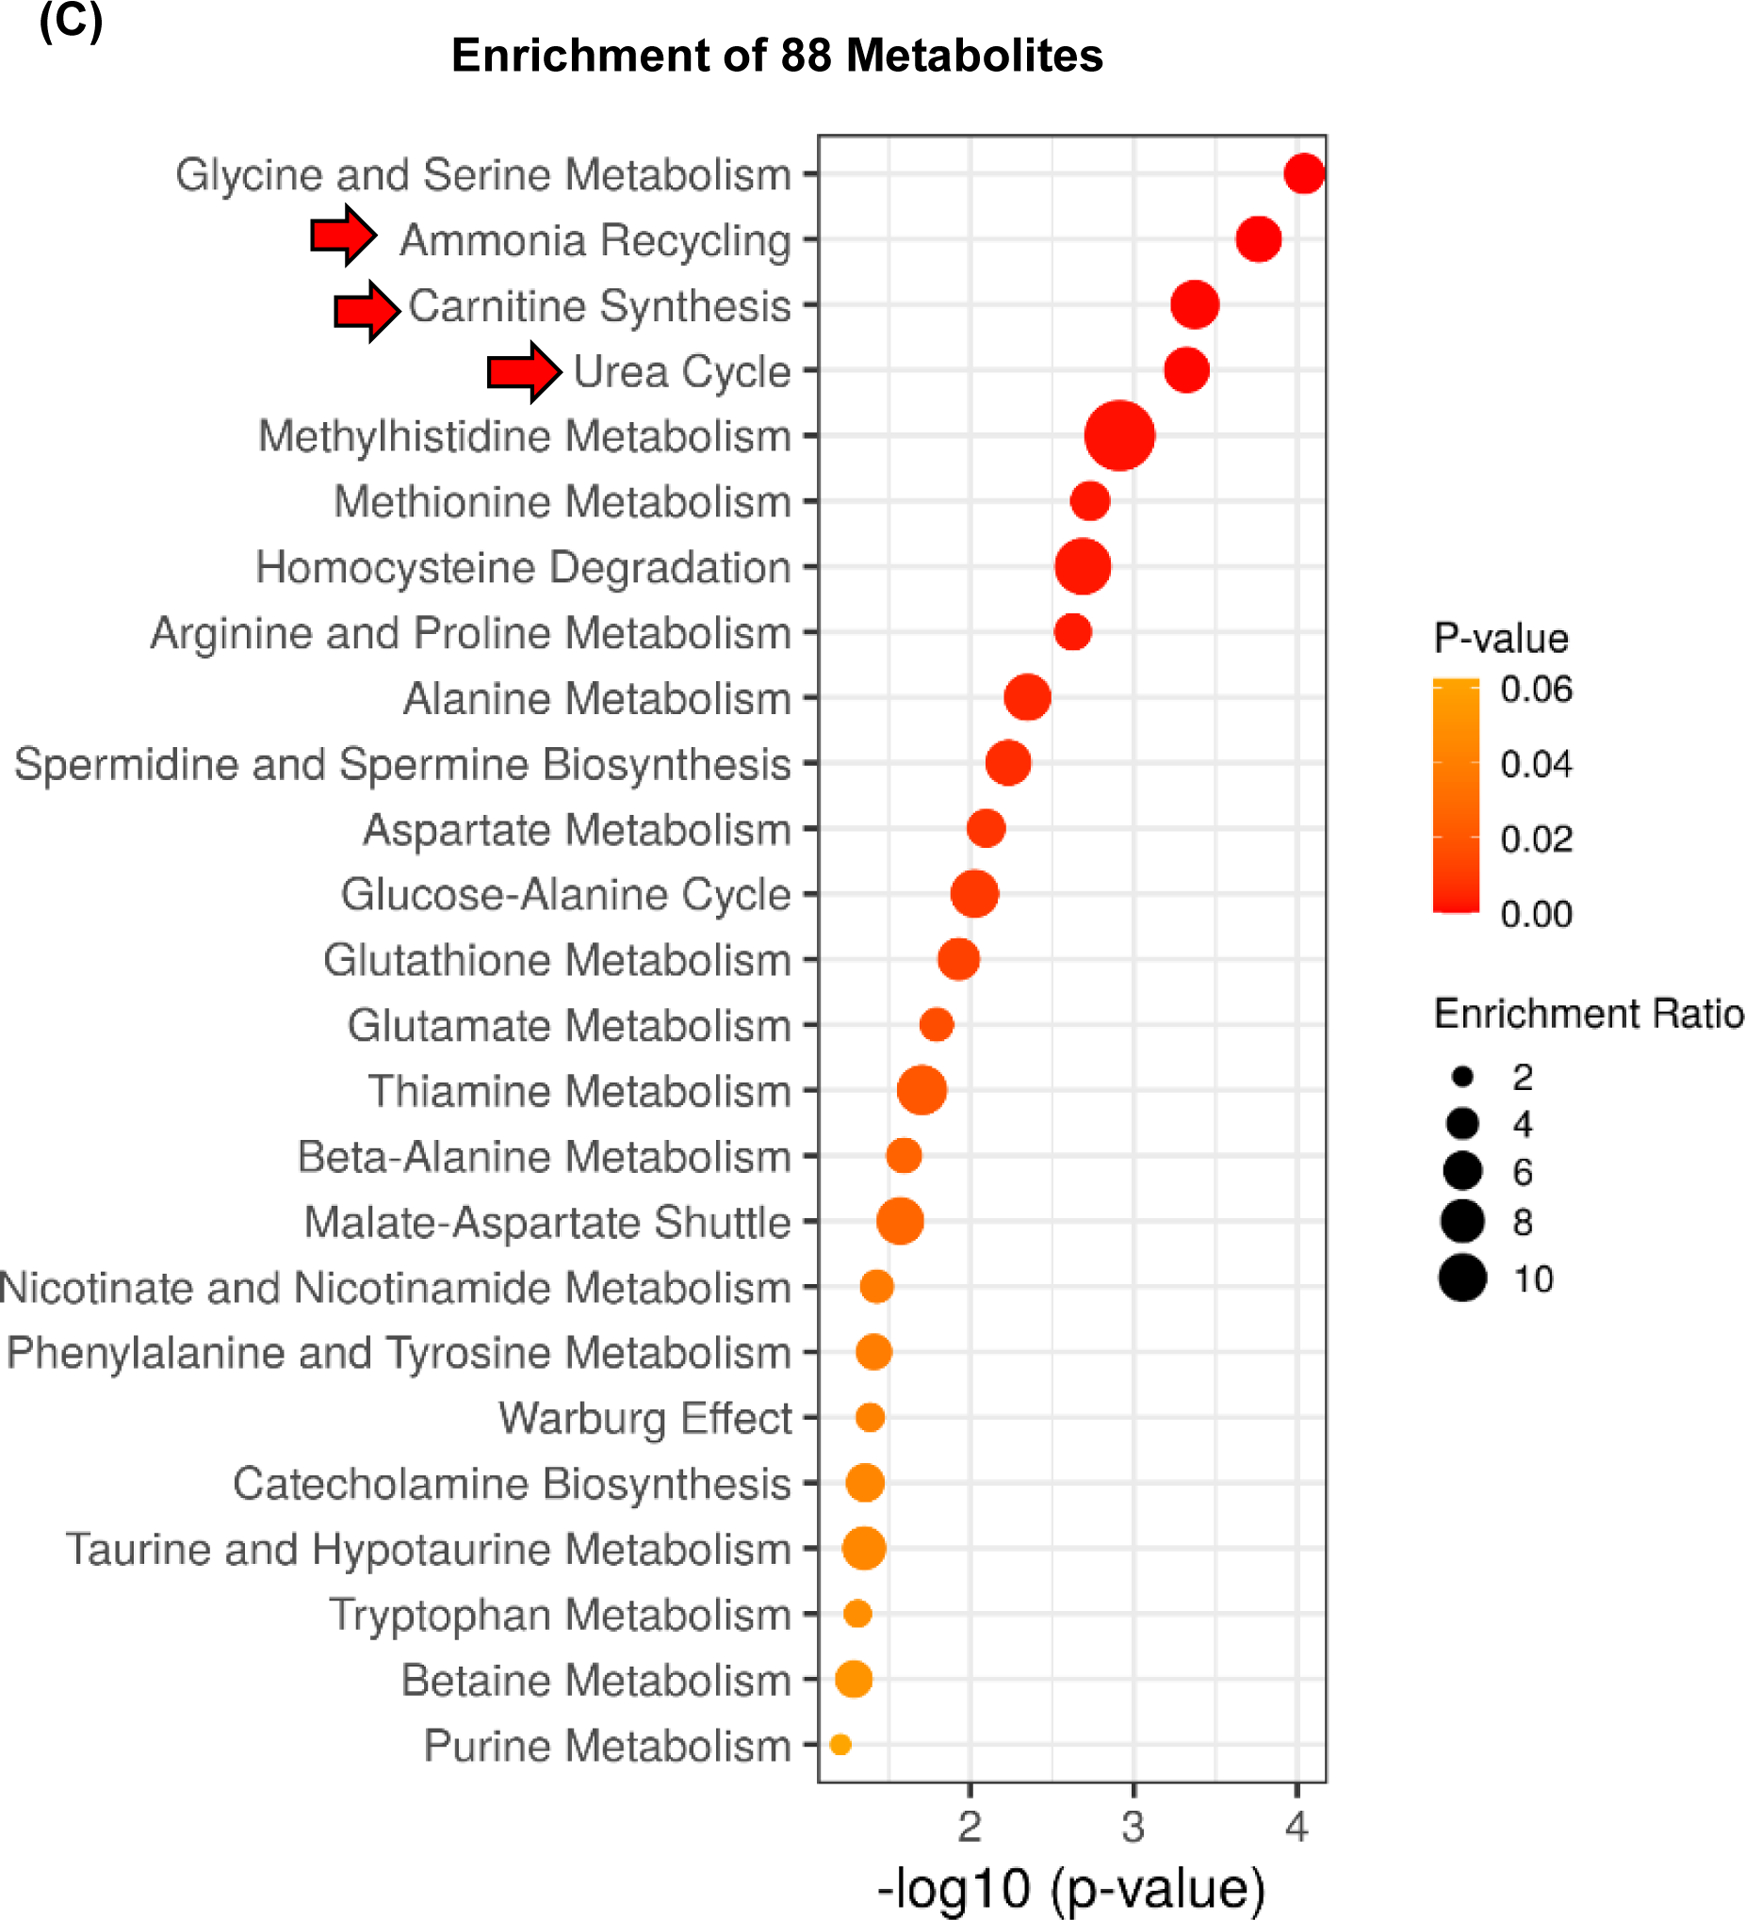
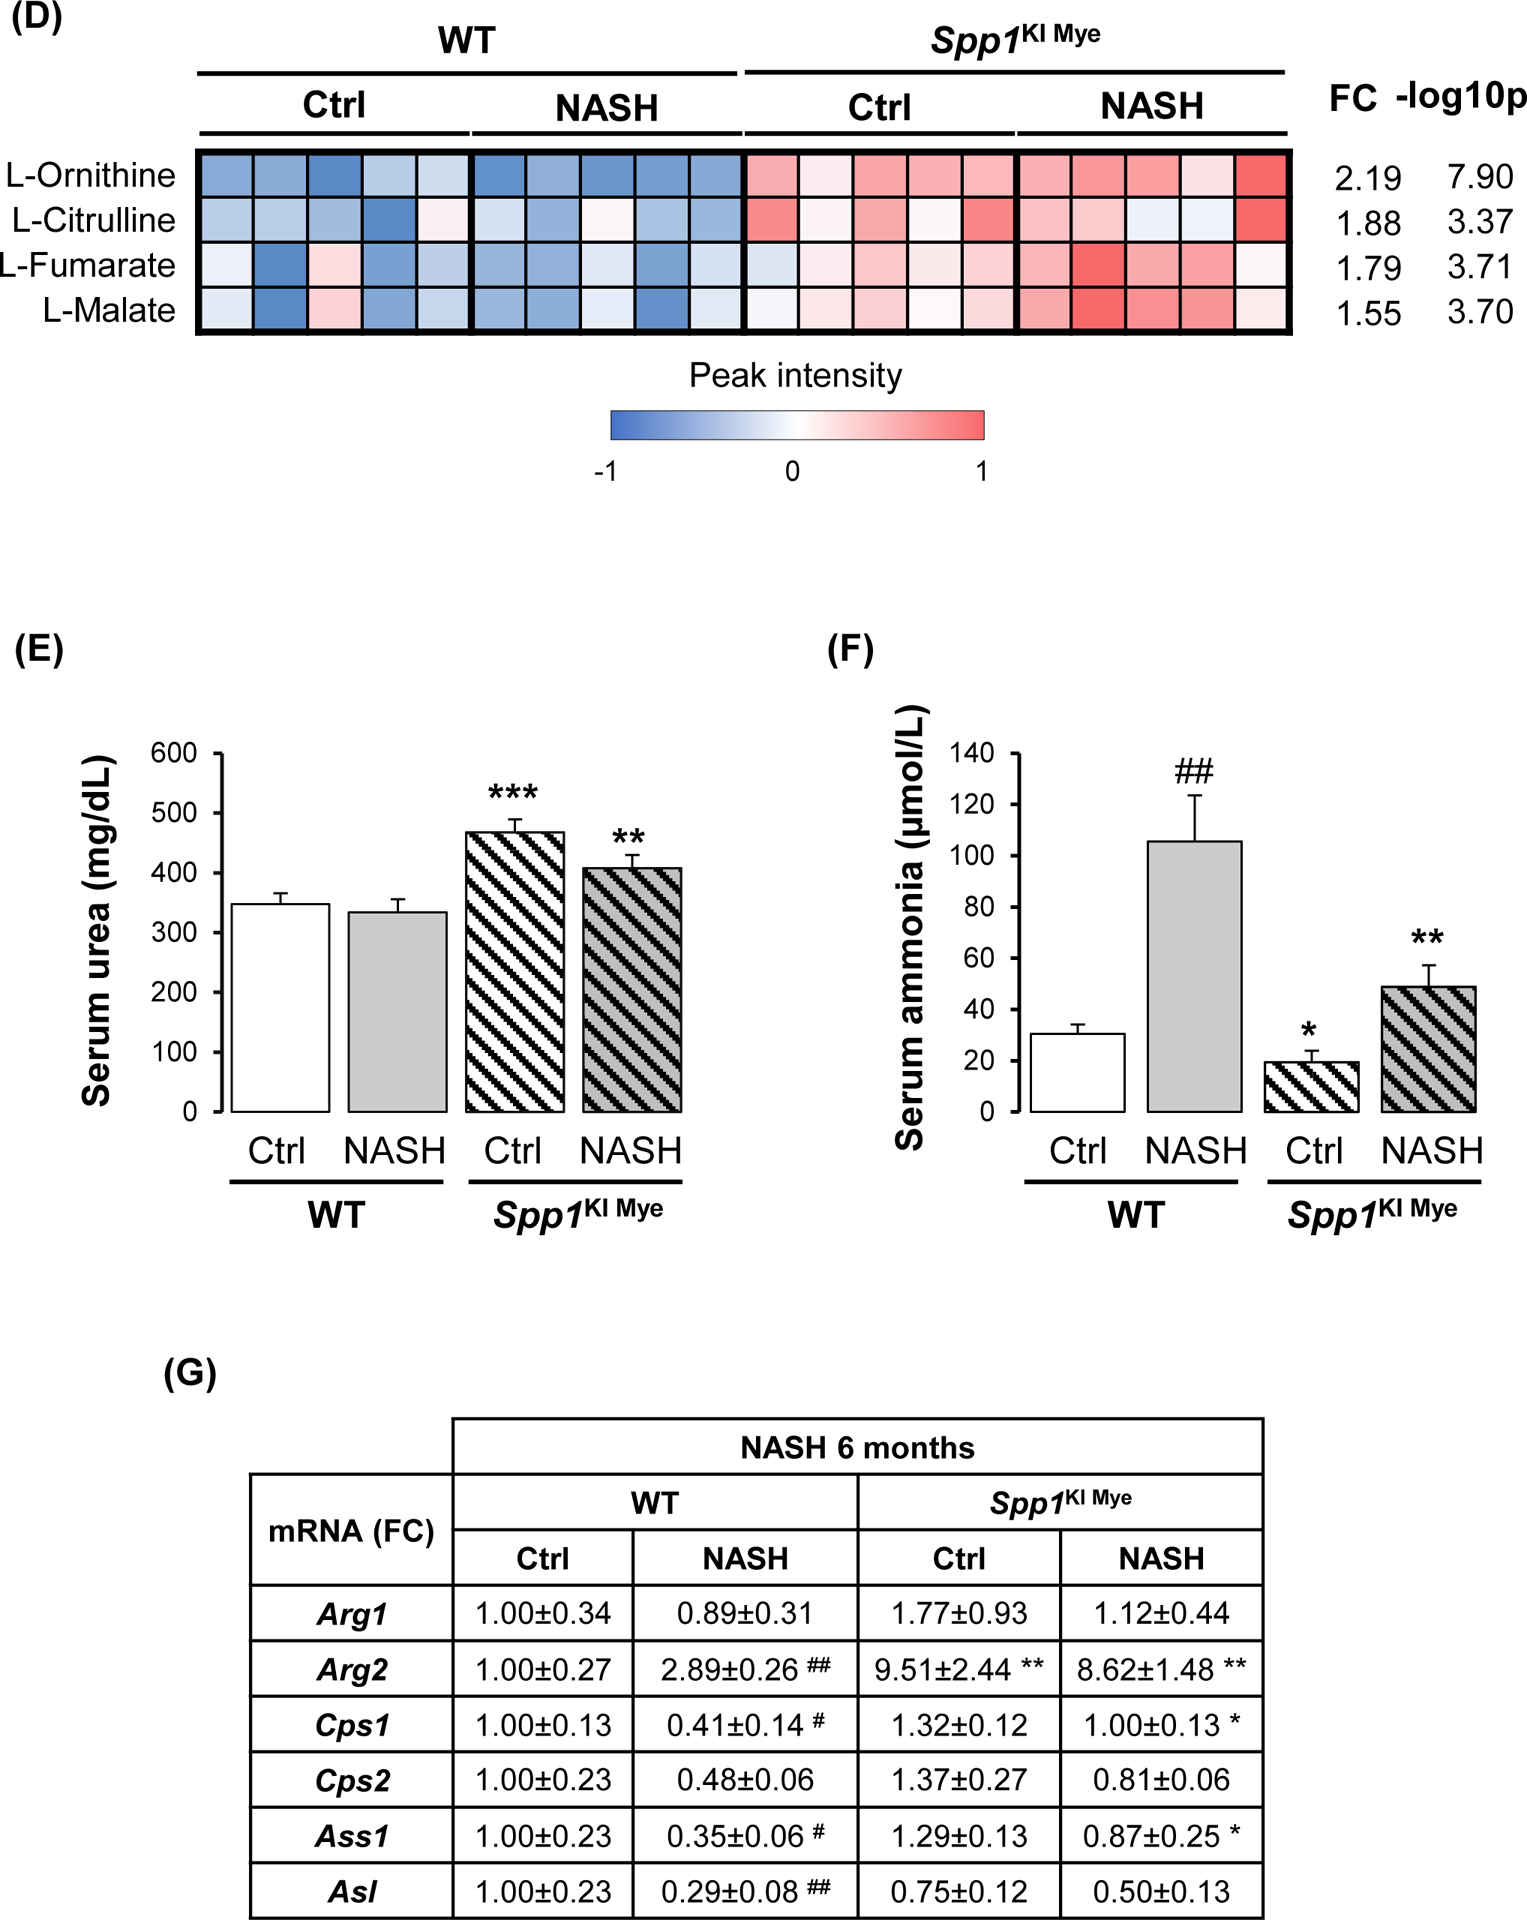
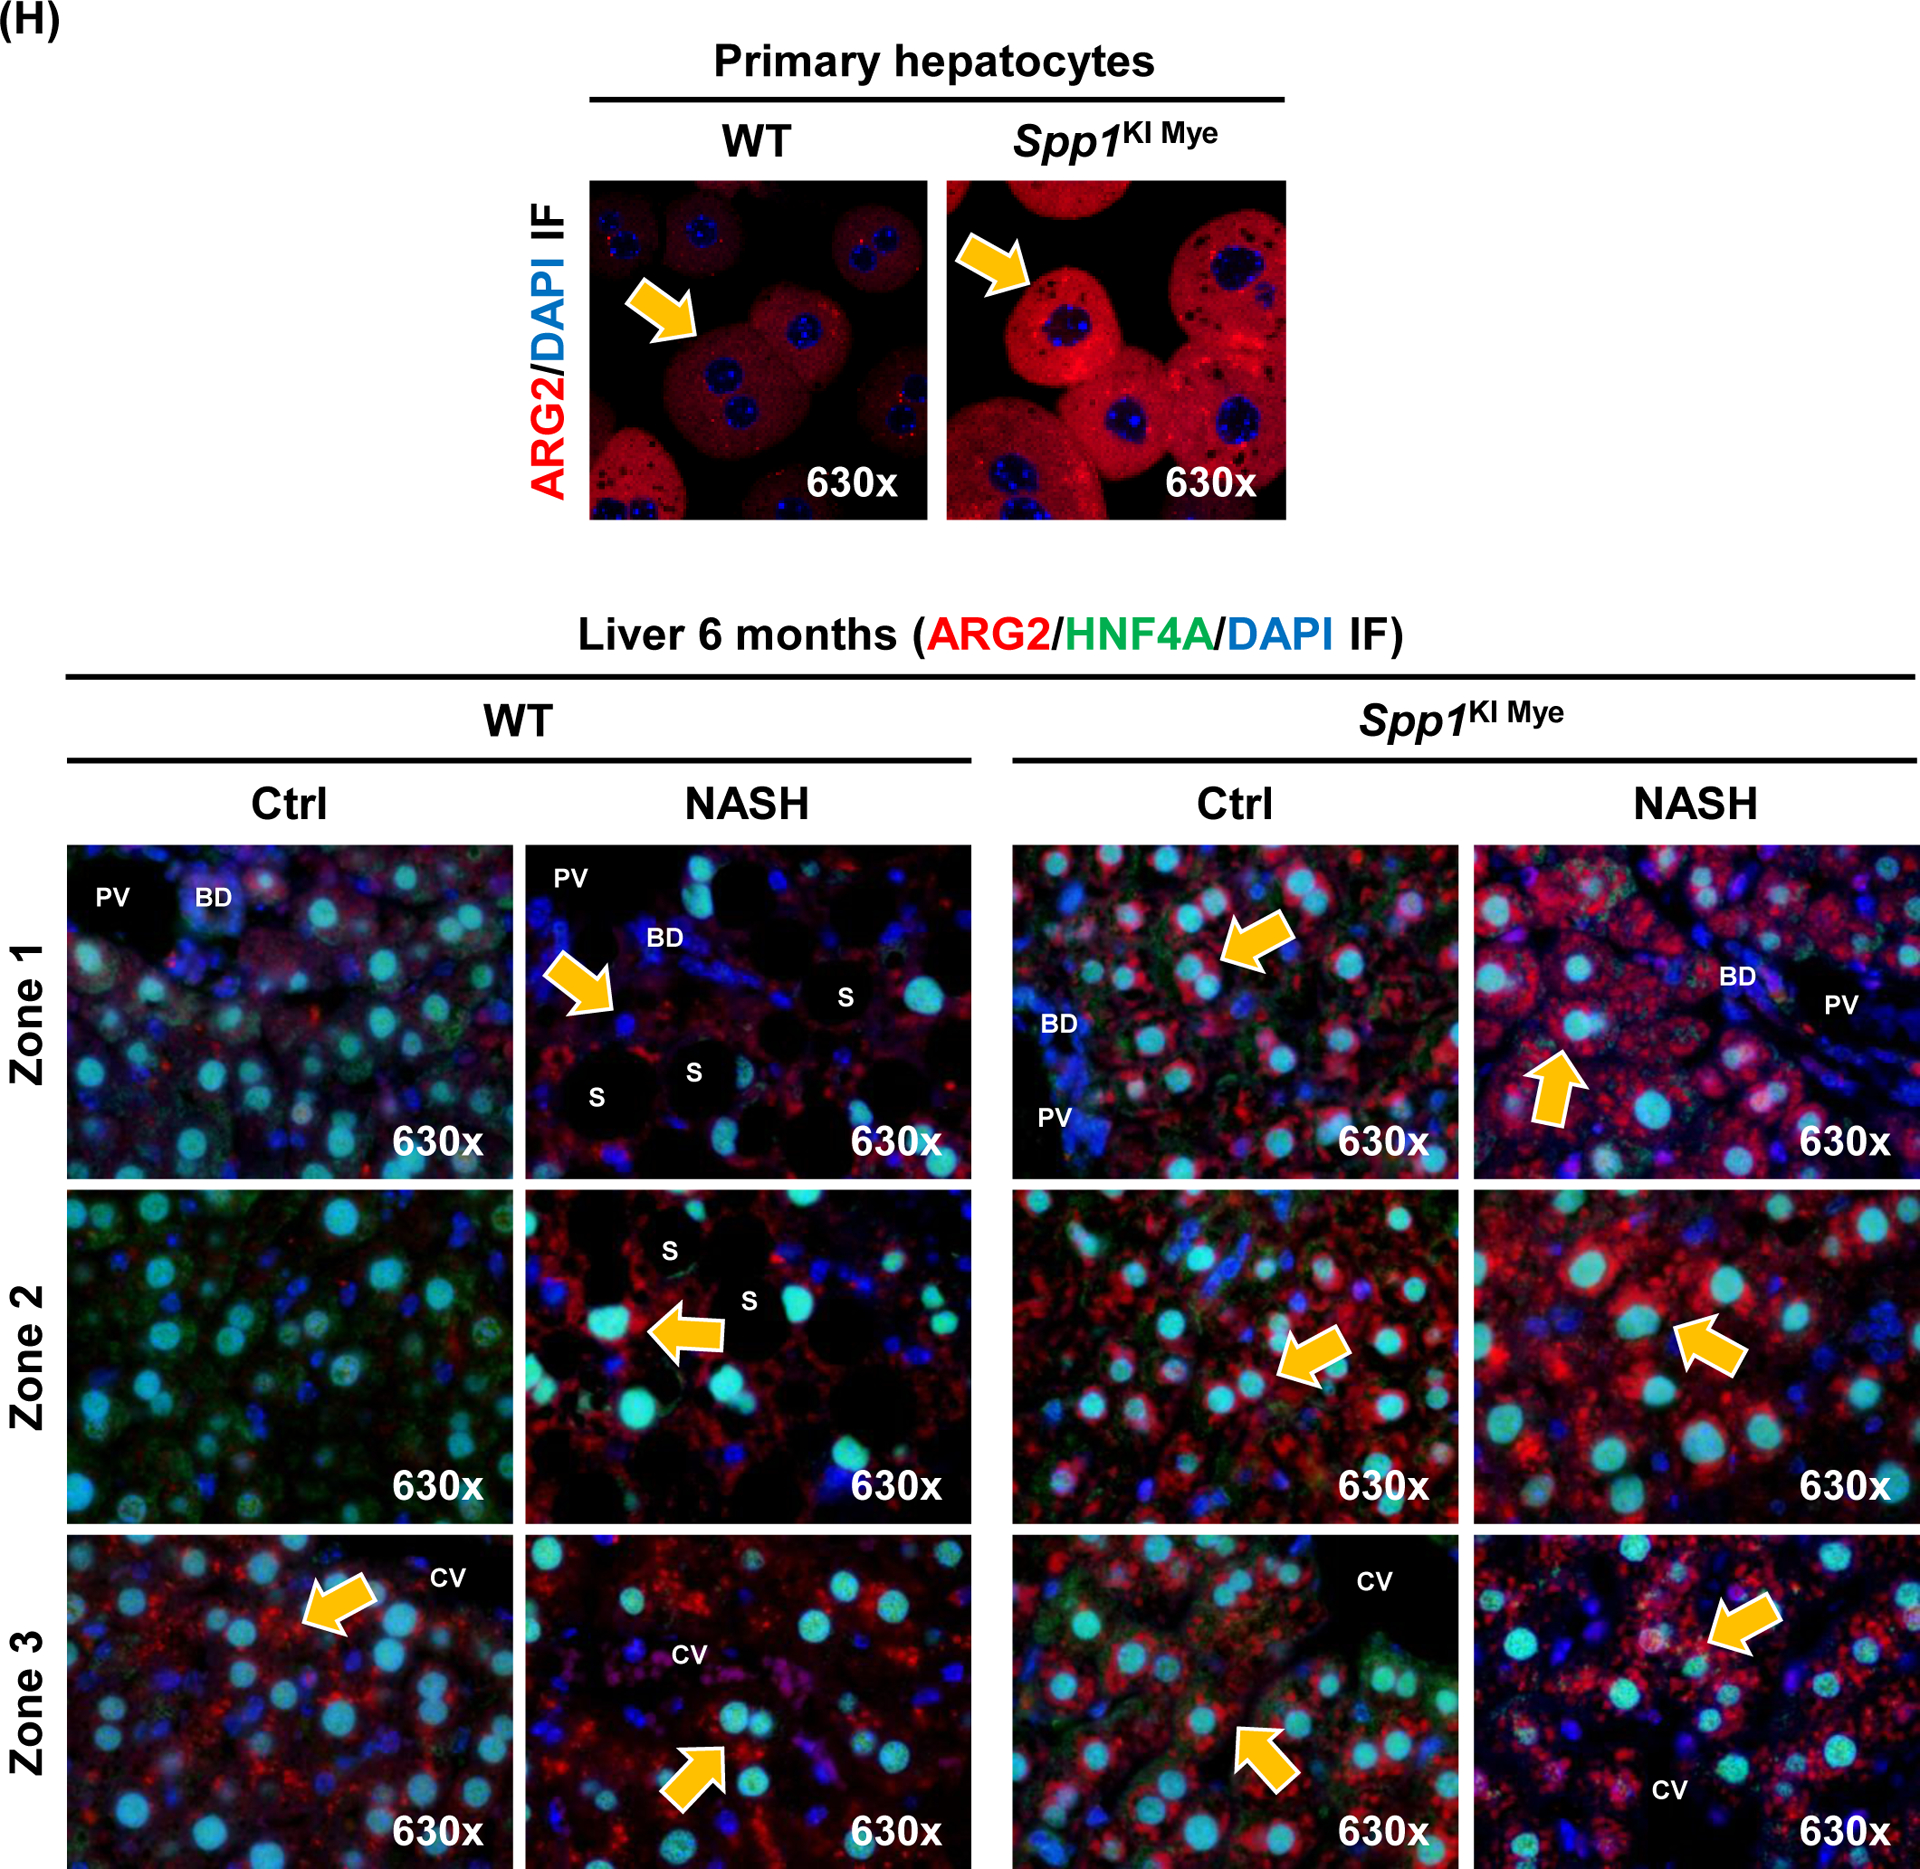
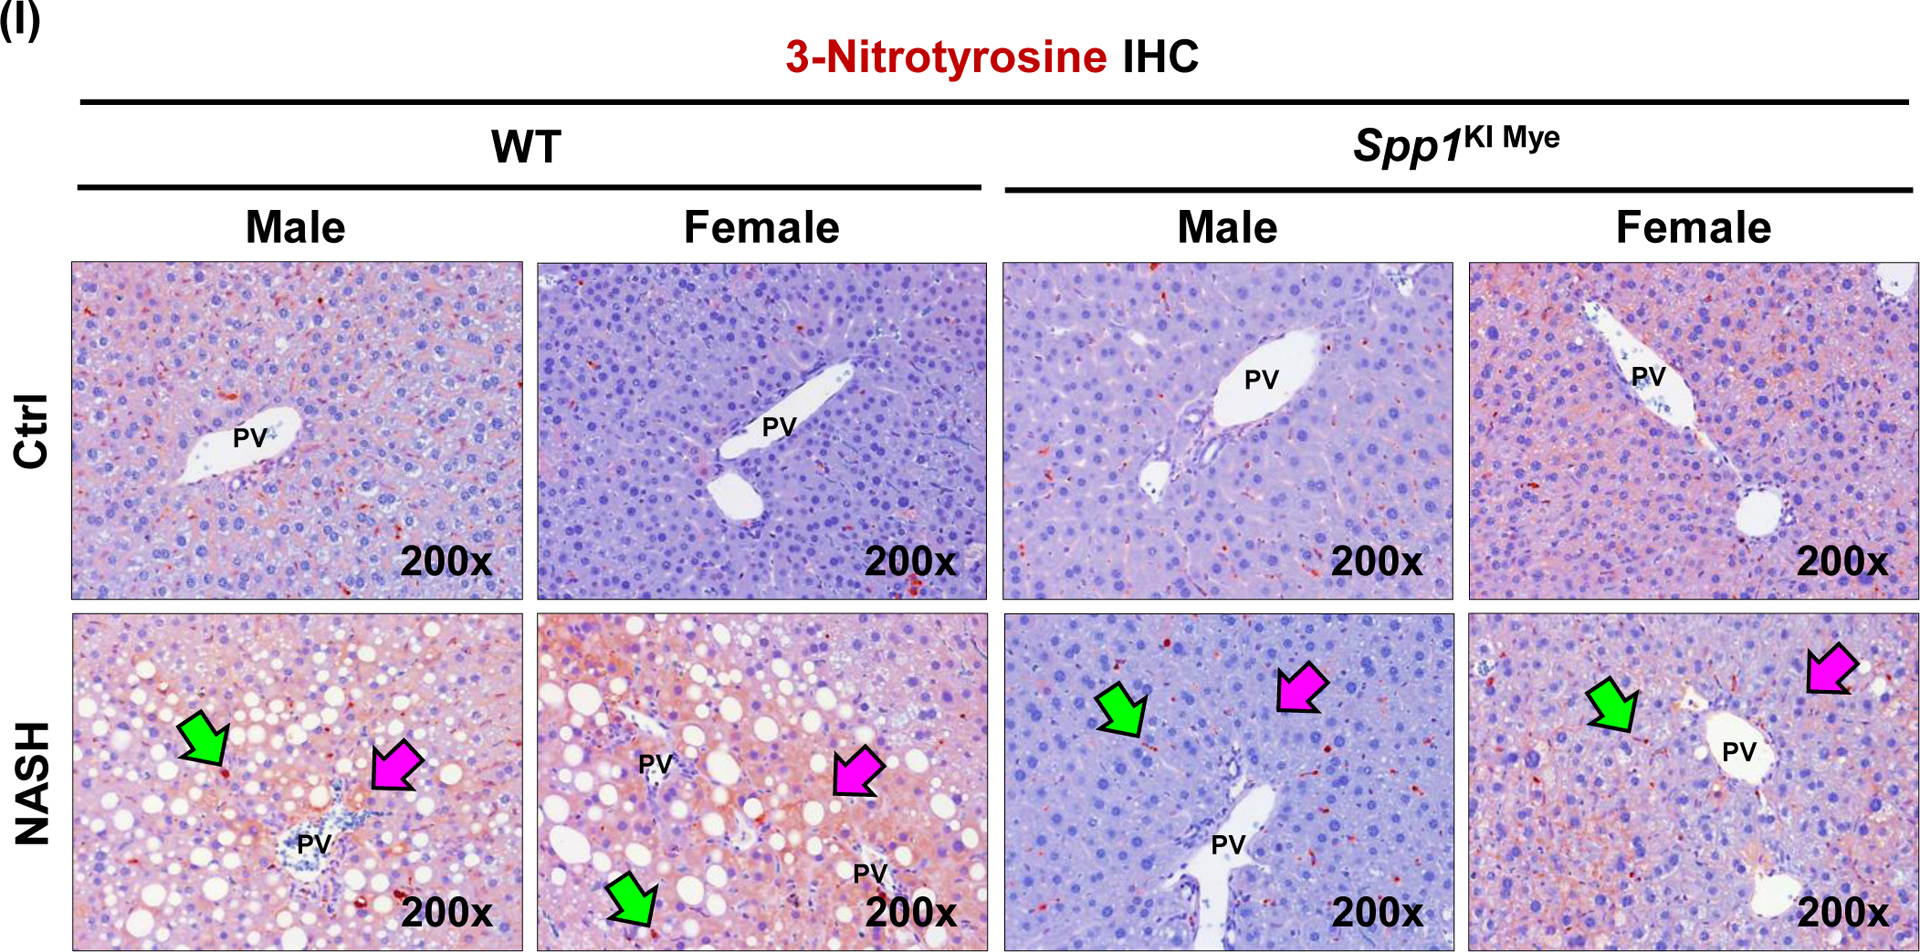
Spp1KI Mye and WT mice were fed for 6 months with control or NASH-inducing diet. Untargeted metabolomics and lipidomics analyses of the liver were performed. (A) Heat map of significantly changed TG species. Peak intensities are ordered by total number of carbon atoms (left) and saturation state (right). (B) Correlation heat map for downregulated TGs (cluster 3) and other metabolites. (C) Pathway enrichment for metabolites significantly correlated with downregulated TGs in Spp1KI Mye mice fed NASH-inducing diet. (D) Peak intensity of intermediates of urea cycle. (E) Serum urea concentration. (F) Serum ammonia concentration. (G) Relative mRNA expression of urea cycle enzymes. (H) Immunofluorescent staining of ARG2 in primary hepatocytes from untreated mice (top). Co-localization of ARG2 and HNF4A by zone in liver sections from Spp1KI Mye and WT mice fed control and NASH-inducing diet (CV, central vein; PV, portal vein; BD, bile duct; S, steatosis). (I) IHC of 3-NT (pink arrows: hepatocytes; green arrows: non-parenchymal cells). Results are expressed as mean ± SEM; n≥6/group. #p<0.05 and ##p<0.01 vs. control with same genotype; *p<0.05, **p<0.01 and ***p<0.001 vs. WT with same diet.
Reduced TGs correlate with upregulation of urea cycle, due to increased arginase-2 (ARG2) expression in hepatocytes.
Next, correlation analysis revealed that a cluster of 88 metabolites (Fig. 3B, cluster 2) had high negative correlation (average r>0.7) with the significantly reduced TGs (Fig. 3B, cluster 3). Enrichment of the 88 metabolites by the Small Molecule Pathway Database, suggested upregulation of ammonia recycling, carnitine synthesis and urea cycle (Fig. 3C). Indeed, urea cycle metabolites (L-ornithine, L-citrulline, L-fumarate) and downstream L-malate, were significantly upregulated regardless of diet, in liver from Spp1KI Mye mice (Fig. 3D). This was confirmed by increased urea and reduced ammonia in serum (Fig. 3E, F). qPCR revealed that Arg2, the mitochondrial isoform of Arg, increased regardless of diet, in liver from Spp1KI Mye, while urea cycle enzymes were minimally affected (Fig. 3G), and that expression of Arg2 decreased in liver from Spp1ΔMye mice (Fig. S5E). Immunofluorescence analysis revealed ARG2 induction in primary hepatocytes from Spp1KI Mye mice (Fig. 3H top). Likewise, co-localization studies further demonstrated that in WT mice fed control diet, ARG2 was mainly expressed in hepatocytes from zone 3, while in NASH it increased in hepatocytes from zones 1 and 2. Notably, in Spp1KI Mye mice, upregulation of ARG2 in hepatocytes was pan-lobular (Fig. 3H bottom). Accordingly, the presence of 3-nitrotyrosine (3-NT) residues, a post-translational modification triggered by excess NO generated from conversion of arginine to citrulline through NOS2, was primarily reduced in hepatocytes (Fig. 3I).
Upregulation of ARG2 mediates increased fatty acid oxidation in Spp1KI Mye mice.
Previous studies suggest that ARG2 regulates mitochondria dynamics and protects against hepatic steatosis23, 24. Metabolomics analysis revealed that components of the carnitine shuttle were significantly upregulated in liver from Spp1KI Mye mice (Fig. 4A). Fatty acid oxidation (FAO) is allosterically regulated by the NAD+/NADH ratio25. In total liver, the NAD+/NADH ratio and ATP levels were significantly increased in Spp1KI Mye, compared to WT mice (Fig. 4B, C). Mitotracker staining showed higher mitochondrial red fluorescence, but similar structure, in Spp1KI Mye compared to WT hepatocytes (Fig. 4D). When stained with JC-1, hepatocytes from Spp1KI Mye had increased JC-1 aggregate-to-monomer ratio compared to WT mice, suggesting higher mitochondrial membrane potential (Fig. 4E). To measure the effect on mitochondrial FAO, oxygen consumption rate (OCR) was monitored in hepatocytes treated with palmitic acid (PA). Hepatocytes from Spp1KI Mye minimally increased basal OCR, but increased ~2-fold maximal respiratory capacity (MRC) and ~3-fold spare respiratory capacity (SRC) compared to WT mice (Fig. 4F, S7A). ATP production was mildly increased in hepatocytes from Spp1KI Mye compared to WT mice treated with bovine serum albumin (BSA) and PA (Fig. 4F, S7A). Notably, proton leak, during which energy is dissipated without producing ATP, was significantly increased in hepatocytes from Spp1KI Mye compared to WT mice with BSA and PA (Fig. 4F, S7A).
Figure 4. Upregulation of ARG2 mediates increased FAO in Spp1KI Mye mice.
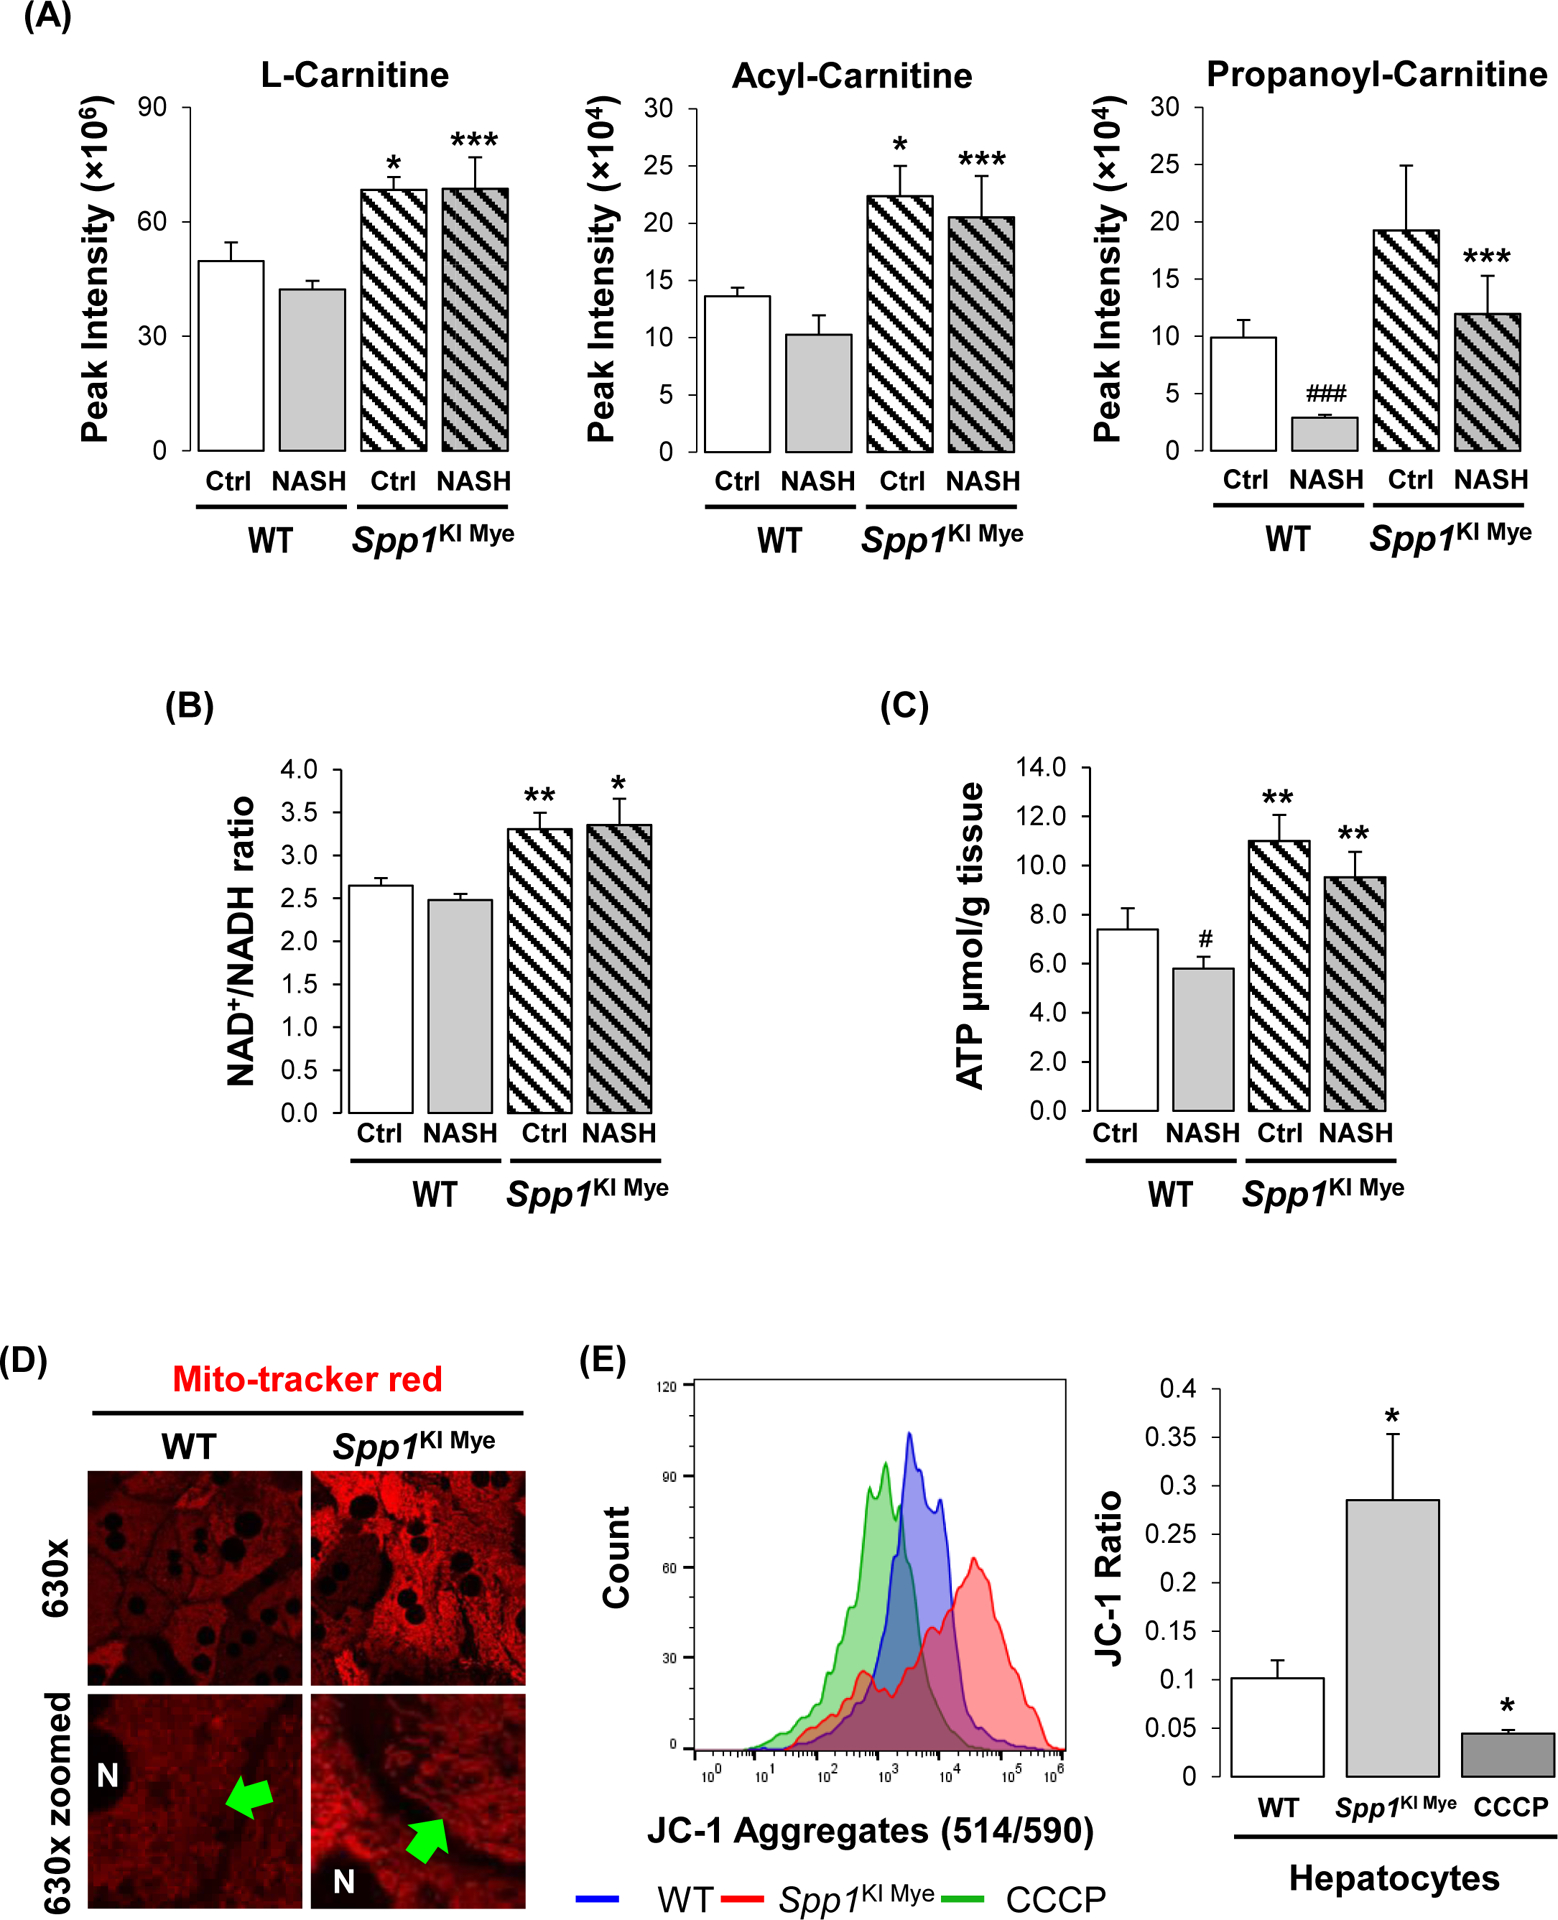
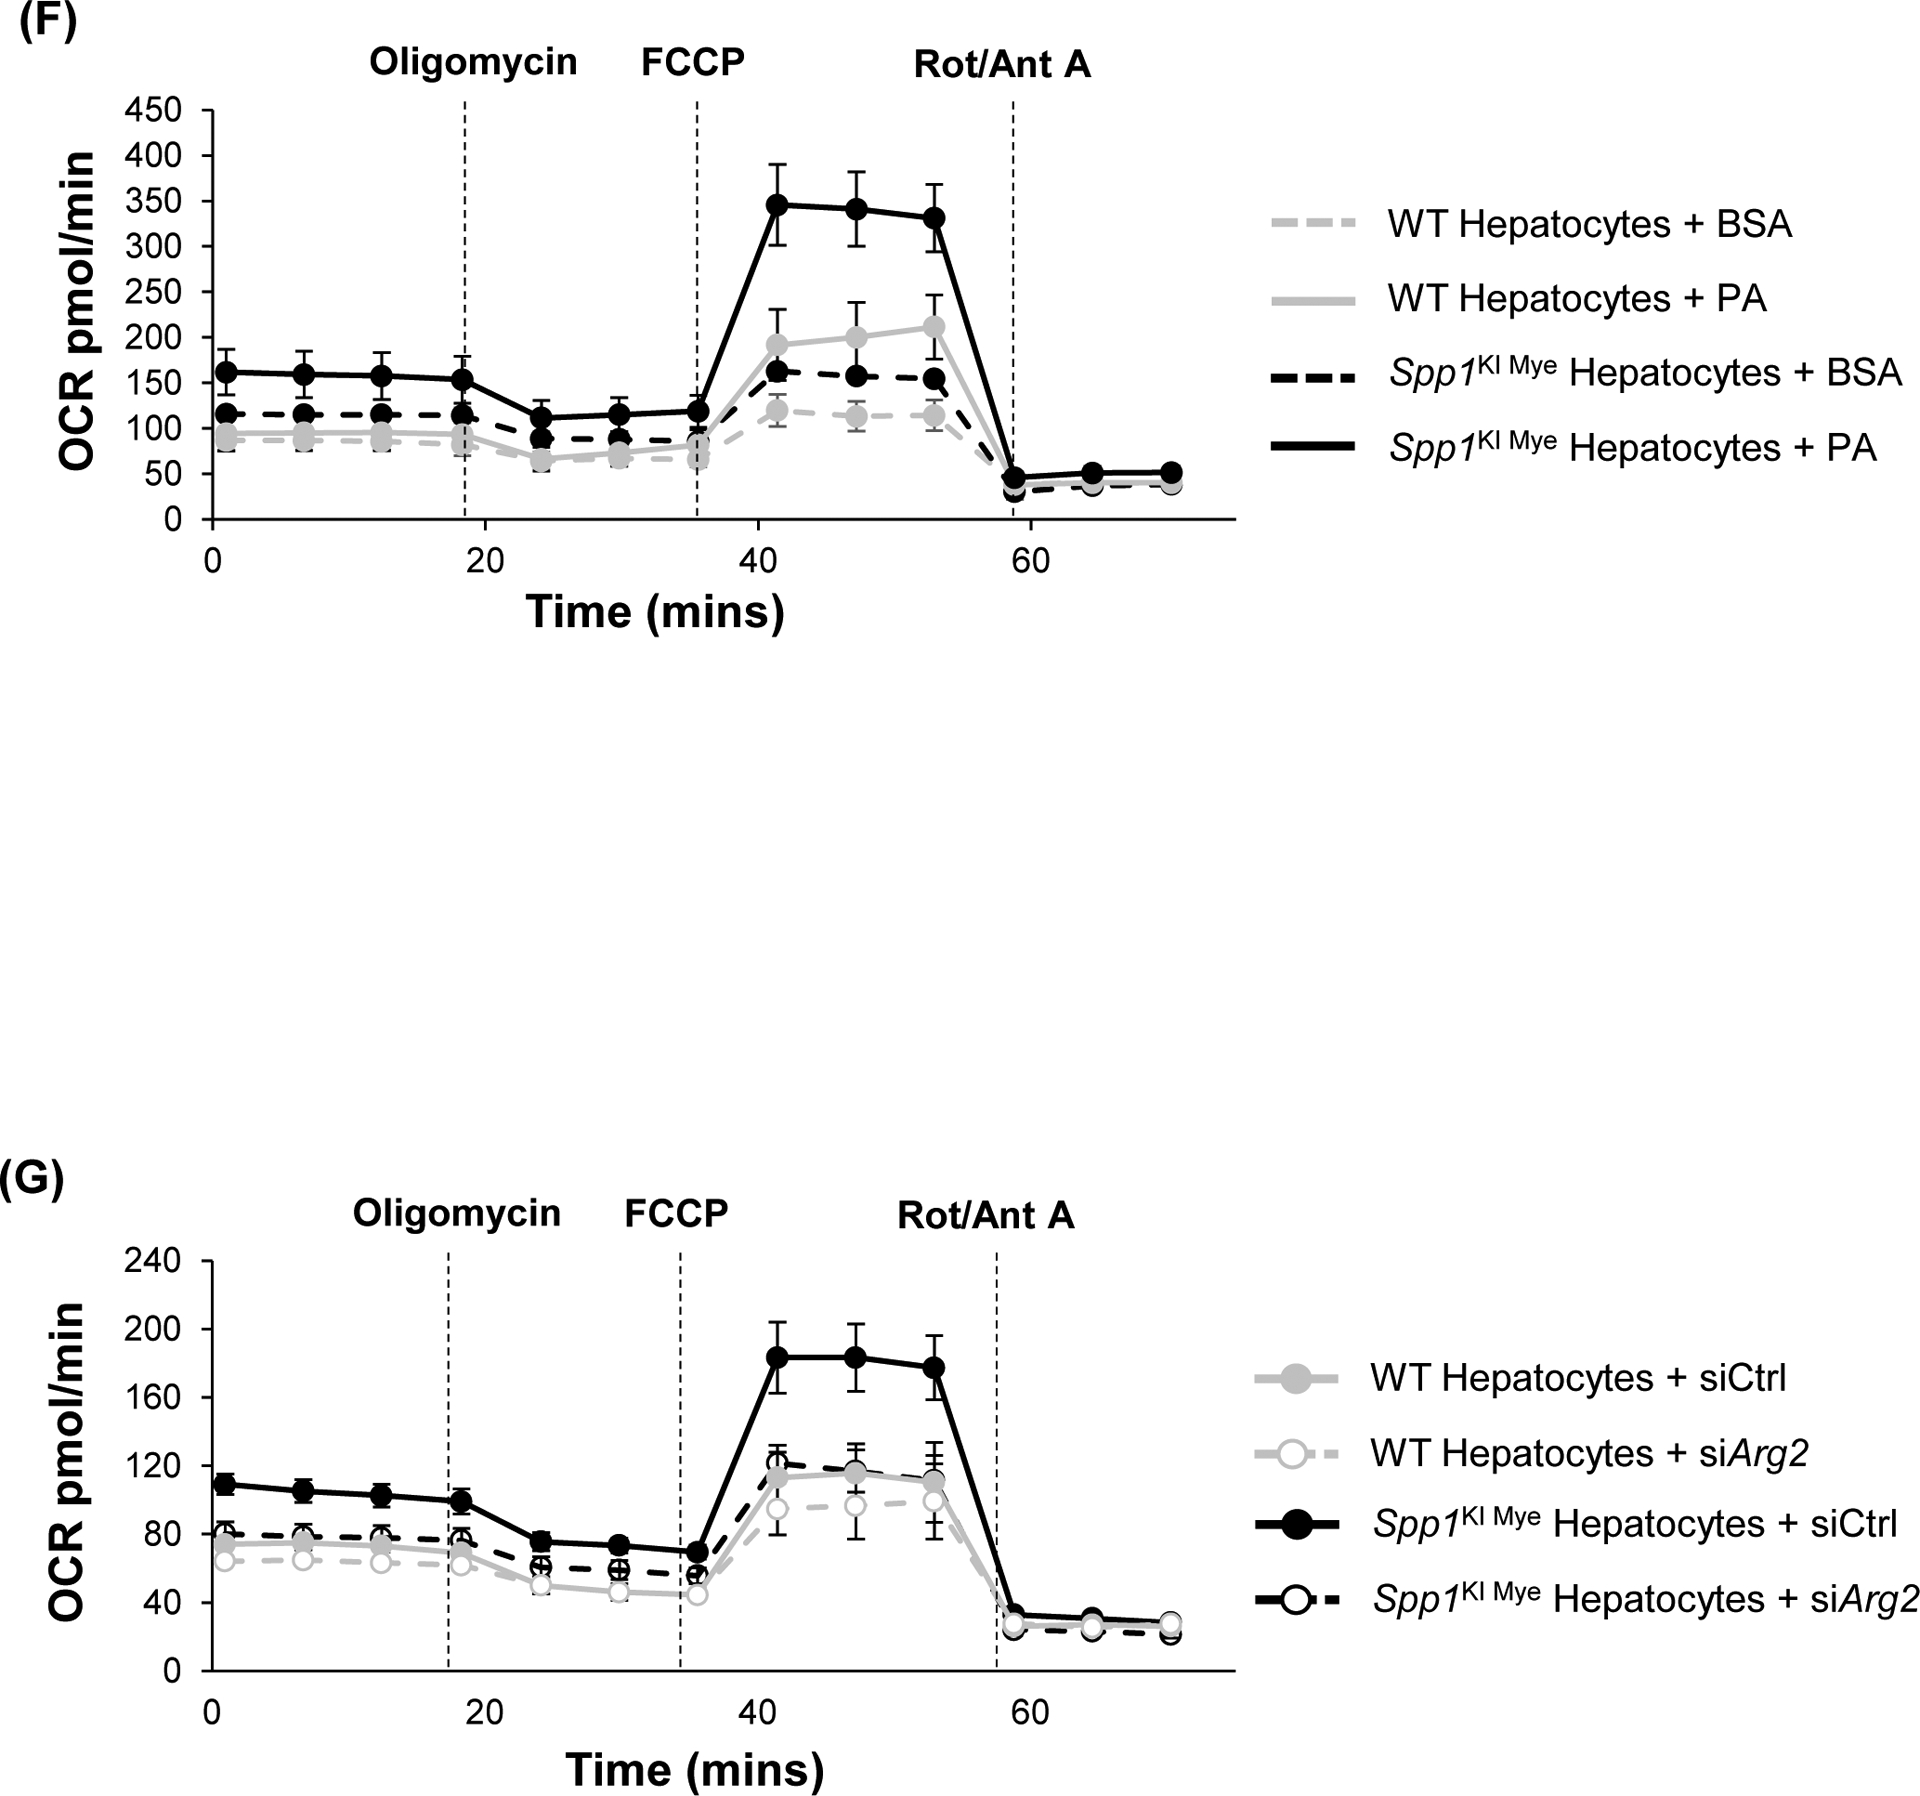
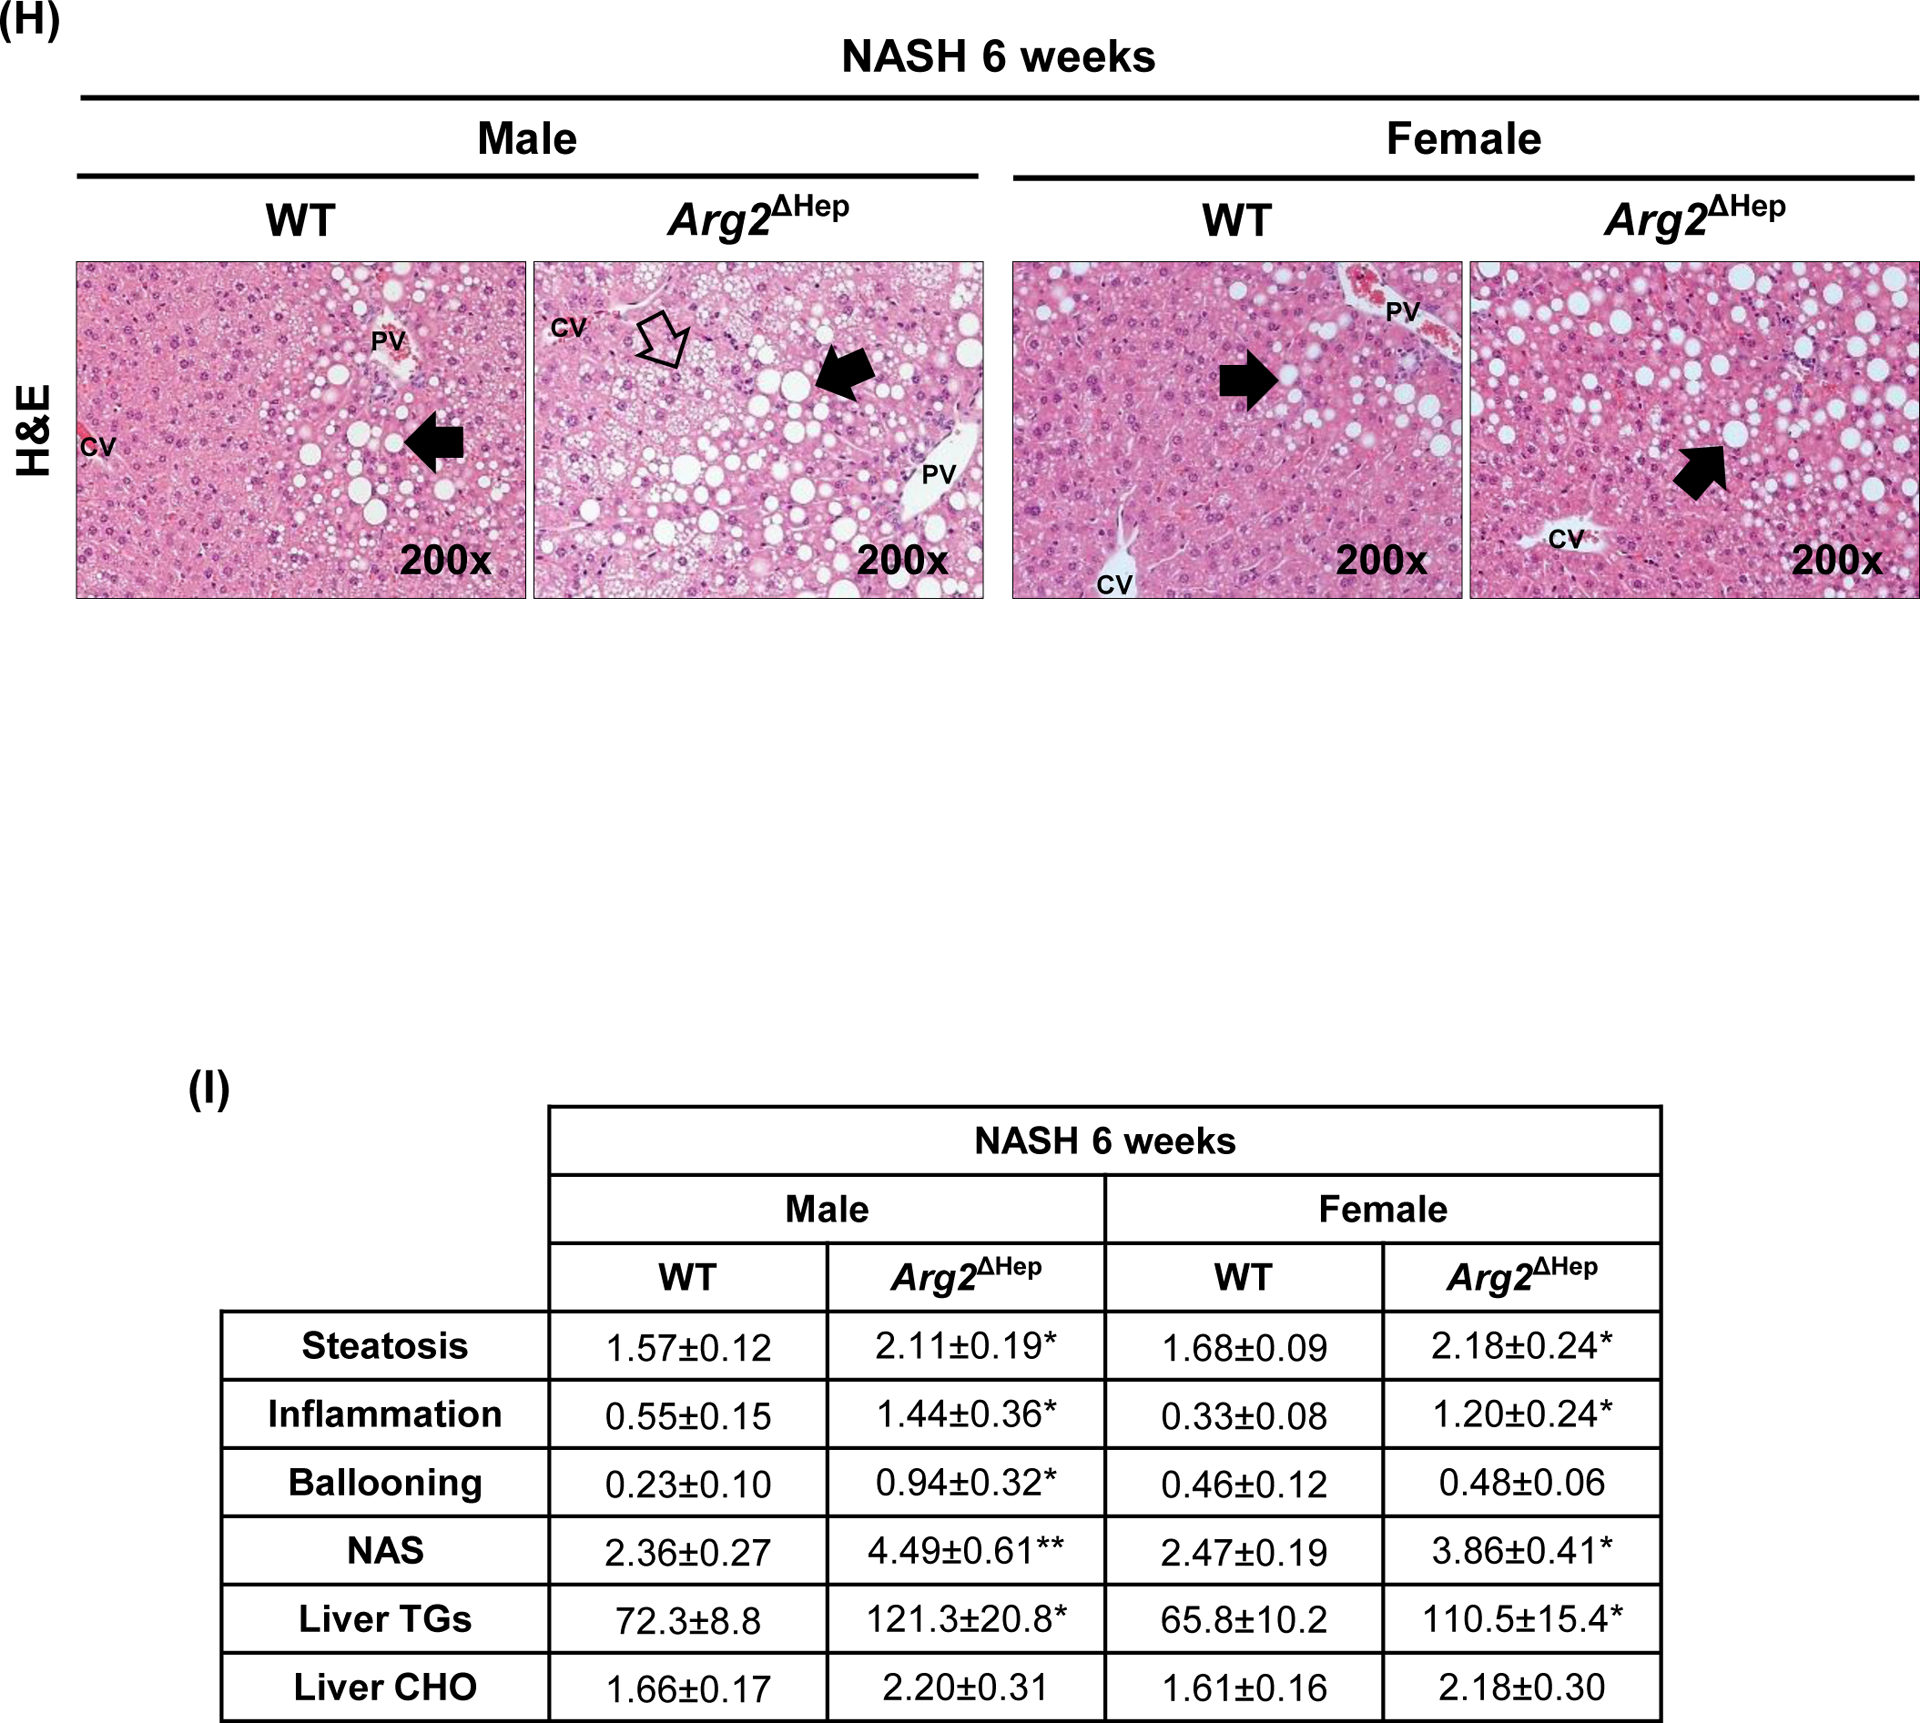
Spp1KI Mye and WT mice were fed for 6 months with control or NASH-inducing diet. (A) Peak intensities of carnitine shuttle metabolites (n=5/group/treatment). (B) NAD+/NADH ratio in total liver. (C) ATP production in total liver. (D) Morphology of mitochondria by staining with Mito-tracker red (green arrows: fine structures of mitochondria). (E) Histogram of JC-1 aggregates (left) and quantification of their ratio with JC-1 monomers (right) (n=5/group). (F) Representative OCR curve in primary hepatocytes from all groups of mice. (G) Representative OCR curve in primary hepatocytes from various genotypes transfected with siCtrl or siArg2. (H) Arg2ΔHep and WT mice were fed for 6 weeks with control or NASH-inducing diet. H&E staining of the liver (black arrows: macrovesicular steatosis; black open arrows: microvesicular steatosis). (I) Individual scores, NAS, liver TGs and CHO normalized by protein (n=5–6/group). Results are expressed as mean ± SEM. *p<0.05, **p<0.01 and ***p<0.001 vs. WT with same diet.
To determine if Arg2 mediated FAO increase in hepatocytes from Spp1KI Mye mice, we used siRNA to knock-down Arg2, which was reduced by >90%, without affecting cell viability (Fig. S7B–C). Measurement of OCR revealed that Arg2 knock-down significantly dampened MRC, SRC and proton leak (Fig. 4G, S7D). Further, WT treated with PA overnight, had more lipid droplets compared to Spp1KI Mye hepatocytes, but it was reversed with Arg2 siRNA (Fig. S7E). Thus, upregulation of ARG2 in hepatocytes reduces lipid accumulation by increasing mitochondrial respiration and FAO. To further demonstrate role of ARG2 in NASH, we generated mice with conditional ablation of Arg2 in hepatocytes (Arg2ΔHep) and fed them NASH-inducing diet for 6 weeks. Both genders of Arg2ΔHep showed worse NASH, due to increased steatosis, inflammation and TG, than WT mice (Fig 4H–I, S7F).
Spp1KI Mye and feeding NASH-inducing diet drive the sex-specific transcriptome in MFs.
To understand if Spp1KI Mye drove a particular phenotype in liver resident MFs, they were sorted from Spp1KI Mye and WT mice, fed control or NASH-inducing diet for 6 months, and subjected to transcriptome analysis by RNAseq. An unreported gender difference in the MF transcriptome was observed in WT mice with NASH compared to controls (see Supplementary Information).
Spp1KI Mye male mice fed control diet had 362 DE genes (289 upregulated, 73 downregulated) compared to WT, but most showed only mild changes (FC<2). The DE genes increased to 822 (736 upregulated, 86 downregulated) in Spp1KI Mye fed NASH-inducing diet compared to WT mice (Table S4). However, there were few overlapping DE genes between mice fed control or NASH-inducing diet (5 upregulated, 1 downregulated) (Fig. 5A). Pathway analysis indicated that DE genes from control diet groups were enriched for pathways involved in tissue remodeling (VEGF signaling, hepatic fibrosis, thrombin, G6P signaling) based on positive Z-scores (Fig. 5B). Some inflammatory pathways were upregulated, while IL-6 and TREM1 signaling were downregulated (Fig. 5B). Lipid metabolism was minimally affected (Fig. 5B). Notably STAT3 and JAK/STAT signaling were upregulated (Fig. 5B). Stronger changes related to tissue remodeling were observed in groups fed NASH-inducing diet, reflected by upregulation of collagens, fibrinogen and coagulation factors (Fig. 5B, C). In mice fed NASH-inducing diet, inflammation was minimally affected by Spp1KI Mye (Fig. 5B). However, there was upregulation of Il1rn, Il10 and Tnf, while Ccl2, Il1b and Il6 were unaffected (Table S4). Moreover, Spp1KI Mye had strongly upregulated genes and pathways involved in lipid metabolism (LXR/RXR, TG degradation, FAO, PPARa/RXRa activation) (Fig. 5B, C). Notably, urea cycle was upregulated in Spp1KI Mye MFs, reflected by major increase in expression of Arg1, Cps1 and Otc, and moderate increase in Arg2 (Fig. 5B, C & Table S4).
Figure 5. Spp1KI Mye and feeding NASH-inducing diet drive the sex-specific transcriptome in MFs.
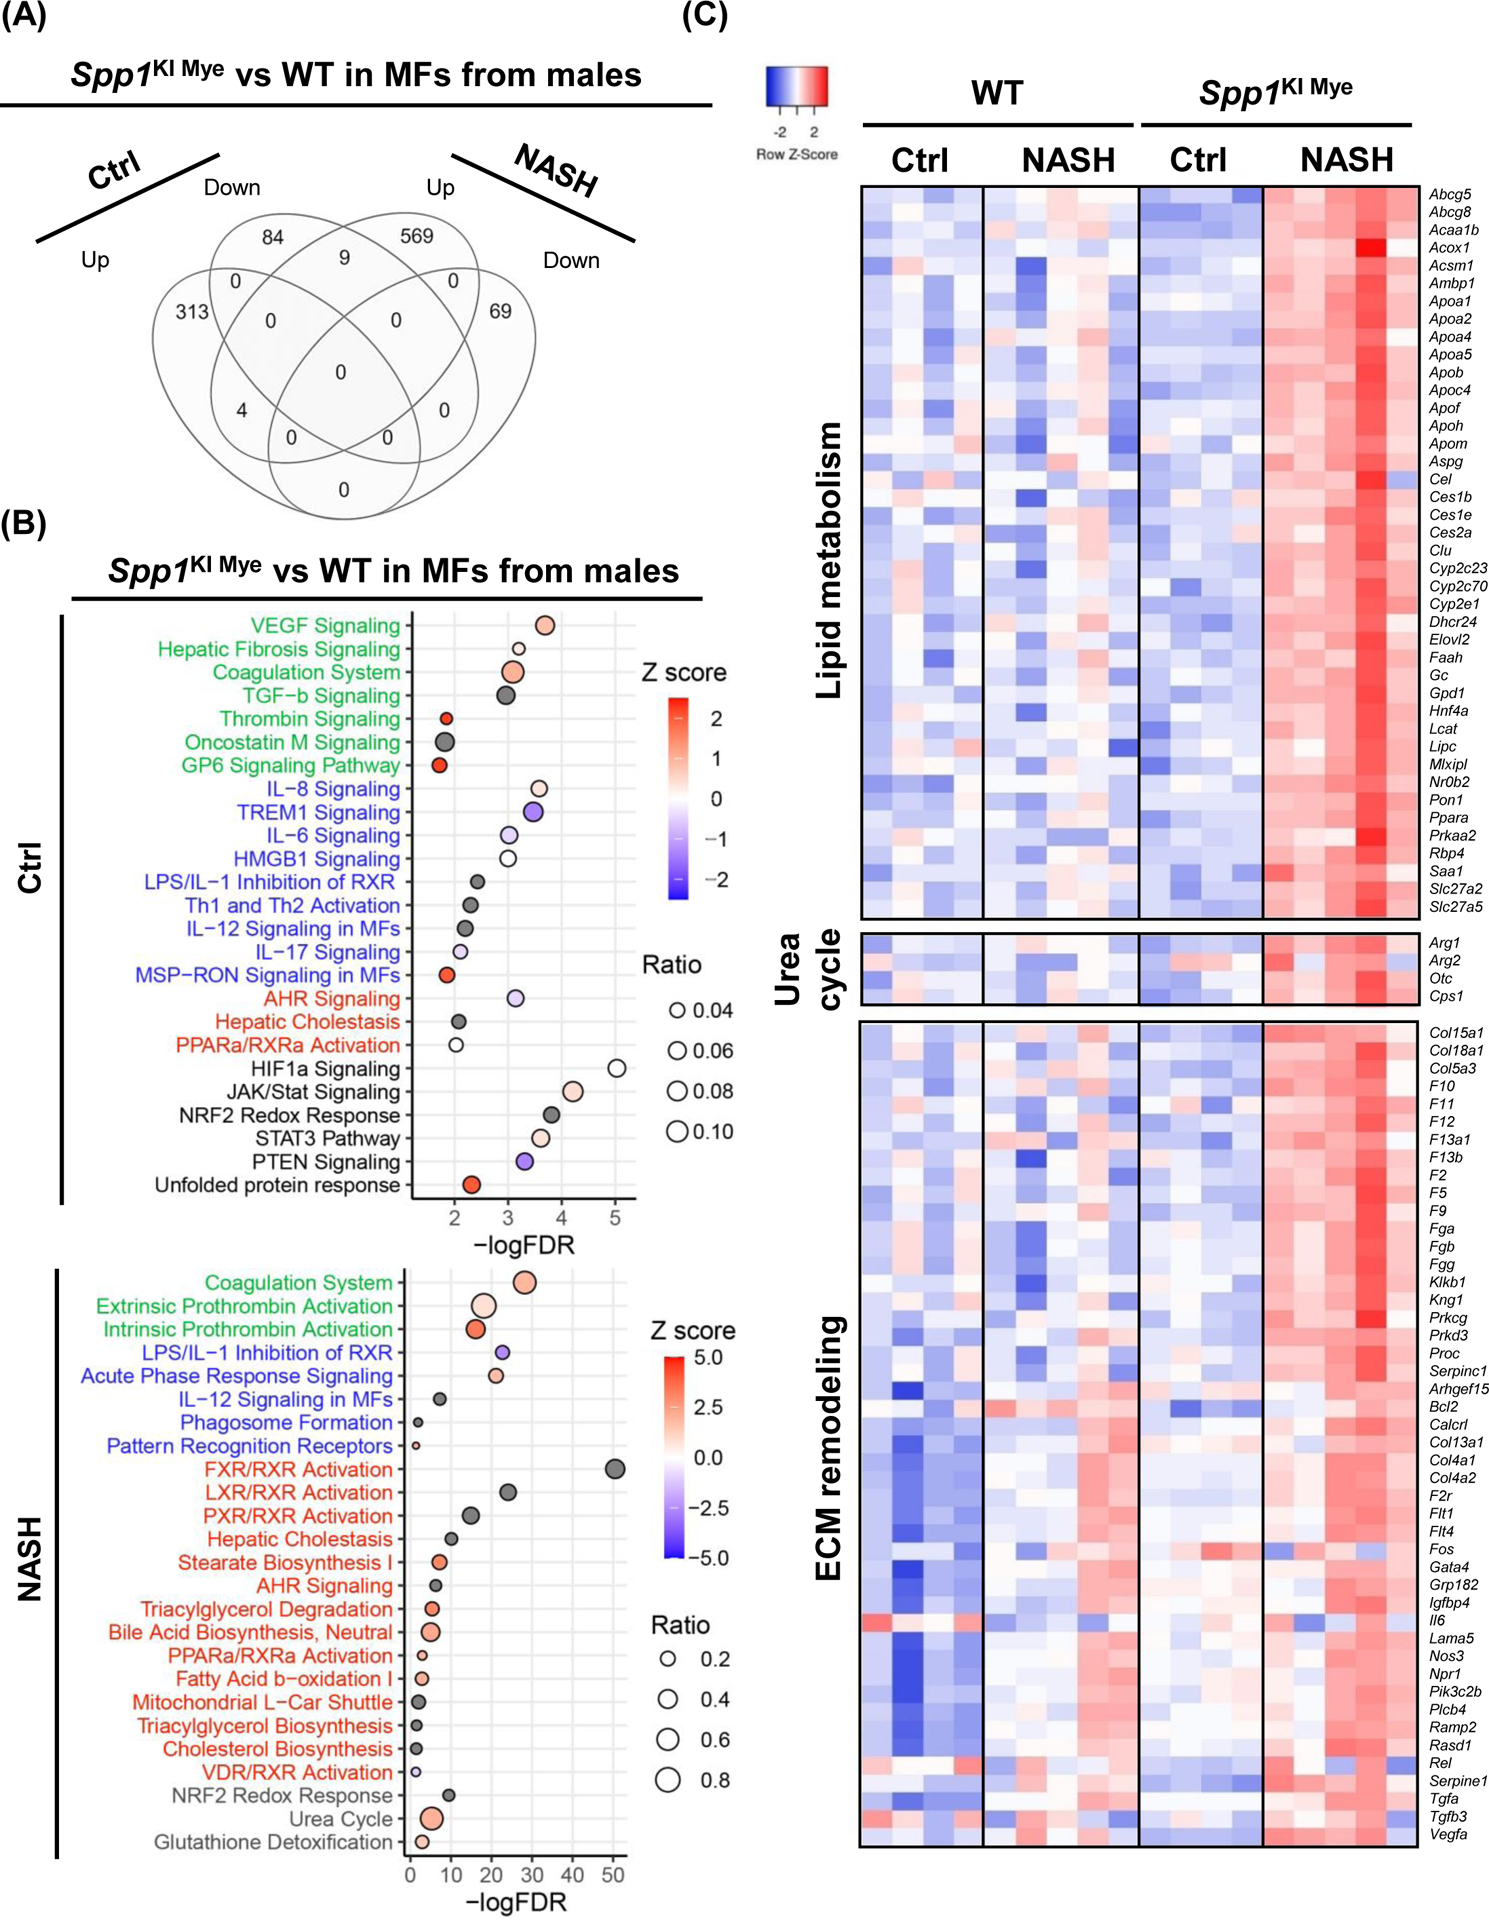
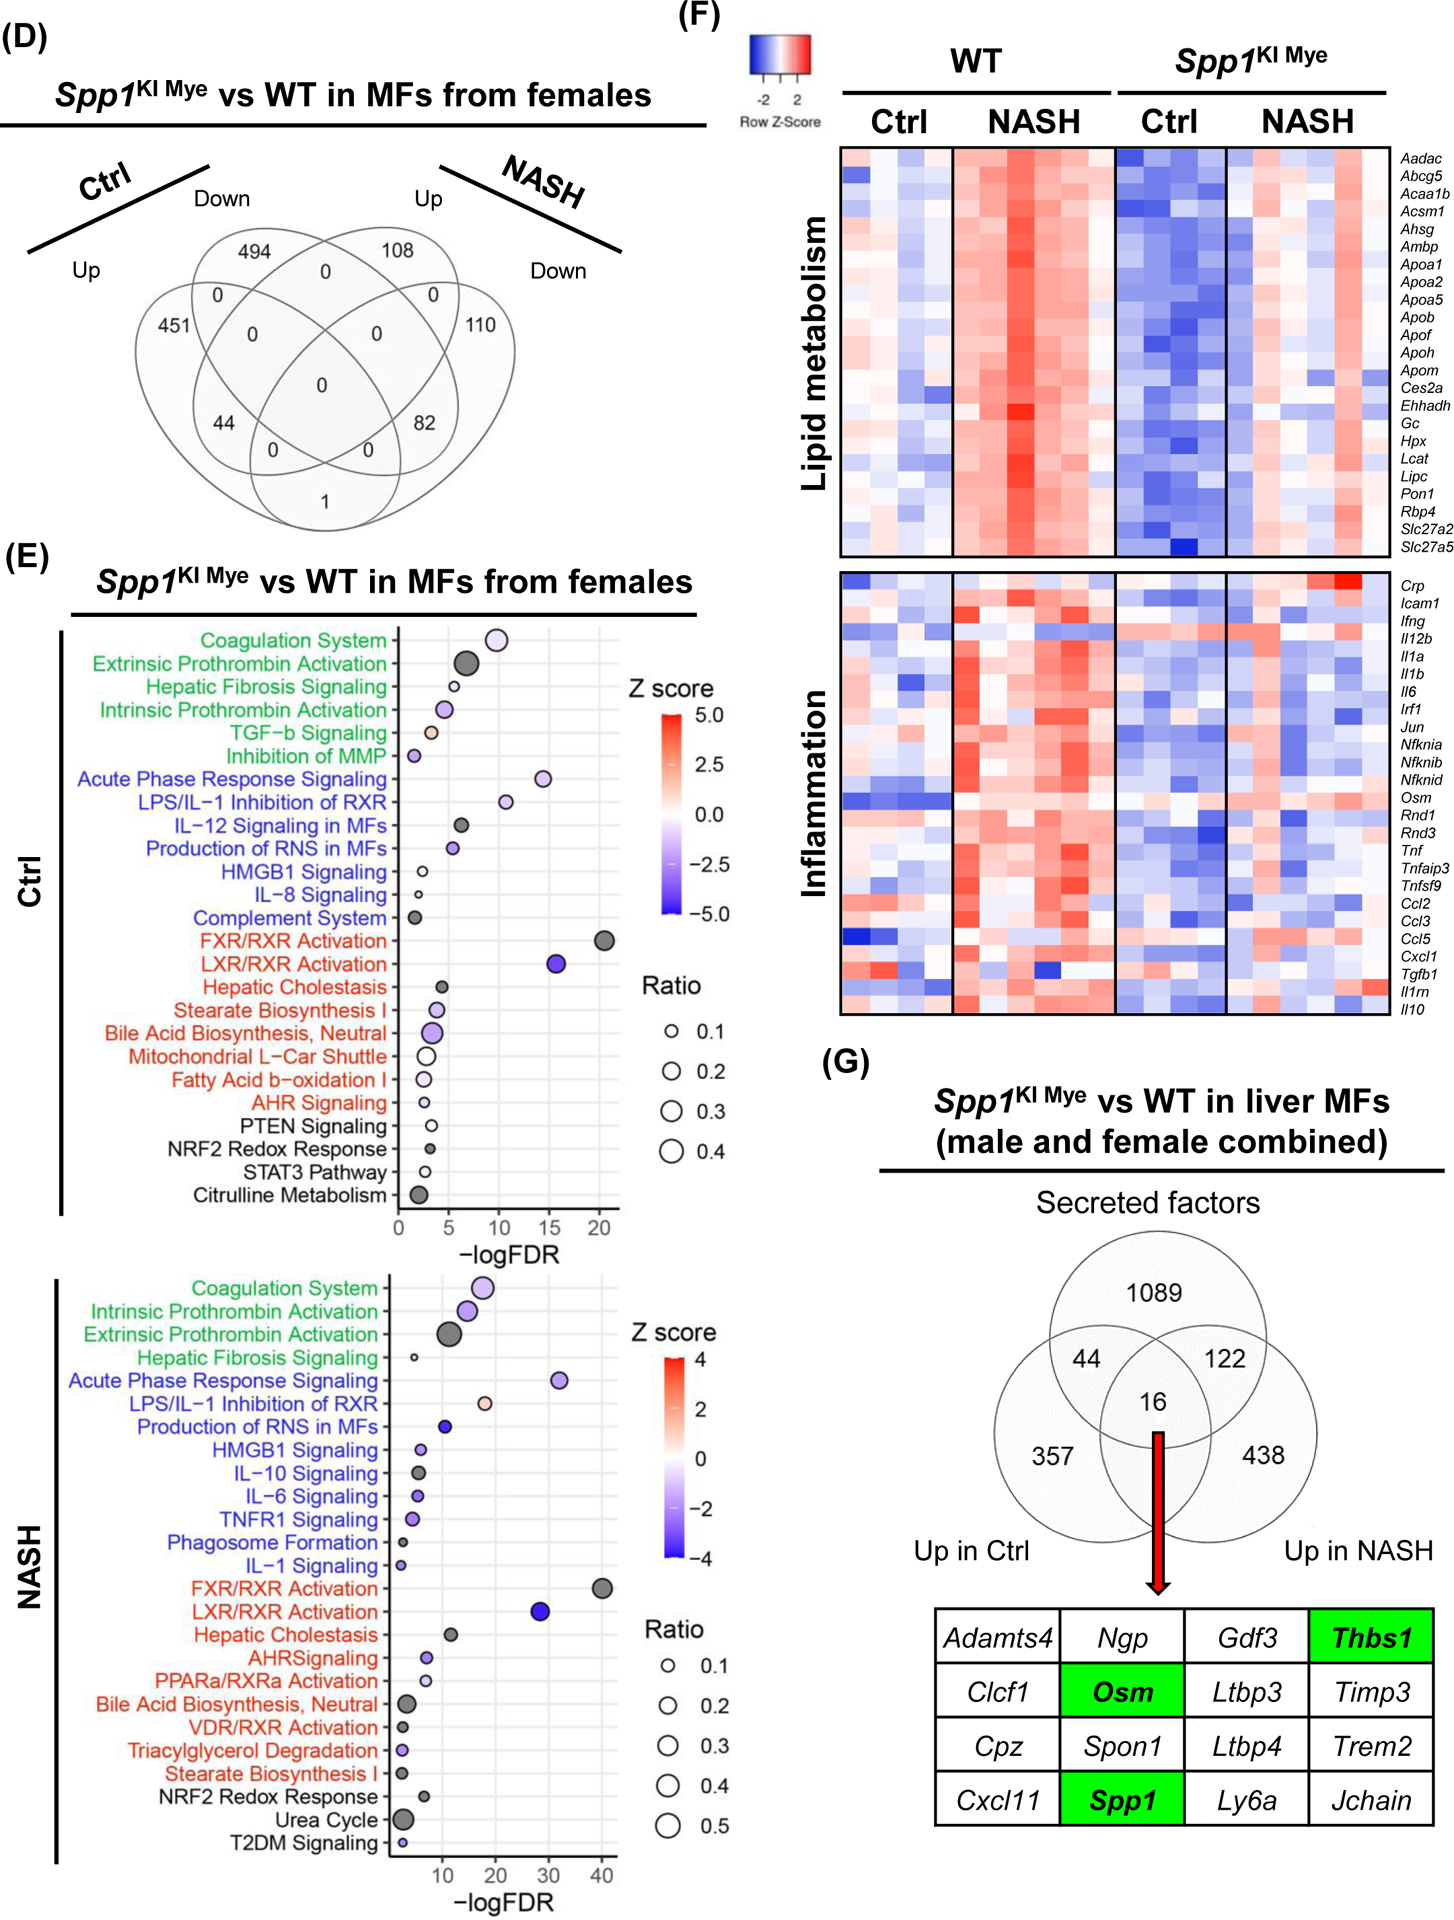
Spp1KI Mye and WT mice were fed for 6 months with control or NASH-inducing diet. Liver resident MFs were sorted, transcriptomics performed, and analyzed by EdgR followed by pathway analysis of DE genes with IPA. (A) Venn diagram of DE genes in MFs from males. (B) Dot plot of 25 representative pathways altered in MFs of Spp1KI Mye males fed control (top) or NASH-inducing diet (bottom). Pathways highlighted in green, blue, red and black indicate tissue remodeling, inflammation, lipid metabolism and other, respectively. (C) Heat map of genes involved in lipid metabolism, urea cycle, and tissue remodeling in MFs from males. Expression was normalized by log2 CPM. (D) Venn diagram of DE genes in MFs from females. (E) Dot plot of 25 representative pathways altered in MFs of Spp1KI Mye females fed control (top) or NASH-inducing diet (bottom). (F) Heat map of genes involved in lipid metabolism and inflammation in MFs from females. (G) Venn diagram of genes upregulated in MFs from Spp1KI Mye mice fed control or NASH-inducing diet overlapping with mouse secreted factors.
DE analysis revealed 1,026 (403 upregulated, 623 downregulated) genes changed in female groups fed control diet, while they decreased to 553 (256 upregulated, 297 downregulated) in female groups fed NASH-inducing diet. Unlike in males, DE genes had good overlap (65 upregulated, 118 downregulated) between groups fed control and NASH-inducing diet (Fig. 5D). In females fed control diet, tissue remodeling was mildly downregulated, except for TGFB signaling, while most of inflammation and lipid metabolism pathways were downregulated (Fig. 5E). STAT3 signaling was mildly upregulated as in Spp1KI Mye MFs from males fed control diet. In females fed NASH-inducing diet, MFs from Spp1KI Mye had several downregulated key pro-inflammatory pathways compared to WT mice (acute phase response, IL6, TNFR1 signaling), due to downregulation of cytokines (Il1a, Il1b, Tnf, Ccl2, Ccl3, Ccl5) (Fig. 5E, F). Female Spp1KI Mye mice had downregulated genes and pathways responsible for lipid metabolism (Abcg5, Apoa1, Apoa2) (Fig. 5E, F). Although no Z-score was available, urea cycle was also affected in Spp1KI Mye MFs from mice fed NASH-inducing diet (Fig. 5E). Notably, T2DM signaling, unaffected in males, was downregulated in Spp1KI Mye MFs from females with NASH (Fig. 5E). Therefore, Spp1KI Mye drives sex-specific effects, and its role also differs in mice fed control or NASH-inducing diet.
Spp1KI Mye drives expression of oncostatin-M (OSM), which induces Arg2 through STAT3.
Next, upregulated genes with a broader cut off p<0.05 and FC>1.5 in MFs from Spp1KI Mye compared to WT mice fed control or NASH-inducing diet (genders combined) were compared with a published list of mouse secreted proteins7. There were 16 genes (including Spp1) encoding mRNA of secreted proteins driven by Spp1KI Mye (Fig. 5G).
Then, we constructed the predicted regulatory network from the 16 secreted proteins to Arg2, by extracting molecular interactions from IPA, to visualize subcellular localization and node connectivity. Results indicated 6 secreted proteins (including OPN) could potentially regulate Arg2 expression through 53 interactions. OSM, THBS1 and OPN, had the highest connectivity in the network (Fig. 6A). Among the three, Osm had the highest DE (FC=6.49 for control diet; FC=4.04 for NASH-inducing diet) (Table S4 & S6), and could potentially induce Arg2 through STAT3, p38 MAPK and ERK (Fig. 6A). To test this possibility, first, we isolated MFs from WT and Spp1KI Mye mice and cultured them for 72 hours. OSM expression increased in MF lysate and culture medium from Spp1KI Mye mice (Fig. S8A). Then, we ablated the OSM receptor (Osmr) in primary hepatocytes using siRNA (Fig. S8B top). Last, we cultured WT and Osmr null hepatocytes with conditioned medium from WT and Spp1KI Mye MFs for 24 hours. Conditioned medium from Spp1KI Mye MFs increased ARG2 expression and STAT3 phosphorylation in WT hepatocytes, however these effects were reduced in Osmr null hepatocytes (Fig. 6B–C, S8B bottom). In the presence of PA and Spp1KI Mye MFs conditioned media, WT but not Osmr null hepatocytes, had less lipid droplets (Fig. 6C). To further confirm this, we injected Spp1KI Mye mice with an OSM neutralizing antibody, and found aggravation of NASH compared to mice injected isotype control, as shown by H&E, reduction of ARG2, increased NAS, TGs and CHO (Fig. 6D, E). Therefore, Spp1KI Mye drives expression of OSM, and increases Arg2 through STAT3 signaling in hepatocytes.
Figure 6. Spp1KI Mye drives expression of oncostatin-M (OSM), which induces Arg2 through STAT3.
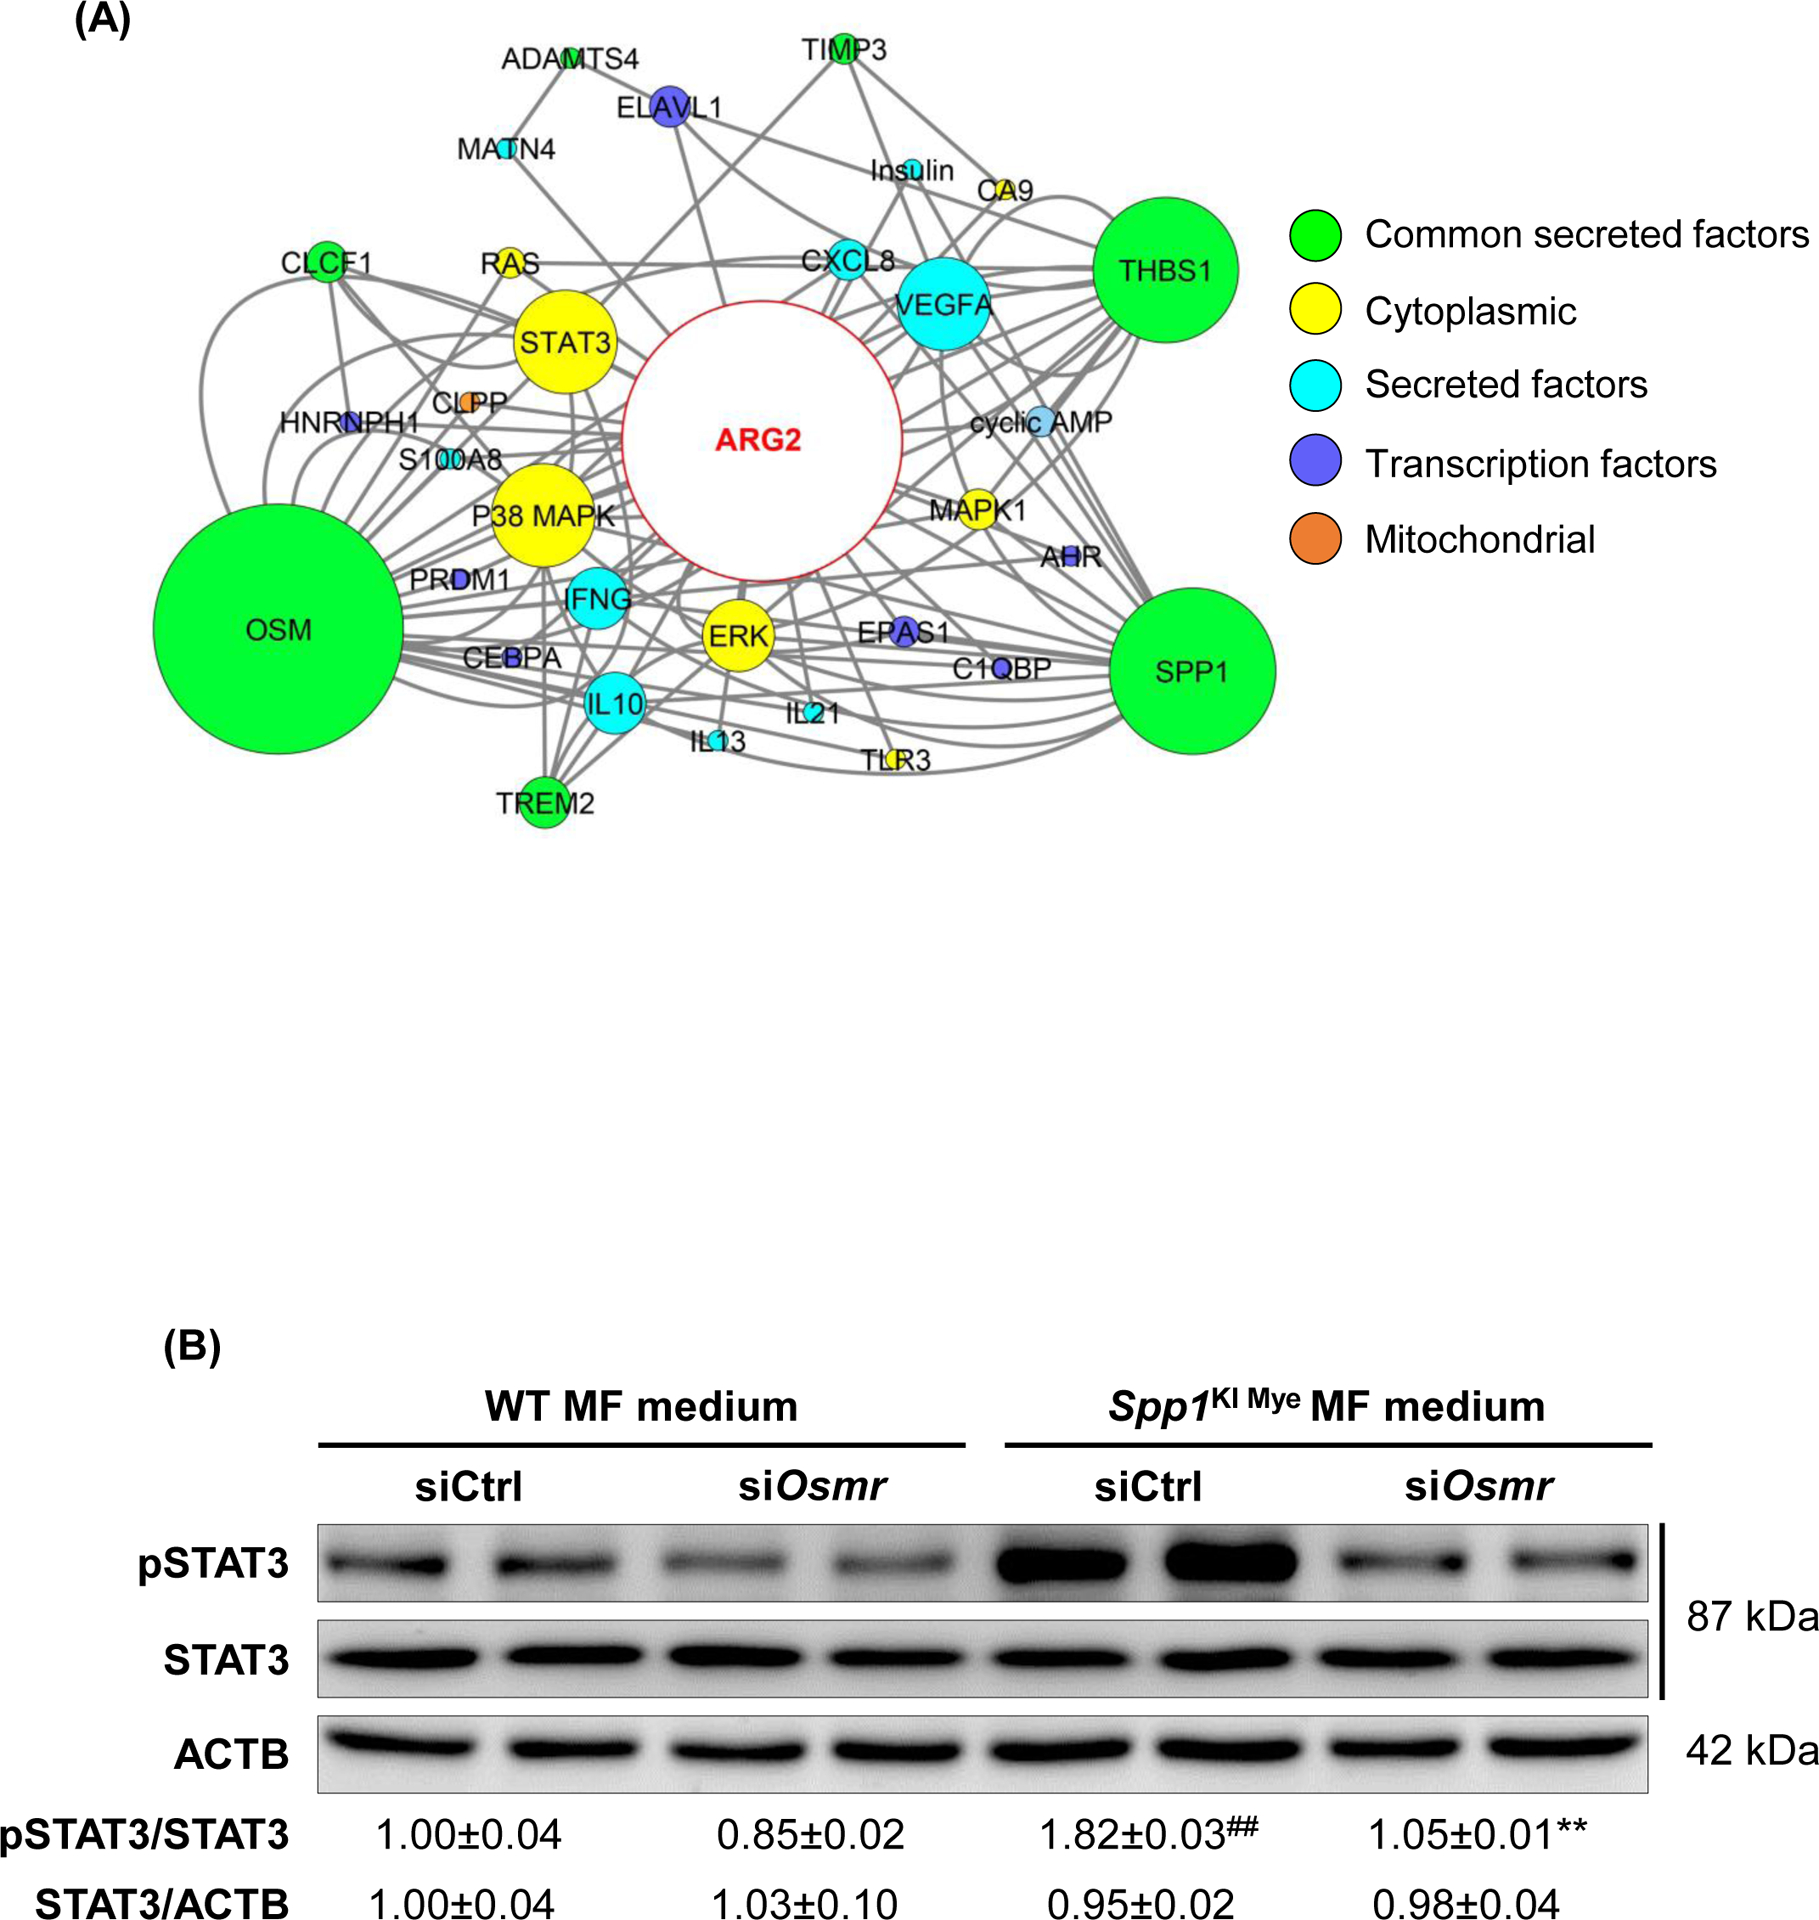
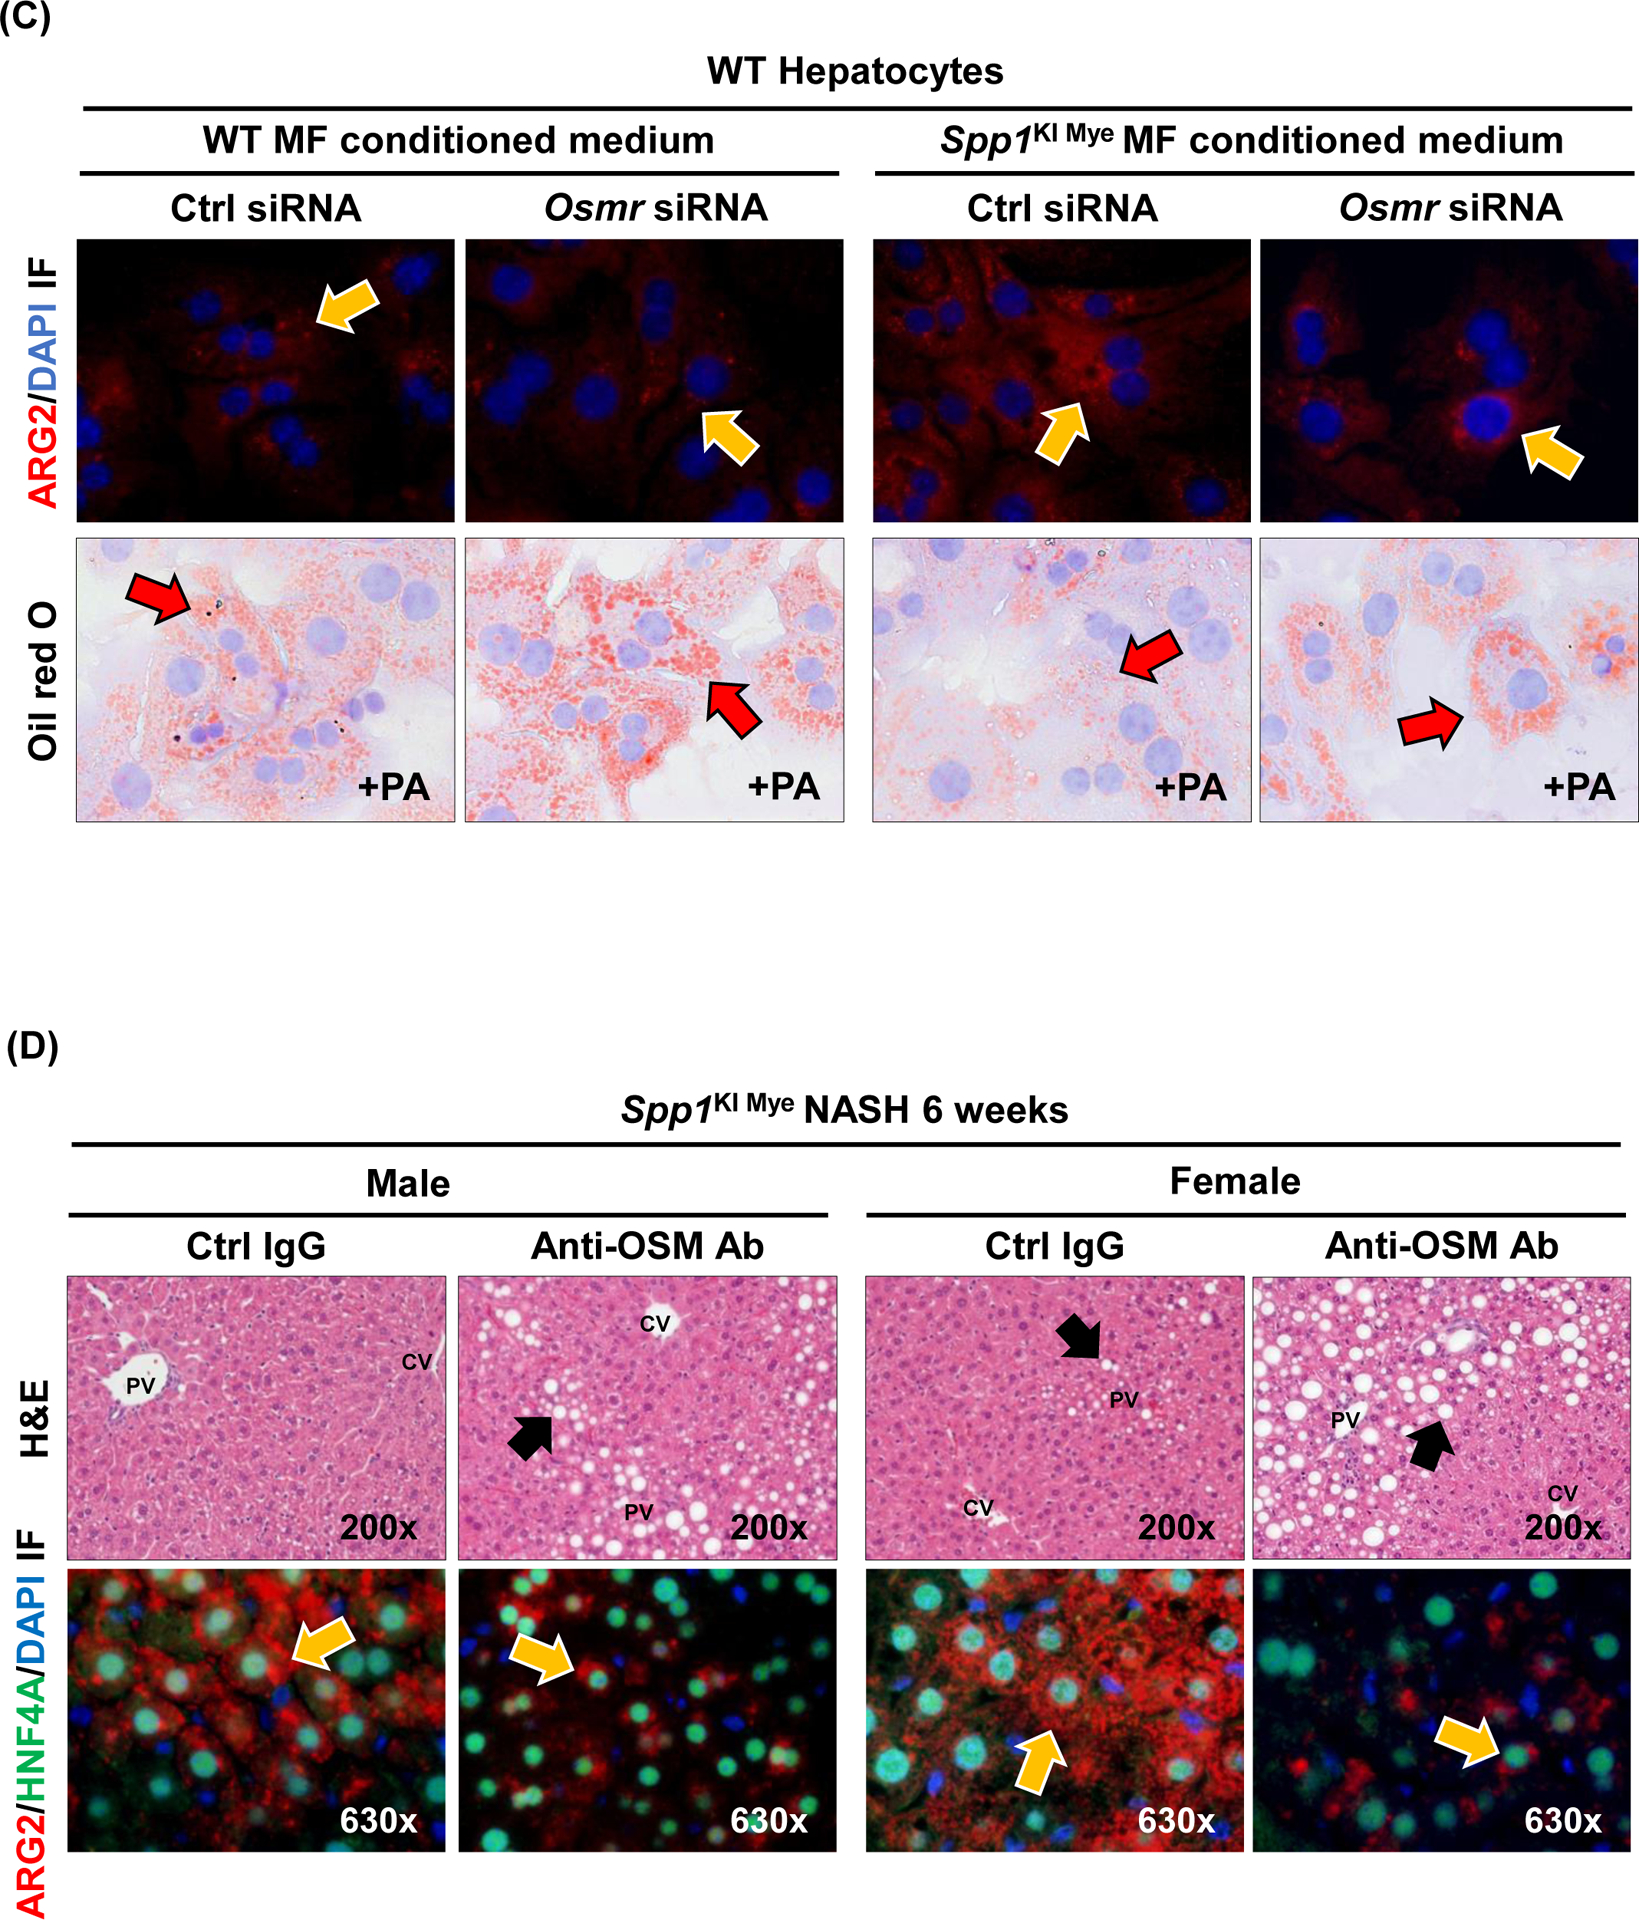
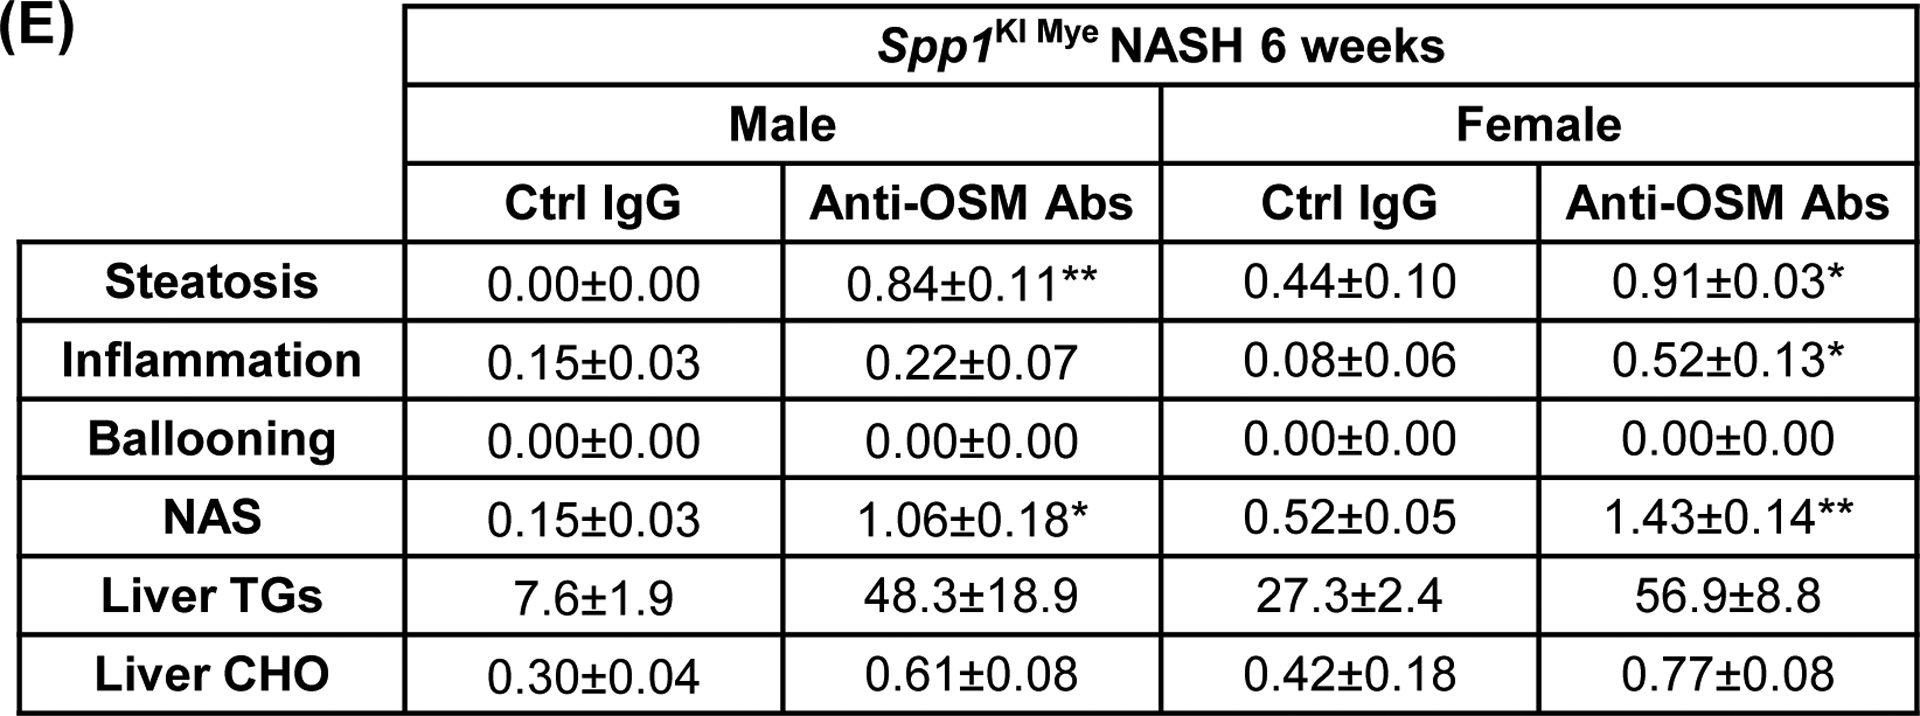
(A) Network landscape generated by Cytoscape indicating potential pathways leading to Arg2 upregulation (colors indicate subcellular localization; circle size indicates number of interactions). (B) Primary WT and Osmr null hepatocytes were cultured with conditioned medium of MFs from WT and Spp1KI Mye mice. Western blot of pSTAT3, STAT3 and ACTB; n=4, ##p<0.01 vs WT; **p<0.01 vs Ctrl siRNA. (C) ARG2 IF (yellow arrows: ARG2 expression in HEPs) and oil red O staining (red arrows: lipid droplets) of hepatocytes incubated with 30 μM BSA-conjugated-PA for 24 hours. (D) Spp1KI Mye mice were injected an OSM neutralizing antibody or isotype control (0.25 μg/g, 10 doses every other day from the fourth week of NASH), while fed NASH-inducing diet. H&E staining of liver (black arrows: macrovesicular steatosis) (top) and co-localization of ARG2 and HNF4A (bottom, yellow arrows: ARG2+HNF4A+ cells). (E) Individual scores, NAS, liver TGs and CHO normalized by protein (n=3/group). *p<0.05 and **p<0.01 vs. Ctrl IgG.
Spp1KI Mye influences extrahepatic fatty acid metabolism in a sex-specific manner.
Sex-specific effects of Spp1KI Mye were also observed in extrahepatic tissues. After 6 months, male Spp1KI Mye and WT mice had similar body weight gain and food intake on NASH diet, a 1.5-fold increase in visceral adipose tissue (VAT) and greater adipocyte size (Fig. 7A–D). In VAT, qPCR analysis showed downregulation of Pnpla2 but not Lipe in male Spp1KI Mye compared to WT mice (Fig. 7E). An in vivo lipolysis assay suggested that the lipolysis inducer isoproterenol, decreased NEFAs released within 30 min into circulation in male Spp1KI Mye mice (Fig. 7F). Differences were observed even before feeding NASH-inducing diet, but were lost in male and female Spp1KI LvMF mice (Fig. 7F & S9A).
Figure 7. Spp1KI Mye influences extrahepatic fatty acid metabolism in a sex-specific manner.
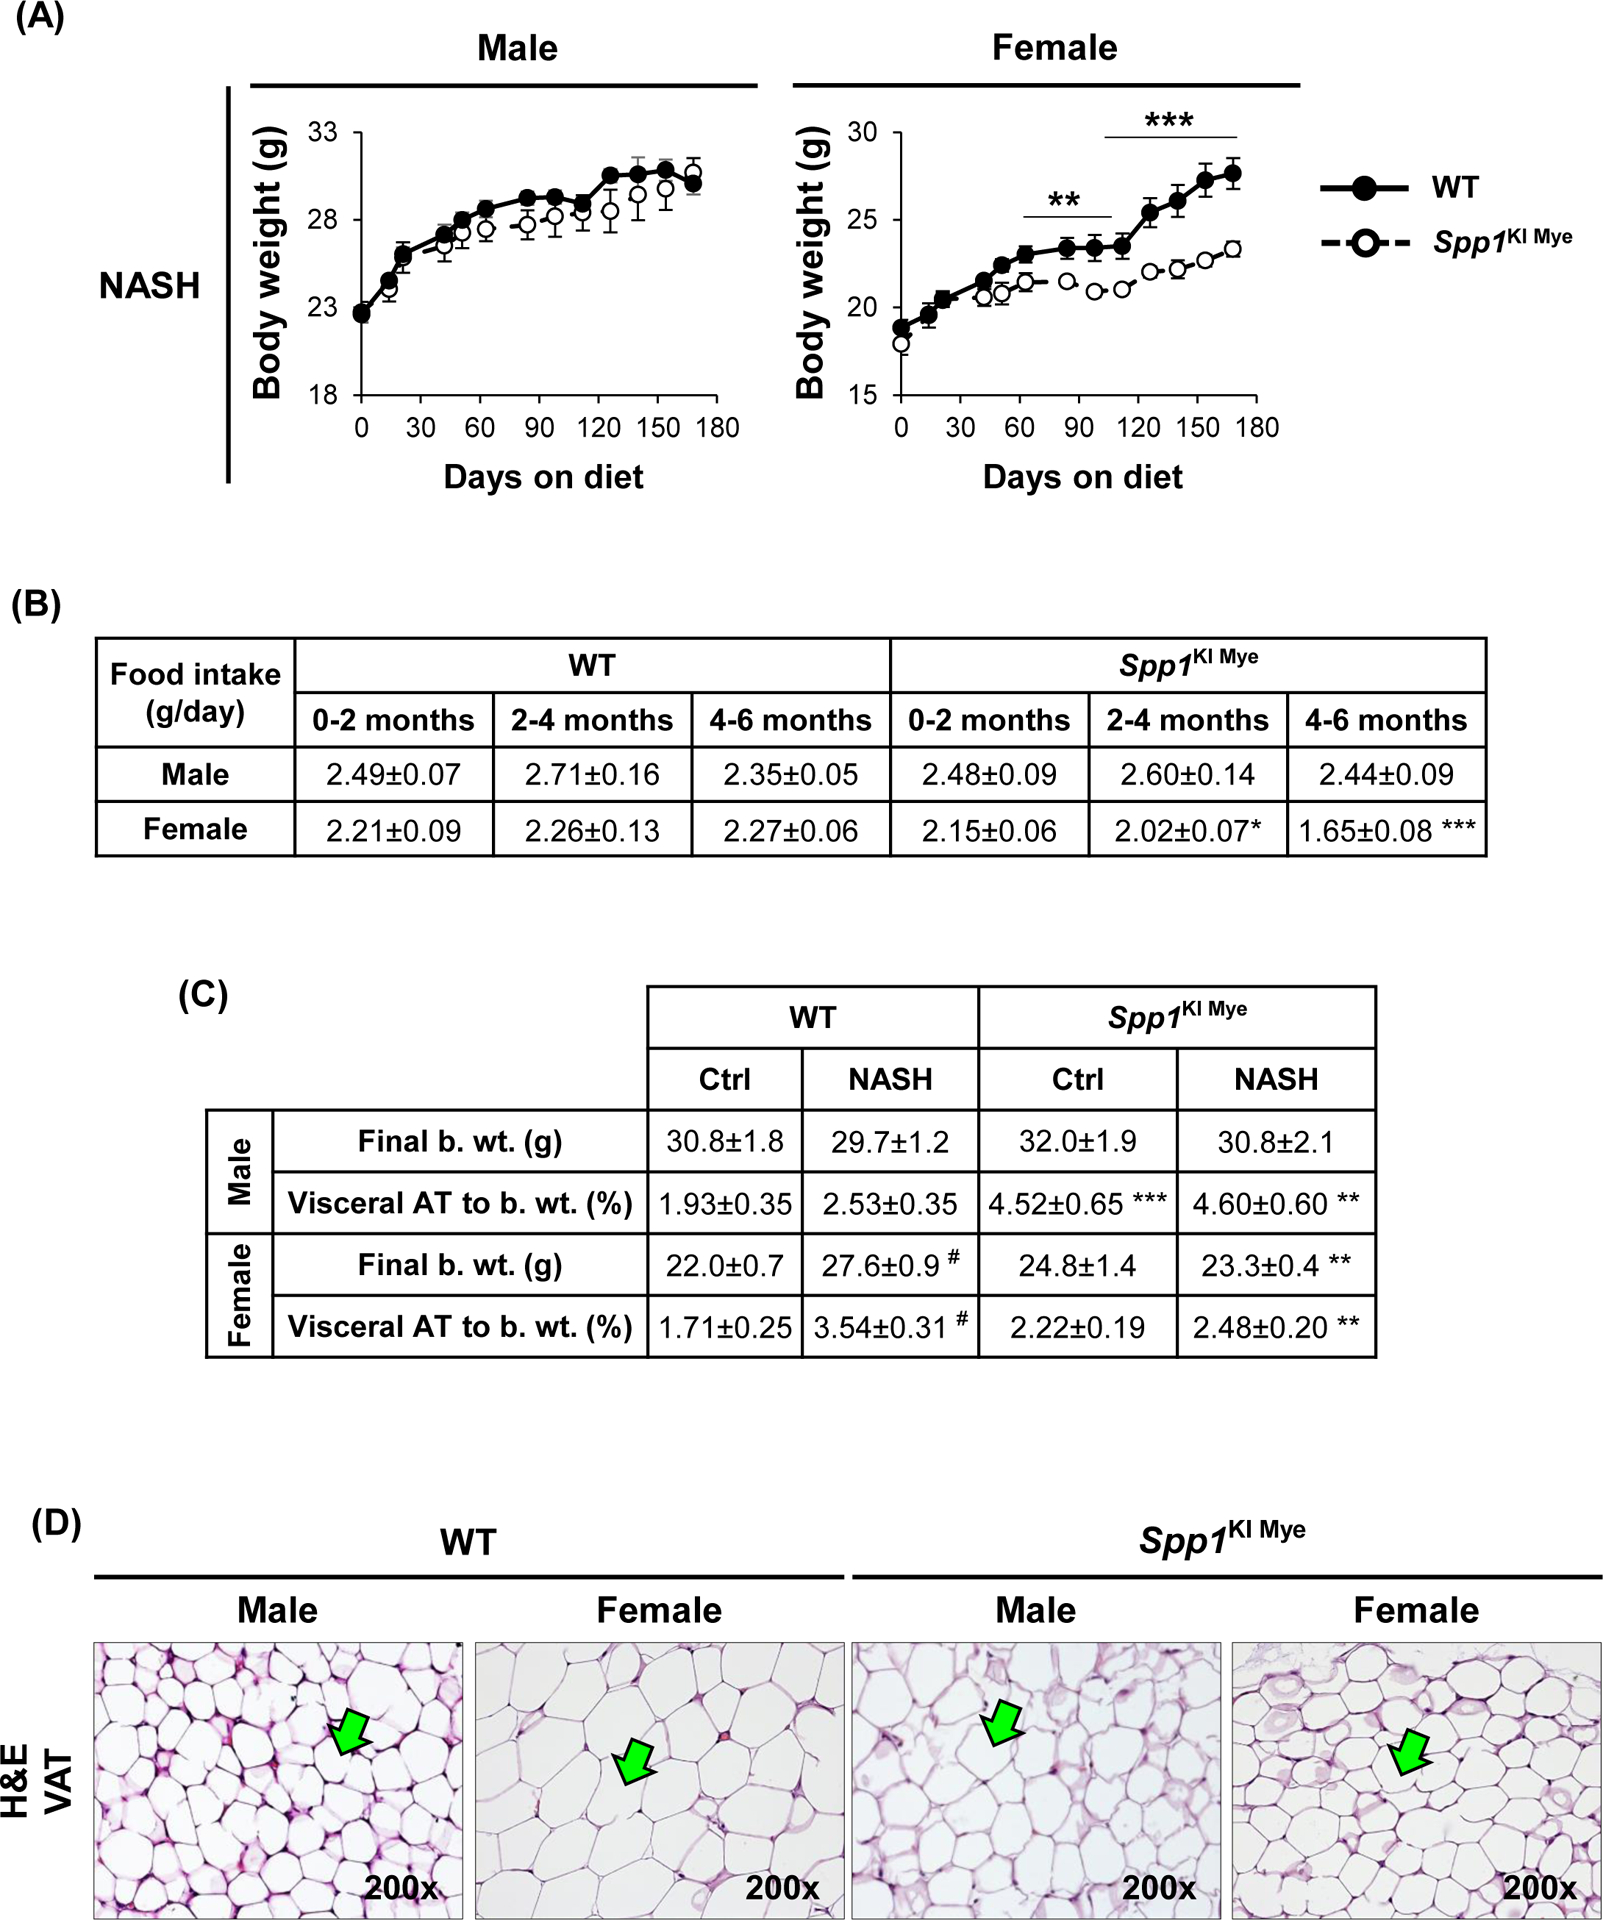
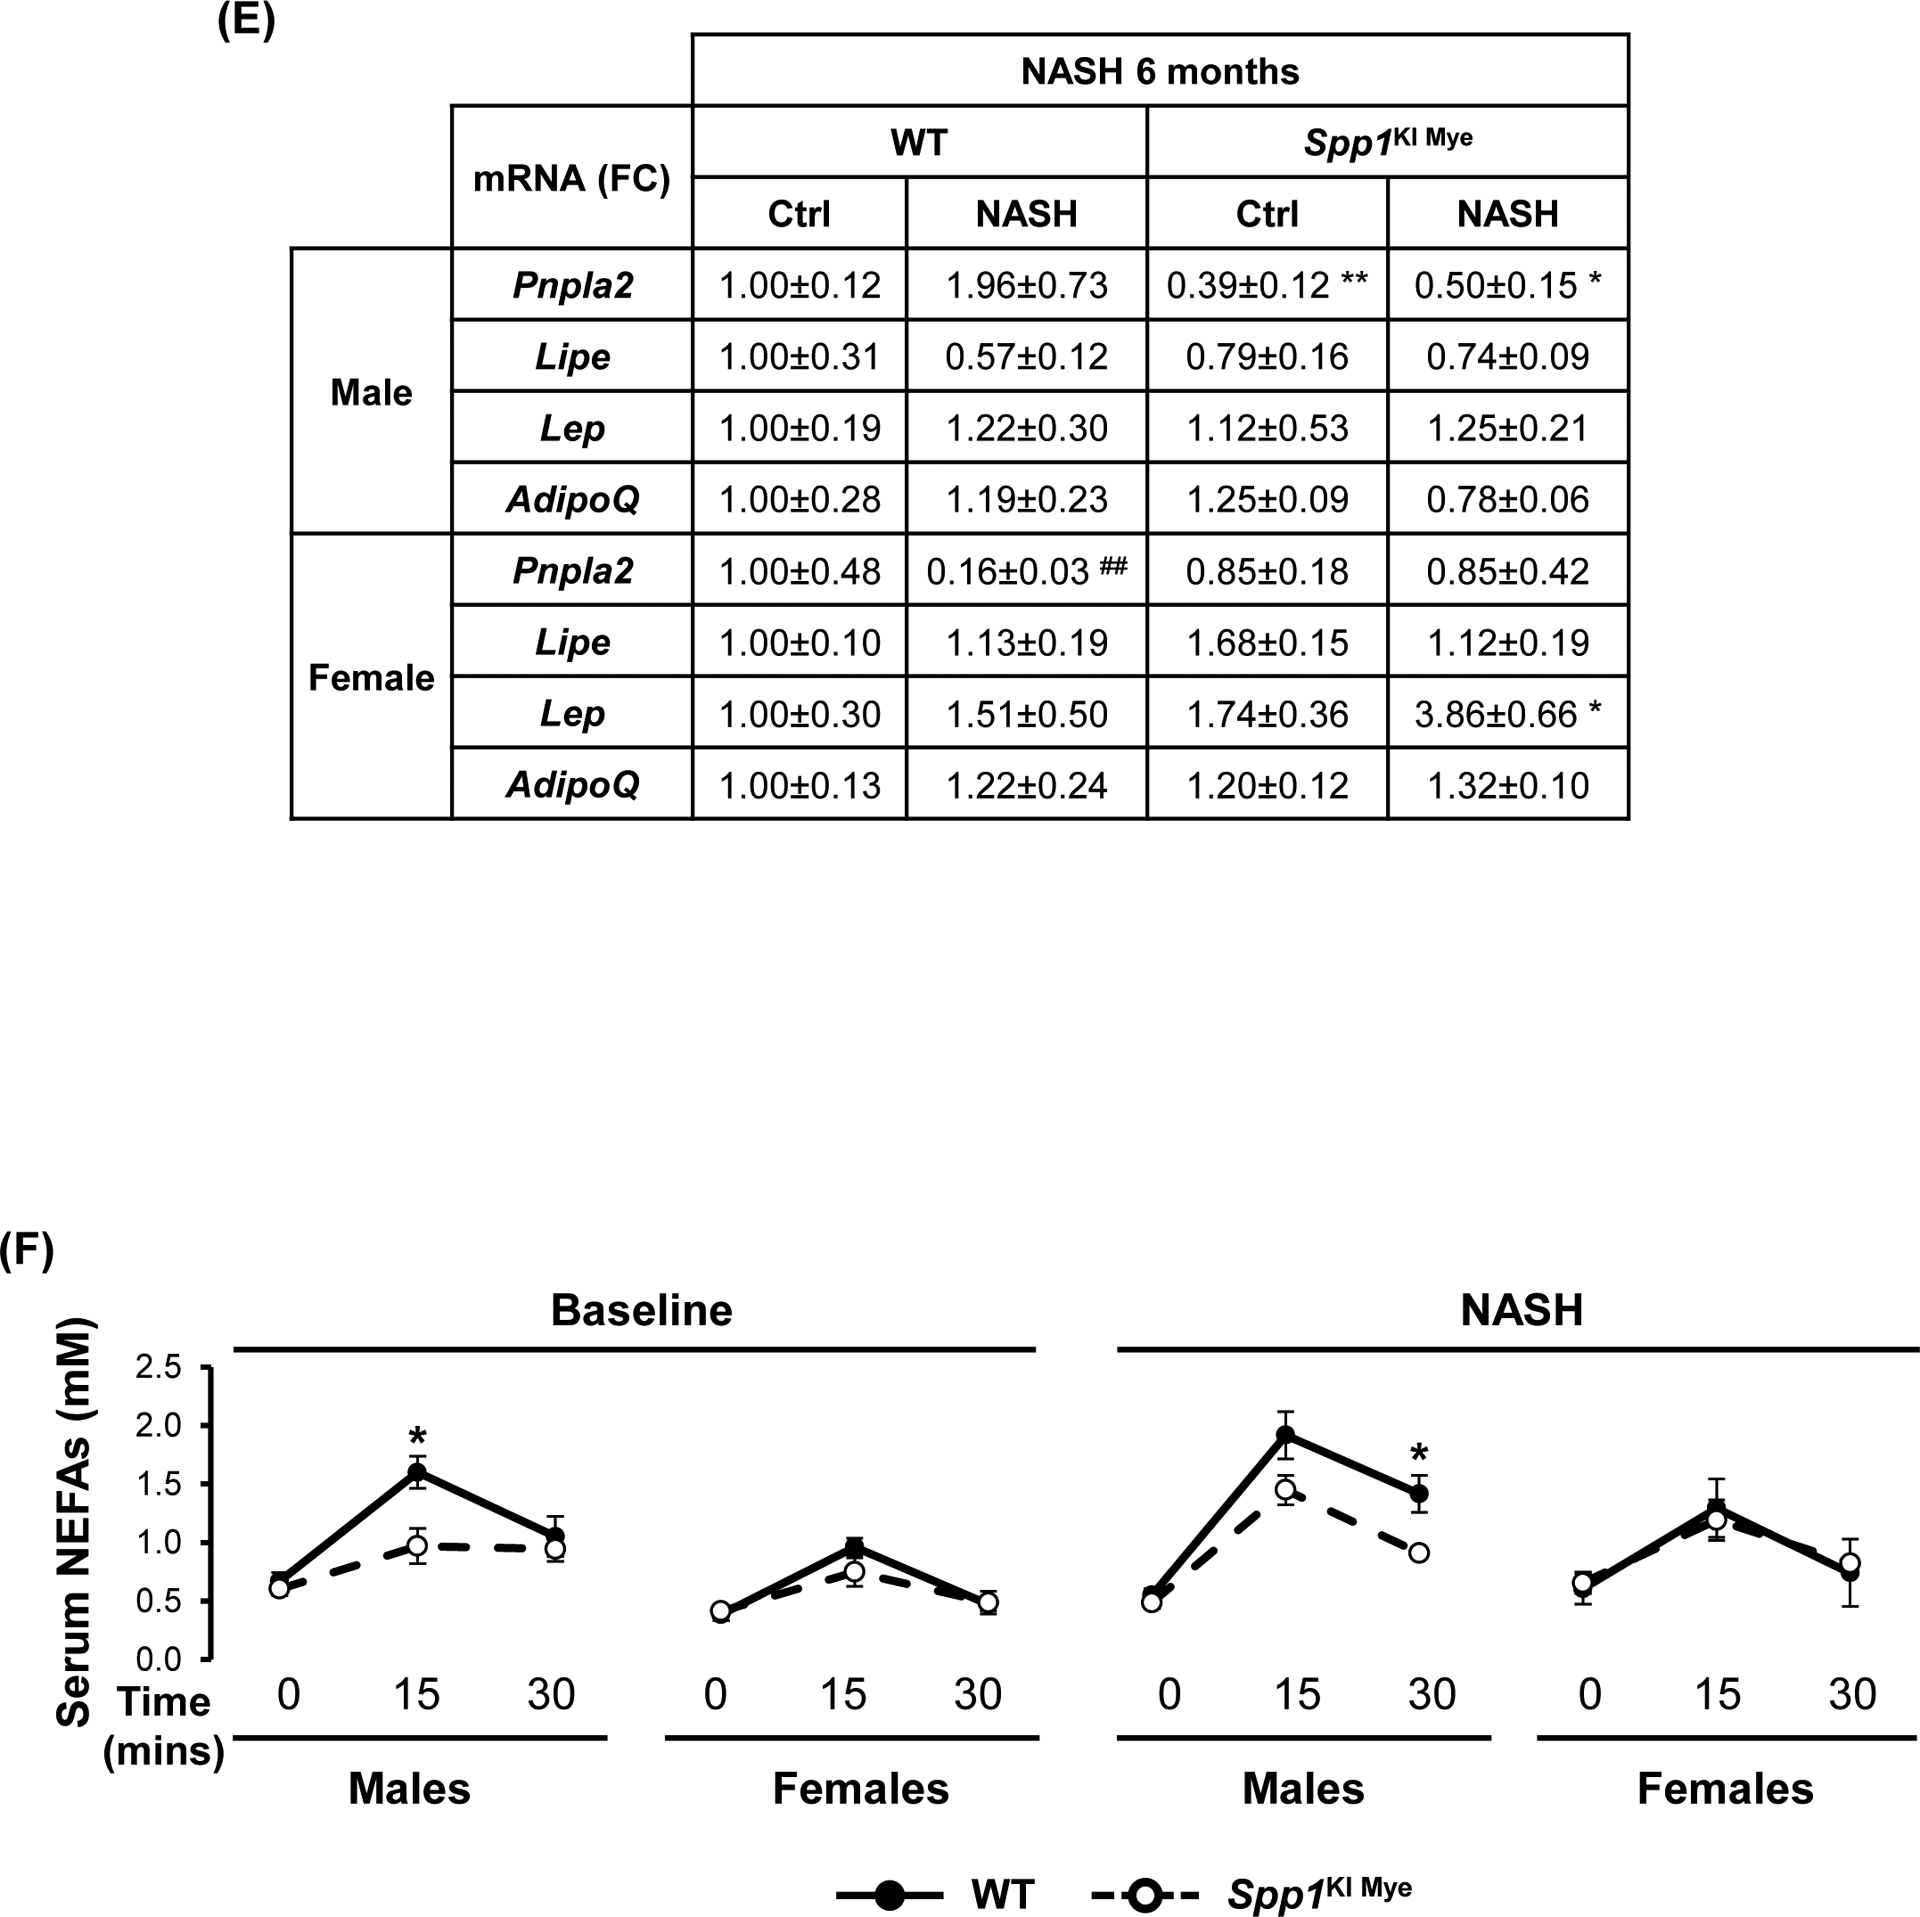
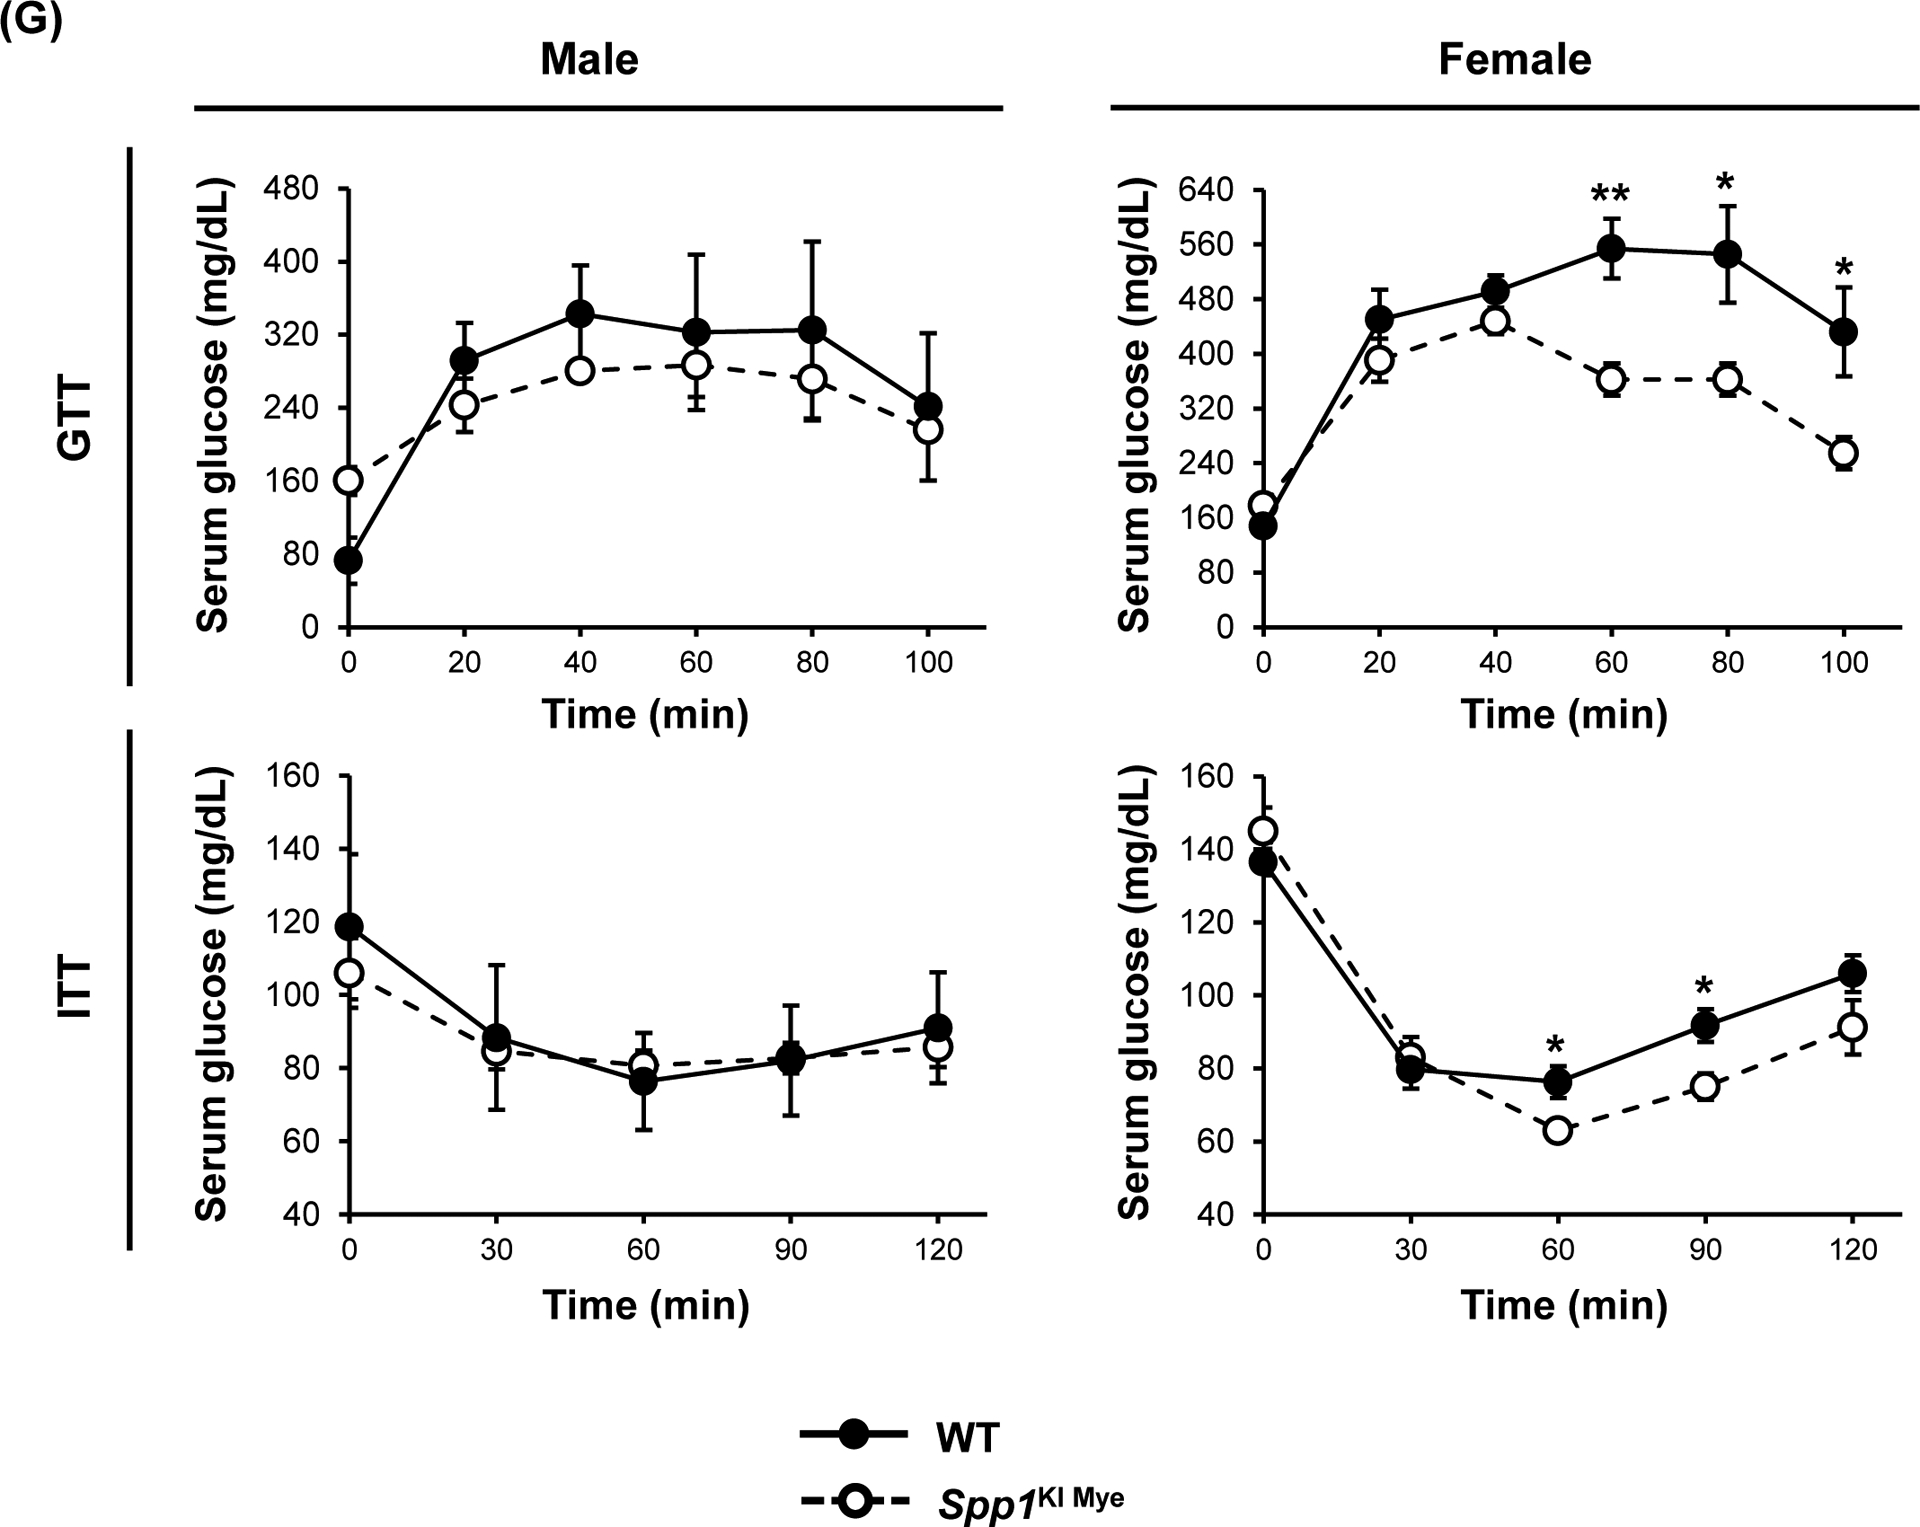
Spp1KI Mye and WT mice were fed for 6 months with control or NASH-inducing diet. (A) Body weight change throughout the experiment. (B) Average amount of food intake throughout the experiment. (C) Final body weight before euthanasia, and VAT-to-body weight ratio. (D) H&E staining of adipose tissue (green arrows: adipocytes). (E) Relative mRNA expression of Pnpla2, Lipe, Leptin and AdipoQ in adipose tissue. (F) In vivo lipolysis analysis measuring serum NEFA concentration after injection of isoproterenol (n=4–5/group). (G) GTT and ITT (n=4/group). Results are expressed as mean ± SEM; n=6/group. *p<0.05, **p<0.01 and ***p<0.001 vs. WT with same diet.
In contrast to males, female Spp1KI Mye fed NASH-inducing diet gained less body weight (~4.3 g) over 6 months (Fig. 7A), reduced VAT-to-body weight ratio and adipocyte size (Fig. 7C, D) compared to WT mice. Food intake was similar in Spp1KI Mye males, while Spp1KI Mye females reduced food intake from 2–4 months on NASH-inducing diet, correlating with reduced body weight gain (Fig. 7B). Female Spp1KI Mye mice with NASH had improved insulin sensitivity, with decreased glucose over time in the glucose tolerance test (GTT) and insulin tolerance test (ITT) (Fig. 7G). Expression of Pnpla2 and Lipe remained unchanged, while Leptin but not AdipoQ increased in female Spp1KI Mye VAT compared to WT mice with NASH (Fig. 7E). In Spp1KI LvMF (Spp1 overexpressed in liver MFs), final body weight was significantly reduced in both sexes, while VAT and food intake remained unchanged compared to WT mice fed NASH-inducing diet (Fig. S9B). Further, insulin resistance was similar in Spp1KI LvMF females compared to WT mice (Fig. S9C). Therefore, both male and female Spp1KI Mye mice were also protected by additional sex-specific extrahepatic mechanisms.
DISCUSSION
Induction of OPN expression is associated with fibrosis16, 18 and progression to NASH9, 10, 26. In NASH, the emergence of LAMs, characterized by high OPN expression, indicates the importance of understanding the role of MF-derived OPN in NASH6. Analysis of scRNAseq data indicated that upregulation of MF-derived OPN correlated with NASH progression in humans and mice, but it was unclear if increased OPN in these cells was protective or detrimental. Further analysis showed that Spp1High MFs were not involved in inflammation, consistent with a previous study11, but instead, were enriched with genes involved in lipid uptake (Cd36, Lpl, Plin2) and matrix remodeling (Mmp12, Mmp13).
To investigate how induction of OPN in MFs participated in progression to NASH, we generated Spp1KI Mye, Spp1KI LvMF and Spp1ΔMye mice, and fed them control or NASH-inducing diet. Both male and female Spp1KI Mye mice were significantly protected from NASH, had striking reduction in infiltrating MoMFs, and downregulation of key chemokine receptors, ligands and pro-fibrogenic markers. While Spp1ΔMye mice did not show a fully reversed phenotype, they had worse steatosis at 1 and 3 months, and more inflammation at 6 months, suggesting Spp1ΔMye accelerated NAFLD progression.
Because Spp1KI Mye mice had reduced steatosis, there was likely crosstalk between myeloid cells and hepatocytes to regulate liver metabolism. Spp1KI LvMF mice almost replicated the protective phenotype without gender differences, suggesting liver resident MFs played a major role in mediating the effect. To understand how steatosis decreased, we analyzed changes in lipid composition. Spp1KI Mye mice with NASH favored removal of TGs, with FAs containing less carbon atoms and double bonds, such as PA. FAO is initiated by ACAD, and although mitochondrial ACADL has broad substrate activity toward saturated and unsaturated FAs, it exhibits minor activity toward poly-unsaturated substrates27. This could explain why TGs enriched in very long-chain PUFAs accumulated in livers from Spp1KI Mye mice.
In analyses to understand metabolic pathways associated with significantly reduced TGs, we found a cluster of metabolites enriched for ammonia recycling and urea cycle. Gene expression suggested that these changes were likely due to ARG2 upregulation. Arginase, the last enzyme in the urea cycle, catalyzes the conversion of L-arginine to L-ornithine and urea. The inducible isoform ARG2, localizes in mitochondria, and mice with global ablation of Arg2 develop spontaneous liver steatosis23. Further, ARG2 overexpression reduces TGs in mice fed a high-fat diet28. Dysregulation of urea cycle and hyperammonemia are associated with progression of NAFLD29. Further, NAFLD patients have high 3-NT expression compared to healthy individuals30. Nitrosylation of mitochondrial complexes I and IV, inhibits respiration and causes cell injury31. Spp1KI Mye mice induced urea production, reduced circulating ammonia, and downregulated 3-NT expression in hepatocytes. Induction of ARG2 regulates mitochondrial bioenergetics and promotes conversion of NAD+ to NADH32. Maintaining an adequate NAD+/NADH ratio is essential for mitochondrial FAO, while NAD+ generated from oxidative phosphorylation induces complete oxidation of FAs to protect from NAFLD25. In Spp1KI Mye mice, liver NAD+/NADH ratio increased along with ATP production. Therefore, we hypothesized that Spp1KI Mye induced ARG2 to protect from steatosis by increasing FAO. In fact, we observed increased mitochondria membrane potential and FAO in hepatocytes from Spp1KI Mye mice, while Arg2 siRNA knockdown dampened this effect and Arg2ΔHep showed worsened steatosis compared to WT mice.
Comparison of upregulated genes in MFs, in both sexes, with published mouse secreted proteins, identified 16 proteins. IPA analysis suggested that ARG2 could be upregulated by OPN, OSM and THBS1. Both THBS1 and OSM are produced by monocytes and MFs5. Data from our group indicate that direct treatment with OPN does not affect ARG2 expression15. OPN induces OSM via transactivation of αvβ3 integrin and PDGFR in primary osteoblasts33. Further studies are needed to define how Spp1KI Mye induces OSM in MFs. OSM promotes liver regeneration34 and OPN deficiency inhibits liver regeneration due to insufficient activation of STAT335. However, the role of OSM in NAFLD remains controversial. While some studies indicate it causes liver fibrosis and cancer36, 37, loss of OSMR exacerbates liver steatosis, metabolic disorders and NAFLD38, 39.
STAT3 signaling reduces lipid accumulation in hepatocytes40, which some studies indicate occurs through enhanced FAO in immune cells41. In vitro, knockdown of Osmr downregulated STAT3 phosphorylation and ARG2 induction, and increased lipid accumulation in hepatocytes cultured with Spp1KI Mye MF conditioned medium. In vivo, injection of an OSM neutralizing antibody worsened NASH in Spp1KI Mye mice. Therefore, the OSM–STAT3–ARG2 axis is key for limiting lipid accumulation in hepatocytes during progression of NAFLD.
Profound gender specific effects were observed at cellular, tissular and extrahepatic levels. Increased VAT was linked to reduced lipolysis in Spp1KI Mye male mice. This effect did not occur in Spp1KI LvMF mice, where mostly intrahepatic KCs were targeted. In contrast, females had reduced liver steatosis, due to improved insulin sensitivity and reduced food intake. Differences between both could be due to sexual dimorphism in the immune system42 and to profound effect of estrogens43.
In summary, our results show that MF-derived OPN protected from NASH. The effect was mediated by upregulation of OSM in MFs, which increased ARG2 through STAT3 signaling in hepatocytes. Further, the ARG2-mediated increase in FAO reduced steatosis. Therefore, enhancing the OPN–OSM–ARG2 crosstalk between MFs and hepatocytes may be beneficial for NAFLD patients.
Supplementary Material
Acknowledgments:
the authors are very grateful to Dr. Vily Panoutsakopoulou (Biomedical Research Foundation of the Academy of Athens, Athens, Greece) for providing Spp1.Stopfl/fl mice.
List of abbreviations:
- 3-NT
3-nitrotyrosine
- Albumin.Cre
transgenic mice expressing Cre recombinase driven by the albumin promoter
- ARG
arginase
- BEC
biliary epithelial cell
- Arg2 ΔHep
conditional knock-out Arg2 in hepatocytes
- BSA
bovine serum albumin
- CHO
cholesterol
- DE
differential expression
- FA
fatty acid
- FAO
fatty acid oxidation
- FC
fold change
- FISH
fluorescent in situ hybridization
- GEO
Gene Expression Omnibus
- GTT
glucose tolerance test
- HFFC
high-fat, fructose and cholesterol
- IHC
immunohistochemistry
- IPA
Ingenuity Pathway Analysis
- ITT
insulin tolerance test
- KC
Kupffer cell
- LAM
lipid-associated macrophage
- Lyz2.Cre
transgenic mice expressing Cre recombinase driven by the lysozyme-2 promoter
- MF
macrophage
- MoMF
monocyte-derived macrophage
- MRC
maximal respiratory capacity
- NAFLD
non-alcoholic fatty liver disease
- NAS
NAFLD activity score
- NASH
non-alcoholic steatohepatitis
- NEFA
non-esterified fatty acid
- OCR
oxygen consumption rate
- OPN
osteopontin
- OSM
oncostatin-M
- OSMR
oncostatin-M receptor
- PA
palmitic acid
- PUFA
polyunsaturated fatty acid
- SEM
standard error of the mean
- SPP1
secreted phosphoprotein-1
- Spp1High MF
macrophage with high Spp1 expression
- Spp1 KI LvMF
conditional knock-in of Spp1 in hepatic macrophages
- Spp1 KI Mye
conditional knock-in of Spp1 in myeloid cells
- Spp1 ΔMye
conditional knock-out Spp1 in myeloid cells
- SRC
spare respiratory capacity
- TG
triglyceride
- TREM
triggering receptor expressed on myeloid cells
- VAT
visceral adipose tissue
- WT
wild type
Footnotes
Conflict of Interest: the authors have none to declare.
REFERENCES
- 1.Younossi ZM. The epidemiology of nonalcoholic steatohepatitis. Clin Liver Dis (Hoboken) 2018;11:92–94. [DOI] [PMC free article] [PubMed] [Google Scholar]
- 2.Machado MV, Diehl AM. Pathogenesis of Nonalcoholic Steatohepatitis. Gastroenterology 2016;150:1769–77. [DOI] [PMC free article] [PubMed] [Google Scholar]
- 3.Chalasani N, Younossi Z, Lavine JE, et al. The diagnosis and management of nonalcoholic fatty liver disease: Practice guidance from the American Association for the Study of Liver Diseases. Hepatology 2018;67:328–357. [DOI] [PubMed] [Google Scholar]
- 4.Kazankov K, Jorgensen SMD, Thomsen KL, et al. The role of macrophages in nonalcoholic fatty liver disease and nonalcoholic steatohepatitis. Nat Rev Gastroenterol Hepatol 2019;16:145–159. [DOI] [PubMed] [Google Scholar]
- 5.Guilliams M, Bonnardel J, Haest B, et al. Spatial proteogenomics reveals distinct and evolutionarily conserved hepatic macrophage niches. Cell 2022;185:379–396 e38. [DOI] [PMC free article] [PubMed] [Google Scholar]
- 6.Remmerie A, Martens L, Thone T, et al. Osteopontin Expression Identifies a Subset of Recruited Macrophages Distinct from Kupffer Cells in the Fatty Liver. Immunity 2020;53:641–657 e14. [DOI] [PMC free article] [PubMed] [Google Scholar]
- 7.Xiong X, Kuang H, Ansari S, Liu T, et al. Landscape of Intercellular Crosstalk in Healthy and NASH Liver Revealed by Single-Cell Secretome Gene Analysis. Mol Cell 2019;75:644–660 e5. [DOI] [PMC free article] [PubMed] [Google Scholar]
- 8.Hou J, Zhang J, Cui P, et al. TREM2 sustains macrophage-hepatocyte metabolic coordination in nonalcoholic fatty liver disease and sepsis. J Clin Invest 2021;131. [DOI] [PMC free article] [PubMed] [Google Scholar]
- 9.Nunez-Garcia M, Gomez-Santos B, Buque X, et al. Osteopontin regulates the cross-talk between phosphatidylcholine and cholesterol metabolism in mouse liver. J Lipid Res 2017;58:1903–1915. [DOI] [PMC free article] [PubMed] [Google Scholar]
- 10.Sahai A, Malladi P, Melin-Aldana H, et al. Upregulation of osteopontin expression is involved in the development of nonalcoholic steatohepatitis in a dietary murine model. Am J Physiol Gastrointest Liver Physiol 2004;287:G264–73. [DOI] [PubMed] [Google Scholar]
- 11.McGettigan B, McMahan R, Orlicky D, et al. Dietary Lipids Differentially Shape Nonalcoholic Steatohepatitis Progression and the Transcriptome of Kupffer Cells and Infiltrating Macrophages. Hepatology 2019;70:67–83. [DOI] [PMC free article] [PubMed] [Google Scholar]
- 12.Nardo AD, Grun NG, Zeyda M, et al. Impact of osteopontin on the development of non-alcoholic liver disease and related hepatocellular carcinoma. Liver Int 2020;40:1620–1633. [DOI] [PMC free article] [PubMed] [Google Scholar]
- 13.Song Z, Chen W, Athavale D, et al. Osteopontin Takes Center Stage in Chronic Liver Disease. Hepatology 2021;73:1594–1608. [DOI] [PMC free article] [PubMed] [Google Scholar]
- 14.Ge X, Leung TM, Arriazu E, et al. Osteopontin binding to lipopolysaccharide lowers tumor necrosis factor-alpha and prevents early alcohol-induced liver injury in mice. Hepatology 2014;59:1600–16. [DOI] [PMC free article] [PubMed] [Google Scholar]
- 15.Desert R, Ge X, Song Z, et al. Role of Hepatocyte-Derived Osteopontin in Liver Carcinogenesis. Hepatol Commun 2022;6:692–709. [DOI] [PMC free article] [PubMed] [Google Scholar]
- 16.Arriazu E, Ge X, Leung TM, et al. Signalling via the osteopontin and high mobility group box-1 axis drives the fibrogenic response to liver injury. Gut 2017;66:1123–1137. [DOI] [PMC free article] [PubMed] [Google Scholar]
- 17.Urtasun R, Lopategi A, George J, et al. Osteopontin, an oxidant stress sensitive cytokine, up-regulates collagen-I via integrin alpha(V)beta(3) engagement and PI3K/pAkt/NFkappaB signaling. Hepatology 2012;55:594–608. [DOI] [PMC free article] [PubMed] [Google Scholar]
- 18.Wang X, Lopategi A, Ge X, et al. Osteopontin induces ductular reaction contributing to liver fibrosis. Gut 2014;63:1805–18. [DOI] [PubMed] [Google Scholar]
- 19.Wei J, Marisetty A, Schrand B, et al. Osteopontin mediates glioblastoma-associated macrophage infiltration and is a potential therapeutic target. J Clin Invest 2019;129:137–149. [DOI] [PMC free article] [PubMed] [Google Scholar]
- 20.Patouraux S, Rousseau D, Rubio A, et al. Osteopontin deficiency aggravates hepatic injury induced by ischemia-reperfusion in mice. Cell Death Dis 2014;5:e1208. [DOI] [PMC free article] [PubMed] [Google Scholar]
- 21.Clapper JR, Hendricks MD, Gu G, et al. Diet-induced mouse model of fatty liver disease and nonalcoholic steatohepatitis reflecting clinical disease progression and methods of assessment. Am J Physiol Gastrointest Liver Physiol 2013;305:G483–95. [DOI] [PubMed] [Google Scholar]
- 22.Kourepini E, Aggelakopoulou M, Alissafi T, et al. Osteopontin expression by CD103- dendritic cells drives intestinal inflammation. Proc Natl Acad Sci U S A 2014;111:E856–65. [DOI] [PMC free article] [PubMed] [Google Scholar]
- 23.Navarro LA, Wree A, Povero D, et al. Arginase 2 deficiency results in spontaneous steatohepatitis: a novel link between innate immune activation and hepatic de novo lipogenesis. J Hepatol 2015;62:412–20. [DOI] [PMC free article] [PubMed] [Google Scholar]
- 24.Dowling JK, Afzal R, Gearing LJ, et al. Mitochondrial arginase-2 is essential for IL-10 metabolic reprogramming of inflammatory macrophages. Nat Commun 2021;12:1460. [DOI] [PMC free article] [PubMed] [Google Scholar]
- 25.Akie TE, Liu L, Nam M, et al. OXPHOS-Mediated Induction of NAD+ Promotes Complete Oxidation of Fatty Acids and Interdicts Non-Alcoholic Fatty Liver Disease. PLoS One 2015;10:e0125617. [DOI] [PMC free article] [PubMed] [Google Scholar]
- 26.Nardo AD, G NG, Zeyda M,Oberhuber G,Dumanic M,Helbich T,Stulnig TM. Lack of Osteopontin promotes non-alcoholic steatohepatitis (NASH) and fibrosis, but protects against hepatocellular carcinoma (HCC) progression and mortality in a NASH-HCC mouse model. Journal of Hepatology 2018;Volume 68, Supplement 1:S680–S681. [Google Scholar]
- 27.Lea W, Abbas AS, Sprecher H, et al. Long-chain acyl-CoA dehydrogenase is a key enzyme in the mitochondrial beta-oxidation of unsaturated fatty acids. Biochim Biophys Acta 2000;1485:121–8. [DOI] [PubMed] [Google Scholar]
- 28.Zhang Y, Higgins CB, Fortune HM, et al. Hepatic arginase 2 (Arg2) is sufficient to convey the therapeutic metabolic effects of fasting. Nat Commun 2019;10:1587. [DOI] [PMC free article] [PubMed] [Google Scholar]
- 29.De Chiara F, Heeboll S, Marrone G, et al. Urea cycle dysregulation in non-alcoholic fatty liver disease. J Hepatol 2018;69:905–915. [DOI] [PubMed] [Google Scholar]
- 30.Sanyal AJ, Campbell-Sargent C, Mirshahi F, et al. Nonalcoholic steatohepatitis: association of insulin resistance and mitochondrial abnormalities. Gastroenterology 2001;120:1183–92. [DOI] [PubMed] [Google Scholar]
- 31.Clementi E, Brown GC, Feelisch M, et al. Persistent inhibition of cell respiration by nitric oxide: crucial role of S-nitrosylation of mitochondrial complex I and protective action of glutathione. Proc Natl Acad Sci U S A 1998;95:7631–6. [DOI] [PMC free article] [PubMed] [Google Scholar]
- 32.Xu W, Ghosh S, Comhair SA, et al. Increased mitochondrial arginine metabolism supports bioenergetics in asthma. J Clin Invest 2016;126:2465–81. [DOI] [PMC free article] [PubMed] [Google Scholar]
- 33.Su CM, Chiang YC, Huang CY, et al. Osteopontin Promotes Oncostatin M Production in Human Osteoblasts: Implication of Rheumatoid Arthritis Therapy. J Immunol 2015;195:3355–64. [DOI] [PubMed] [Google Scholar]
- 34.Nakamura K, Nonaka H, Saito H, et al. Hepatocyte proliferation and tissue remodeling is impaired after liver injury in oncostatin M receptor knockout mice. Hepatology 2004;39:635–44. [DOI] [PubMed] [Google Scholar]
- 35.Wen Y, Feng D, Wu H, et al. Defective Initiation of Liver Regeneration in Osteopontin-Deficient Mice after Partial Hepatectomy due to Insufficient Activation of IL-6/Stat3 Pathway. Int J Biol Sci 2015;11:1236–47. [DOI] [PMC free article] [PubMed] [Google Scholar]
- 36.Di Maira G, Foglia B, Napione L, et al. Oncostatin M is overexpressed in NASH-related hepatocellular carcinoma and promotes cancer cell invasiveness and angiogenesis. J Pathol 2022;257:82–95. [DOI] [PMC free article] [PubMed] [Google Scholar]
- 37.Foglia B, Sutti S, Pedicini D, et al. Oncostatin M, A Profibrogenic Mediator Overexpressed in Non-Alcoholic Fatty Liver Disease, Stimulates Migration of Hepatic Myofibroblasts. Cells 2019;9. [DOI] [PMC free article] [PubMed] [Google Scholar]
- 38.Komori T, Tanaka M, Senba E, et al. Deficiency of oncostatin M receptor beta (OSMRbeta) exacerbates high-fat diet-induced obesity and related metabolic disorders in mice. J Biol Chem 2014;289:13821–37. [DOI] [PMC free article] [PubMed] [Google Scholar]
- 39.Luo P, Wang PX, Li ZZ, et al. Hepatic Oncostatin M Receptor beta Regulates Obesity-Induced Steatosis and Insulin Resistance. Am J Pathol 2016;186:1278–92. [DOI] [PubMed] [Google Scholar]
- 40.Miller AM, Wang H, Bertola A, et al. Inflammation-associated interleukin-6/signal transducer and activator of transcription 3 activation ameliorates alcoholic and nonalcoholic fatty liver diseases in interleukin-10-deficient mice. Hepatology 2011;54:846–56. [DOI] [PMC free article] [PubMed] [Google Scholar]
- 41.Zhang C, Yue C, Herrmann A, et al. STAT3 Activation-Induced Fatty Acid Oxidation in CD8(+) T Effector Cells Is Critical for Obesity-Promoted Breast Tumor Growth. Cell Metab 2020;31:148–161 e5. [DOI] [PMC free article] [PubMed] [Google Scholar]
- 42.Gal-Oz ST, Maier B, Yoshida H, et al. ImmGen report: sexual dimorphism in the immune system transcriptome. Nat Commun 2019;10:4295. [DOI] [PMC free article] [PubMed] [Google Scholar]
- 43.Wang X, Lu Y, Wang E, et al. Hepatic estrogen receptor alpha improves hepatosteatosis through upregulation of small heterodimer partner. J Hepatol 2015;63:183–90. [DOI] [PubMed] [Google Scholar]
Associated Data
This section collects any data citations, data availability statements, or supplementary materials included in this article.


