

Abstract
Background
Epidemiology of Neisseria gonorrhoeae (NG) infection remains inadequately understood.
Aim
We aimed to characterise NG epidemiology in Europe.
Methods
We used Cochrane and PRISMA guidelines to systematically review, report, synthesise and analyse NG prevalence data from 1949 to 30 September 2021. Random-effects meta-analyses estimated pooled prevalence. Meta-regression analyses investigated associations and sources of heterogeneity.
Results
The 844 included publications yielded 1,573 prevalence measures. Pooled prevalence of current urogenital infection was 1.0% (95% CI: 0.7–1.2%) among general populations, 3.2% (95% CI: 1.8–4.8%) among female sex workers, 4.9% (95% CI: 4.2–5.6%) among sexually transmitted infection clinic attendees and 12.1% (95% CI: 8.8–15.8%) among symptomatic men. Among men who have sex with men, pooled prevalence was 0.9% (95% CI: 0.5–1.4%), 5.6% (95% CI: 3.6–8.1%), and 3.8% (95% CI: 2.5–5.4%), respectively, for current urogenital, anorectal or oropharyngeal infection. Current urogenital, anorectal or oropharyngeal infection was 1.45-fold (95% CI: 1.19–1.77%), 2.75-fold (95% CI: 1.89–4.02%) and 2.64-fold (95% CI: 1.77–3.93%) higher among men than women. Current urogenital infection declined 0.97-fold (95% CI: 0.96–0.98%) yearly, but anorectal and oropharyngeal infection increased (1.02-fold; 95% CI: 1.01–1.04% and 1.02-fold; 95% CI: 1.00–1.04%), respectively.
Conclusions
Neisseria gonorrhoeae epidemiology in Europe has distinct and contrasting epidemiologies for vaginal sex transmission in heterosexual sex networks vs anal and oral sex transmission in MSM sexual networks. Increased transmission may facilitate drug-resistant strain emergence. Europe is far from achieving the World Health Organization target of 90% incidence reduction by 2030.
Keywords: Prevalence, Gonorrhoea, Europe, Synthesis, Region
Introduction
Gonorrhoea is a sexually transmitted infection (STI) caused by the bacterium Neisseria gonorrhoeae (NG), which infects exposed urogenital, anorectal or oropharyngeal mucosa [1,2]. NG infection is typically asymptomatic with most cases being undiagnosed and untreated, especially in women [1-3], leading to complications such as cervicitis, pelvic inflammatory disease, ectopic pregnancy and infertility [1,2,4,5]. In 2016, the global prevalence of NG among adults 15–49 years of age was estimated by the World Health Organization (WHO) at 0.9% in women and 0.7% in men [6]. Reports suggested recent increases in NG infection incidence in several countries in northern and western Europe as well as in North America [7,8].
In alignment with its third Sustainable Development Goal on good health and wellbeing, the WHO formulated its Global Health Sector Strategy on STIs to reduce the burden of STIs as a major public health concern [9,10]. This strategy aims to achieve 90% reduction in NG infection incidence globally by 2030, by increasing access to quality diagnostic, therapeutic and preventive services and by implementing evidence-based interventions. Furthermore, understanding and characterising the epidemiology of NG infection contributes to the broader effort of improving public health and reducing the impact of infectious diseases on individuals and communities.
The global health threat associated with gonorrhoea has intensified over the past two decades due to the widespread occurrence of gonococcal antimicrobial resistance (AMR) and the emergence of extensively drug-resistant NG strains [11-14]. This includes strains resistant to extended-spectrum cephalosporins, which currently serve as the last line of defence against this infection [2,11,12,15]. Consequently, the WHO declared gonococcal AMR a global high priority [16] and initiated a global action plan to control NG transmission [17]. However, recent reports of meningococcal vaccines being partially protective against acquisition of NG [18-21] have spurred optimism for the development of an NG vaccine, which may overcome the AMR setbacks in controlling NG transmission.
Against this background, this study aimed to characterise NG epidemiology in Europe by systematically reviewing and synthesising publications on NG prevalence, estimating pooled mean prevalence and assessing temporal trends of, and associations with, NG prevalence.
Methods
The protocol of this study was not registered in PROSPERO because the methods were adapted from our existing protocol [22] for a systematic review of NG epidemiology in infertile populations [5], and more broadly, from our previously published systematic reviews of the prevalence of other STIs [23-31].
Data sources and search strategy
The systematic literature review was informed by the Cochrane Collaboration Handbook [32], and findings were reported following the Preferred Reporting Items for Systematic Reviews and Meta-analyses (PRISMA) guidelines [33,34]. The 27-item PRISMA checklist, outlining essential elements for reporting in a systematic review, is available in Supplementary Table S1.
The systematic literature search was conducted in PubMed and Embase databases until 30 September 2021, using search strategies with exploded Mesh/Emtree terms, broad search criteria and free text terms with no language or year restrictions. The search strategies for PubMed and Embase are provided in Supplementary Box S1. Definition of Europe included 53 countries and one territory, Greenland, and was informed, along with the subregional classification of countries, by the WHO and United Nations Geoscheme (Box 1) [35,36].
Box 1. List of the 53 countries and one territory included in the definition of Europe along with their subregional classification.
Eastern Europe: Belarus, Bulgaria, Czechia, Hungary, Poland, Republic of Moldova, Romania, Russian Federation, Slovakia and Ukraine.
Northern Europe: Denmark, Estonia, Finland, Greenland, Iceland, Ireland, Latvia, Lithuania, Norway, Sweden and United Kingdom.
Southern Europe: Albania, Andorra, Bosnia and Herzegovina, Croatia, Greece, Italy, Malta, Montenegro, Portugal, North Macedonia, San Marino, Serbia, Slovenia, and Spain.
Western Europe: Austria, Belgium, France, Germany, Luxembourg, Monaco, the Netherlands and Switzerland.
Intersection of Europe and Asia: Armenia, Azerbaijan, Cyprus, Georgia, Kazakhstan, Kyrgyzstan, Tajikistan, Turkmenistan and Uzbekistan.
Israel.
Türkiye.
Study selection and eligibility criteria
Search results were imported into Endnote (Clarivate, Philadelphia, United States), where duplicate records were identified and removed. For the remaining records, titles and abstracts were first screened for potential relevance and then full texts of relevant and potentially relevant publications were retrieved and assessed. At least two reviewers independently screened each record with the screening split among three reviewers (OC, SM and MH). Discrepancies in screening were settled by consensus, including the three reviewers and author LJA.
Grey literature was not systematically searched. However, bibliographies of eligible articles and reviews were screened to identify additional potentially relevant publications. Among these, grey literature reports were eligible for inclusion in the study if they included relevant data.
A publication was eligible for inclusion if it reported data collected based on specimens directly obtained from humans and tested for NG infection using laboratory methods. Any publication that relied on patient self-reporting of infection as a method of diagnosis, included fewer than 10 study participants or tested tissue samples from upper genital tracts was excluded. Case reports, series, commentaries, reviews and qualitative studies were also excluded.
Although a study sample size as small as 10 participants is insufficient for a reliable individual measure of NG prevalence, these smaller studies were still included in this review. This decision was made to ensure inclusivity because the goal was to pool numerous prevalence measures through meta-analysis. While a study with only 10 participants might lack statistical precision on its own, it contributes statistical value when pooled with multiple other studies.
In this review, the term ‘publication’ refers to a document reporting one or more outcome measures (NG prevalence measures), whereas the term ‘study’ specifically pertains to an individual outcome measure. Studies that were duplicated or overlapped were included only once. A study was defined in this manner because a single publication may include several prevalence measures on different populations using different surveys and methods, such as one publication reporting the results of two surveys among two different populations. Since the outcome of this review is the prevalence of infection, it was deemed best to define a study as one prevalence measure in a specific population.
Data extraction and synthesis
Retrieved records and articles were independently extracted and double-extracted with the work split among three authors (OC, SM, and MH). Extracted variables are listed in Supplementary Box S2. Discrepancies were discussed in consultation with LJA to reach consensus. Overall outcome measures (i.e. encompassing the entire sample) and their stratified measures were extracted provided sample size in each stratum was at least 10. Stratification hierarchy for prevalence measures in descending order of priority was: anatomical site, population type, sex, year of data collection, age group and region/city. Definitions of population-type classifications are explained in Box 2. As the study design centred on NG prevalence as the outcome, we did not extract data on resistance prevalence or the number of isolates for NG AMR from the included studies.
Box 2. Definitions of population-type classifications.
General populations (populations at low risk): these include populations at lower risk of exposure to Neisseria gonorrhoeae, such as antenatal clinic attendees, blood donors and pregnant women, among others.
Intermediate-risk populations: these include populations who presumably have frequent sexual contacts with populations engaging in high sexual risk behaviour and have therefore a higher risk of exposure to N. gonorrhoeae than the general population. These comprise people who are incarcerated, people who inject drugs and people driving trucks, among others.
Female sex workers and women who have sex with women: these include reproductive-age women that are engaged in sex work, that is the exchange of sex for money (sex work as a profession) and women who engage in same-sex sexual activities.
Men who have sex with men and male sex workers: these include men who engage in same-sex sexual activities, specifically anal sex, and men who are engaged in providing anal-sex sexual services in return for payment.
Transgender people and transgender sex workers: these include populations whose gender identity is different from the sex that they were assigned at birth and populations with unspecified gender who are engaged in providing sexual services in return for payment.
HIV-positive individuals and individuals in HIV-discordant couples: these include populations who are HIV-positive or are in a spousal relationship with an HIV-positive individual.
Sexually transmitted infection clinic attendees: these include patients attending STI clinics or have clinical manifestations related to an STI.
Infertility clinic attendees: these were included in a separate category given the uncertainty around their risk of exposure to N. gonorrhoeae and the possible biological link between N. gonorrhoeae infection and infertility.
Women with miscarriage or ectopic pregnancy: these were included in a separate category given the uncertainty around their risk of exposure to N. gonorrhoeae and the possible biological link between N. gonorrhoeae infection and miscarriage or ectopic pregnancy.
Symptomatic women: these include women with clinical manifestations related to N. gonorrhoeae infection or suspected of having N. gonorrhoeae infection, such as those with vaginal discharge.
Symptomatic men: these include men with clinical manifestations related to N. gonorrhoeae infection or suspected of having N. gonorrhoeae infection, such as those with urethral discharge.
Symptomatic mixed sexes: these include populations without the sex being specified but with clinical manifestations related to N. gonorrhoeae infection or suspected of having N. gonorrhoeae infection, such as those with vaginal discharge or urethral discharge.
Sexual contacts of persons infected with N. gonorrhoeae or Chlamydia trachomatis: these include populations who are in sexual contact with persons infected with N. gonorrhoeae and/or C. trachomatis.
Patients with confirmed/suspected STIs and related infections: these include populations who are diagnosed with an STI or suspected to have concomitanta STIs or other related infections.
Other populations: these include populations not satisfying above definitions, or populations with an undetermined risk of acquiring N. gonorrhoeae such as cervical cancer patients, victims of sexual assault, specimens from virology/bacteriology laboratory and requesting home-based N. gonorrhoeae or C. trachomatis testing.
STI: sexually transmitted infection.
a Includes, for example, patients with suspected NG, patients with suspected STI and patients with suspected genital tract infection.
Since the aim was to understand the natural heterogeneity that exists in NG epidemiology, such as the variation in prevalence by population type and anatomical site, both overall measures and stratified measures were extracted from relevant studies. Meta-regression analyses were conducted to estimate effects of epidemiological factors on prevalence of infection (note below). This analytical approach allows the generation of concrete inferences about the epidemiology of this infection based on understanding the sources of variation that exist in available measures.
Studies that used different assays on the same biological specimens were extracted and pooled separately in the meta-analysis to estimate NG prevalence by diagnostic method. These data were also incorporated into the meta-regression analyses to investigate the effects of diagnostic methods on observed NG prevalence. This approach was adopted to examine the assay impact on the heterogeneity of NG prevalence and to generate STI-estimation adjustment factors based on assay type. These factors can inform future mathematical modelling studies forecasting NG infection and disease burden metrics [37-39].
Studies reporting the same diagnostic test on different biological specimens in a defined population were included only once based on a pre-set stratification hierarchy for women (endocervical swabs, followed by vaginal swabs and urine samples) and for men (urethral swabs, followed by urine and semen samples) [23].
Precision and risk of bias assessments
The precision and risk of bias (ROB) assessments of the included studies were guided by the Cochrane approach [32], pertinent quality components in prevalence studies [40] and a methodology honed through a series of systematic reviews focusing on STI prevalence [5,22-31]. This methodology, tailored and refined for the research questions in the present study, comprised one component for study precision and two components for ROB.
Other components were excluded, either because they were inherently met by our study design and inclusion/exclusion criteria, or because they were investigated under a different but more relevant research question within our study, as explained in Supplementary Table S2. For instance, the assessment of the validity and reliability of the study instrument measuring the parameter of interest [40] was implicitly implemented through the meta-regression analyses (note below), where we explored the impact of assay type on observed prevalence.
A study’s precision was classified as low vs high, based on the study sample size (< 200 vs ≥ 200). For an expected NG prevalence of ca 1% in the general population and a sample size of 200, the 95% confidence interval (CI) is 0–3.6% [41], which provides an acceptable level of precision for a prevalence measure [23]. Studies were classified as having low vs high ROB based on the following two domains: sampling methodology (probability vs non-probability-based sampling) and response rate (≥ 80% vs < 80%). Data on precision and ROB were used to provide summary statistics of the precision and ROB of studies. These data were also included in the meta-regression analyses to investigate their effects on observed prevalence.
Meta-analyses
Dersimonian–Laird random-effects models were used to conduct meta-analyses [42] with the Freeman–Tukey double arcsine transformation to stabilise the variance [43] after ensuring the applicability of this transformation [44]. Pooled estimates for NG prevalence were calculated if each analysis stratum had at least three measures. Given the application of random-effects meta-analysis, a minimum count of three studies was set to conduct a meta-analysis, for the stability of the pooled estimate. Considering heterogeneity in prevalence measures, these pooled means are meant to provide an average summary measure of prevalence for each population and anatomical site. The sources of heterogeneity were investigated through meta-regression analyses as indicated below.
Cochran’s Q statistic was used to examine the presence of heterogeneity across studies. The I2 statistic was calculated to assess the magnitude of between-study variation due to true differences in prevalence rather than sampling variation. The prediction interval was estimated to describe the distribution of true prevalence around the pooled mean [42,45].
Cumulative meta-analyses, using the year of publication as the ordering variable, were also conducted to confirm the trend in NG prevalence generated by the meta-regression analyses. All meta-analyses were conducted in R version 4.1.2 [46] using the meta package [47].
Meta-regressions
Univariable and multivariable random-effects meta-regression analyses of log-transformed proportions were conducted to investigate the sources of between-study heterogeneity and possible predictors of higher NG prevalence. These predictors were set a priori based on epidemiological relevance and knowledge of HIV or STI epidemiology [5,23,24,30,31]. Predictors are listed in Supplementary Box S3.
Sensitivity analyses were performed (i) to validate findings from the main analyses, where, for each anatomical site, the year of publication was incorporated into the models instead of the year of data collection; and (ii) to examine whether the results differed based on different diagnostic methods. Here, for each of the urogenital, anorectal and oropharyngeal datasets, the meta-regression analyses were re-run separately for the NAAT/PCR, culture and Gram staining datasets, totalling nine additional meta-regression analyses.
Variables with a p value ≤ 0.10 in the univariable analysis were included in the multivariable analysis. Associations in the multivariable analysis with a p value ≤ 0.05 were considered to provide evidence of statistically significant associations. Meta-regressions were conducted in Stata/SE version 16.1 using the metareg package [48].
Results
Search results
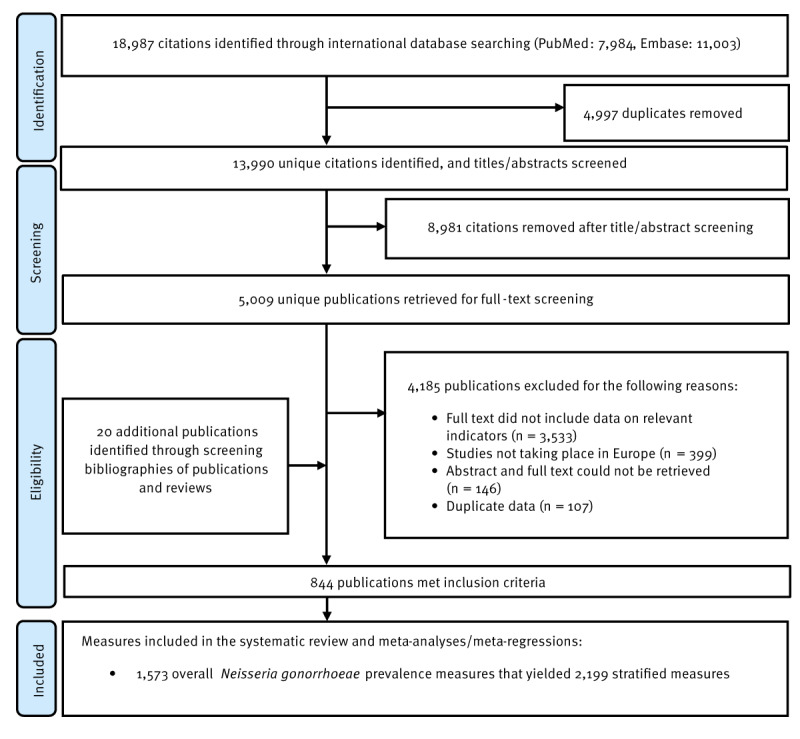
The study selection process is illustrated in the Figure. A total of 18,987 records were identified, 7,984 from PubMed and 11,003 from Embase. After de-duplication and title and abstract screening, 5,009 unique citations were identified as relevant or potentially relevant for further screening. Full text screening of these citations identified 824 relevant publications. Bibliographic screening of eligible articles and reviews yielded 20 additional publications. In total, 844 publications met the inclusion criteria (these publications are listed in Supplementary Box S4). Extracted NG prevalence measures included 1,573 overall measures and 2,199 stratified measures.
Apart from 28 prevalence measures, 1,545 measures pertained to current NG infection, assessing current urogenital, anorectal or oropharyngeal NG prevalence. The remaining 28 studies assessed ever infection prevalence through serological testing.
Figure.
Flowchart of article selection for the systematic review of Neisseria gonorrhoeae infection in World Health Organization European Region countries, 1949–2021
Selection was carried out as per PRISMA guidelines [34].
Scope of evidence for the prevalence measures
The earliest extracted study was published in 1949, and 507 studies (32.2%) were published before 2000, 226 studies (14.4%) between 2000 and 2009, and 840 studies (53.4%) starting from 2010. Most studies were based on convenience sampling (n = 1,519, 96.6%). The included studies encompassed various study designs, including cross-sectional (n = 1,470), case–control (n = 53), cohort (n = 29) and randomised controlled trials (n = 21). In the case of the latter two study designs, the included prevalence measures refer to the baseline measurements conducted at the beginning of the respective studies.
The number of NG prevalence measures categorised by European subregion and country are listed in Supplementary Table S3. The stratified NG prevalence measures are summarised by population type, anatomical site and assay type in Table 1, Table 2 and Table 3, including ranges and medians.
Table 1. Pooled estimates for Neisseria gonorrhoeae prevalence in general populations, intermediate-risk populations, infertility clinic attendees and other populations, World Health Organization European Region countries, 1949–2021.
| Population type | Outcome measures | Sample size | NG prevalence (%) | Pooled NG prevalence | Heterogeneity measures | |||||||
|---|---|---|---|---|---|---|---|---|---|---|---|---|
| Total n |
Total n |
Range | Median | Mean (%) | 95% CI | Cochran’s Q statistica | I2b | Prediction intervalc (%) | ||||
| Q | p-value | I2 (%) | 95% CI | |||||||||
| General populations | ||||||||||||
| Current urogenital infection | NAAT/PCR | 133 | 246,316 | 0.0–15.9 | 0.7 | 1.3 | 0.9–1.7 | 4,665.4 | p < 0.001 | 97.2 | 96.9–97.4 | 0.0–9.0 |
| Culture | 110 | 387,709 | 0.0–13.0 | 0.5 | 0.7 | 0.5–1.0 | 6,669.6 | p < 0.001 | 98.4 | 98.2–98.5 | 0.0–5.0 | |
| Gram staining | 6 | 3,573 | 0.0–4.5 | 1.7 | 1.4 | 0.1–3.5 | 57.9 | p < 0.001 | 91.4 | 84.0–95.3 | 0.0–11.6 | |
| Otherd | 13 | 7,315 | 0.0–0.8 | 0.2 | 0.4 | 0.2–0.6 | 8.5 | p = 0.745 | 0.0 | 0.0–56.6 | 0.1–1.0 | |
| Overall | 262 | 644,913 | 0.0–15.9 | 0.6 | 1.0 | 0.7–1.2 | 12,242.7 | p < 0.001 | 97.9 | 97.7–98.0 | 0.0–6.9 | |
| Current anorectal infection | NAAT/PCR | 2 | 499 | 2.9–5.4 | 4.2 | 4.0 | 1.9–6.8 | NA | NA | NA | ||
| Culture | 1e | 759 | NA | NA | 0.4 | 0.1–1.0 | NA | NA | NA | |||
| Overall | 3 | 1,258 | 0.4–5.4 | 2.9 | 2.3 | 0.2–6.3 | 24.3 | p < 0.001 | 91.8 | 79.0–96.8 | 0.0–97.1 | |
| Current oropharyngeal infection | NAAT/PCR | 3 | 475 | 0.0–4.4 | 0.0 | 0.9 | 0.0–4.6 | 12.8 | p = 0.002 | 84.4 | 53.3–94.8 | 0.0–99.4 |
| Overall | 3 | 475 | 0.0–4.4 | 0.0 | 0.9 | 0.0–4.6 | 12.8 | p = 0.002 | 84.4 | 53.3–94.8 | 0.0–99.4 | |
| Unspecified/mixed anatomical site | NAAT/PCR | 28 | 297,953 | 0.0–4.9 | 1.0 | 0.9 | 0.6–1.3 | 901.4 | p < 0.001 | 97.0 | 96.4–97.5 | 0.0–3.4 |
| Culture | 33 | 1,763,032 | 0.0–2.7 | 0.6 | 0.5 | 0.3–0.8 | 14,871.0 | p < 0.001 | 99.8 | 99.8–99.8 | 0.0–2.4 | |
| Gram staining | 1e | 100 | NA | NA | 0.0 | 0.0–1.7 | NA | NA | NA | |||
| Otherd | 62 | 5,521,391 | 0.0–8.0 | 0.6 | 0.6 | 0.3–0.9 | 6,897.5 | p < 0.001 | 99.1 | 99.0–99.2 | 0.0–4.7 | |
| Overall | 125 | 7,582,476 | 0.0–8.0 | 0.7 | 0.6 | 0.4–0.8 | 36,040.4 | p < 0.001 | 99.7 | 99.6–99.7 | 0.0–3.6 | |
| Sera | Blood tested for antibodies | 13 | 1,780 | 0.5–51.4 | 11.1 | 11.4 | 5.3–19.2 | 246.9 | p < 0.001 | 95.1 | 93.2–96.5 | 0.0–48.9 |
| Intermediate-risk populations | ||||||||||||
| Current urogenital infection | NAAT/PCR | 16 | 5,169 | 0.0–30.4 | 0.5 | 3.1 | 0.5–7.6 | 607.6 | p < 0.001 | 97.5 | 96.8–98.1 | 0.0–33.8 |
| Culture | 7 | 916 | 0.0–15.4 | 0.0 | 1.3 | 0.0–5.0 | 44.1 | p < 0.001 | 86.4 | 74.1–92.8 | 0.0–20.7 | |
| Otherd | 1e | 474 | NA | NA | 0.2 | 0.0–0.9 | NA | NA | NA | |||
| Overall | 24 | 6,559 | 0.0–30.4 | 0.2 | 2.4 | 0.5–5.2 | 680.5 | p < 0.001 | 96.6 | 95.8–97.3 | 0.0–25.7 | |
| Current anorectal infection | NAAT/PCR | 2e | 141 | 0.0–21.7 | 10.9 | 5.7 | 0.0–41.9 | NA | NA | NA | ||
| Overall | 2e | 141 | 0.0–21.7 | 10.9 | 5.7 | 0.0–41.9 | NA | NA | NA | |||
| Current oropharyngeal infection | NAAT/PCR | 1e | 23 | NA | NA | 17.4 | 4.2–36.0 | NA | NA | NA | ||
| Overall | 1e | 23 | NA | NA | 17.4 | 4.2–36.0 | NA | NA | NA | |||
| Unspecified/mixed anatomical site | NAAT/PCR | 2e | 2,816 | 0.2–1.0 | 0.6 | 0.5 | 0.0–1.6 | NA | NA | NA | ||
| Culture | 3 | 443 | 1.3–4.6 | 2.2 | 2.4 | 0.8–4.8 | 3.3 | p = 0.195 | 38.7 | 0.0–80.9 | 0.0–48.7 | |
| Otherd | 4 | 647 | 0.0–3.1 | 0.0 | 0.3 | 0.0–1.7 | 9.4 | p = 0.050 | 67.9 | 6.8–89.0 | 0.0–13.2 | |
| Overall | 9 | 3,906 | 0.0–4.6 | 1.0 | 0.8 | 0.1–1.9 | 33.2 | p < 0.001 | 75.9 | 53.8–87.5 | 0.0–5.8 | |
| Sera | Blood tested for antibodies | 1e | 10 | NA | NA | 0.0 | 0.0–16.5 | NA | NA | NA | ||
| Infertility clinic attendees | ||||||||||||
| Current urogenital infection | NAAT/PCR | 10 | 1,023 | 0.0–0.7 | 0.0 | 0.0 | 0.0–0.2 | 3.1 | p = 0.962 | 0.0 | 0.0–62.4 | 0.0–0.3 |
| Culture | 34 | 5,125 | 0.0–33.3 | 0.0 | 1.2 | 0.2–2.9 | 571.1 | p < 0.001 | 94.2 | 92.8–95.3 | 0.0–17.7 | |
| Otherd | 7 | 1,002 | 0.0–23.8 | 0.0 | 3.5 | 0.0–10.6 | 65.2 | p < 0.001 | 90.8 | 83.6–94.8 | 0.0–39.9 | |
| Overall | 51 | 7,150 | 0.0–33.3 | 0.0 | 1.1 | 0.3–2.4 | 704.6 | p < 0.001 | 92.9 | 91.4–94.1 | 0.0–15.7 | |
| Unspecified/mixed anatomical site | Otherd | 5 | 1,199 | 3.4–62.2 | 7.0 | 18.5 | 3.0–42.7 | 361.0 | p < 0.001 | 98.9 | 98.4–99.2 | 0.0–99.7 |
| Overall | 5 | 1,199 | 3.4–62.2 | 7.0 | 18.5 | 3.0–42.7 | 361.0 | p < 0.001 | 98.9 | 98.4–99.2 | 0.0–99.7 | |
| Sera | Blood tested for antibodies | 9 | 759 | 0.0–60.6 | 14.5 | 16.0 | 5.7–29.8 | 107.9 | p < 0.001 | 92.6 | 88.1–95.4 | 0.0–72.7 |
| Other populationsf | ||||||||||||
| Current urogenital infection | NAAT/PCR | 17 | 21,639 | 0.0–12.0 | 2.7 | 3.7 | 2.2–5.5 | 526.5 | p < 0.001 | 97.0 | 96.1–97.6 | 0.0–14.2 |
| Culture | 8 | 2,076 | 0.0–44.1 | 7.5 | 8.3 | 1.1–20.8 | 200.4 | p < 0.001 | 96.5 | 94.8–97.7 | 0.0–66.6 | |
| Overall | 25 | 23,715 | 0.0–44.1 | 2.7 | 4.7 | 2.4–7.7 | 822.3 | p < 0.001 | 97.1 | 96.4–97.6 | 0.0–26.8 | |
| Current anorectal infection | NAAT/PCR | 6 | 1,295 | 1.0–30.0 | 8.2 | 5.6 | 1.3–11.9 | 45.8 | p < 0.001 | 89.1 | 78.9–94.4 | 0.0–33.4 |
| Culture | 1e | 53 | NA | NA | 0.0 | 0.0–3.2 | NA | NA | NA | |||
| Overall | 7 | 1,348 | 0.0–30.0 | 7.0 | 4.4 | 0.8–10.0 | 47.5 | p < 0.001 | 87.4 | 76.2–93.3 | 0.0–29.3 | |
| Current oropharyngeal infection | NAAT/PCR | 6 | 1,376 | 0.7–50.0 | 5.6 | 6.9 | 0.6–18.0 | 60.7 | p < 0.001 | 91.8 | 84.8–95.5 | 0.0–59.4 |
| Culture | 1e | 61 | NA | NA | 0.0 | 0.0–2.8 | NA | NA | NA | |||
| Overall | 7 | 1,437 | 0.0–50.0 | 4.5 | 5.3 | 0.3–14.4 | 63.1 | p < 0.001 | 90.5 | 83.0–94.7 | 0.0–49.4 | |
| Unspecified/mixed anatomical site | NAAT/PCR | 4 | 5,182 | 0.0–16.0 | 1.8 | 3.4 | 0.0–11.5 | 141.9 | p < 0.001 | 97.9 | 96.5–98.7 | 0.0–65.7 |
| Culture | 4 | 209 | 2.2–16.7 | 4.4 | 5.3 | 1.0–11.8 | 7.4 | p = 0.061 | 59.2 | 0.0–86.4 | 0.0–41.3 | |
| Otherd | 5 | 90,865 | 0.1–22.4 | 2.1 | 4.1 | 0.0–14.0 | 724.6 | p < 0.001 | 99.4 | 99.3–99.6 | 0.0–61.8 | |
| Overall | 13 | 96,256 | 0.0–22.4 | 2.3 | 4.1 | 1.2–8.4 | 1,088.3 | p < 0.001 | 98.9 | 98.6–99.1 | 0.0–28.1 | |
| Sera | Blood tested for antibodies | 3 | 504 | 12.9–34.0 | 16.5 | 18.8 | 9.4–30.3 | 7.8 | p = 0.020 | 74.3 | 14.5–92.3 | 0.0–100.0 |
CI: confidence interval; NA: not applicable; NAAT: nucleic acid amplification test; NG: Neisseria gonorrhoeae.
The main results have been bolded to emphasise them and to align them with the corresponding discussions in the results section.
a Q: the Cochran’s Q statistic is a measure assessing the existence of heterogeneity in pooled outcome measures, here NG prevalence.
b I2: a measure that assesses the magnitude of between-study variation that is due to actual differences in NG prevalence across studies rather than chance.
c Prediction interval: a measure that estimates the distribution (95% interval) of true NG prevalence around the estimated mean.
d Other assays include unclear testing technique, enzyme immunoassay, complement fixation or mixed testing techniques.
e No meta-analysis was done due to the small number of studies (n < 3).
f Other populations include populations with an undetermined risk of acquiring Neisseria gonorrhoeae infection such as patients with cervical cancer, victims of sexual assault, specimens from virology/bacteriology laboratory and requesting home-based N. gonorrhoeae or Chlamydia trachomatis testing.
Table 2. Pooled estimates for Neisseria gonorrhoeae prevalence in populations at high-risk of infection, HIV-positive individuals and sexually transmitted infection clinic attendees in World Health Organization European Region countries, 1949–2021.
| Population type | Outcome measures | Sample size | NG prevalence (%) | Pooled NG prevalence | Heterogeneity measures | |||||||
|---|---|---|---|---|---|---|---|---|---|---|---|---|
| Total n |
Total n |
Range | Median | Mean (%) | 95% CI | Cochran’s Q statistica | I2b | Prediction intervalc (%) | ||||
| Q | p-value | I2 (%) | 95% CI | |||||||||
| FSWs | ||||||||||||
| Current urogenital infection | NAAT/PCR | 17 | 4,329 | 0.0–66.7 | 2.9 | 1.9 | 0.7–3.5 | 79.6 | p < 0.001 | 79.9 | 68.6–87.1 | 0.0–10.1 |
| Culture | 7 | 2,735 | 0.0–14.0 | 5.8 | 4.3 | 1.4–8.4 | 27.9 | p < 0.001 | 78.5 | 55.7–89.6 | 0.0–21.7 | |
| Gram staining | 2e | 253 | 0.0–10.2 | 5.1 | 3.0 | 0.0–20.4 | NA | NA | NA | |||
| Otherd | 5 | 2,704 | 1.0–16.2 | 6.2 | 6.0 | 1.6–12.4 | 90.3 | p < 0.001 | 95.6 | 92.2–97.5 | 0.0–38.2 | |
| Overall | 31 | 10,021 | 0.0–66.7 | 3.6 | 3.2 | 1.8–4.8 | 318.5 | p < 0.001 | 90.6 | 87.7–92.8 | 0.0–14.8 | |
| Current anorectal infection | NAAT/PCR | 3 | 2,091 | 1.4–1.8 | 1.4 | 1.5 | 1.0–2.0 | 0.5 | p = 0.798 | 0.0 | 0.0–89.6 | 0.0–6.7 |
| Culture | 1e | 299 | NA | NA | 0.0 | 0.0–0.6 | NA | NA | NA | |||
| Otherd | 1e | 50 | NA | NA | 12.0 | 4.2–22.7 | NA | NA | NA | |||
| Overall | 5 | 2,440 | 0.0–12.0 | 1.4 | 1.7 | 0.1–5.0 | 22.6 | p < 0.001 | 82.3 | 59.4–92.3 | 0.0–21.2 | |
| Current oropharyngeal infection | NAAT/PCR | 5 | 2,600 | 0.5–9.0 | 1.5 | 2.4 | 0.5–5.5 | 41.5 | p < 0.001 | 90.4 | 80.4–95.3 | 0.0–19.2 |
| Culture | 1e | 299 | NA | NA | 0.0 | 0.0–0.6 | NA | NA | NA | |||
| Otherd | 1e | 50 | NA | NA | 14.0 | 5.6–25.2 | NA | NA | NA | |||
| Overall | 7 | 2,949 | 0.0–14.0 | 1.5 | 2.6 | 0.4–6.3 | 69.7 | p < 0.001 | 91.4 | 84.8–95.1 | 0.0–21.7 | |
| Unspecified/mixed anatomical site | Otherd | 15 | 19,629 | 1.1–36.3 | 4.0 | 6.5 | 2.9–11.2 | 1,022.6 | p < 0.001 | 98.6 | 98.3–98.9 | 0.0–34.3 |
| Overall | 15 | 19,629 | 1.1–36.3 | 4.0 | 6.5 | 2.9–11.2 | 1,022.6 | p < 0.001 | 98.6 | 98.3–98.9 | 0.0–34.3 | |
| MSM and MSWs | ||||||||||||
| Current urogenital infection | NAAT/PCR | 14 | 4,564 | 0.0–4.0 | 1.2 | 0.9 | 0.4–1.4 | 21.7 | p = 0.061 | 40.0 | 0.0–68.1 | 0.0–2.5 |
| Otherd | 1e | 1,832 | NA | NA | 1.5 | 1.0–2.2 | NA | NA | NA | |||
| Overall | 15 | 6,396 | 0.0–4.0 | 1.3 | 0.9 | 0.5–1.4 | 22.5 | p = 0.070 | 37.7 | 0.0–66.3 | 0.1–2.3 | |
| Current anorectal infection | NAAT/PCR | 11 | 6,095 | 3.4–14.0 | 4.6 | 5.8 | 4.1–7.7 | 53.5 | p < 0.001 | 81.3 | 67.6–89.2 | 1.0–13.8 |
| Otherd | 3 | 3,758 | 0.4–15.4 | 4.5 | 5.0 | 0.1–16.5 | 168.7 | p < 0.001 | 98.8 | 98.0–99.3 | 0.0–100.0 | |
| Overall | 14 | 9,853 | 0.4–15.4 | 4.5 | 5.6 | 3.6–8.1 | 257.0 | p < 0.001 | 94.9 | 93.0–96.4 | 0.1–18.0 | |
| Current oropharyngeal infection | NAAT/PCR | 12 | 6,548 | 0.0–14.2 | 5.4 | 5.2 | 3.6–7.1 | 52.9 | p < 0.001 | 79.2 | 64.4–87.9 | 0.7–12.9 |
| Culture | 1e | 239 | NA | NA | 2.5 | 0.8–5.0 | NA | NA | NA | |||
| Otherd | 5 | 4,568 | 0.5–4.9 | 1.3 | 1.9 | 0.7–3.7 | 82.4 | p < 0.001 | 95.1 | 91.3–97.3 | 0.0–11.6 | |
| Overall | 18 | 11,355 | 0.0–14.2 | 4.0 | 3.8 | 2.5–5.4 | 231.3 | p < 0.001 | 92.6 | 89.8–94.7 | 0.0–12.3 | |
| Unspecified/mixed anatomical site | NAAT/PCR | 14 | 15,840 | 0.0–69.6 | 10.7 | 11.7 | 5.7–19.4 | 345.5 | p < 0.001 | 96.2 | 94.9–97.2 | 0.0–50.8 |
| Otherd | 1e | 1,235 | 10.0–42.9 | 26.5 | 24.4 | 1.6–61.7 | NA | NA | NA | |||
| Overall | 16 | 17,075 | 0.0–69.6 | 10.7 | 13.2 | 7.0–20.8 | 484.0 | p < 0.001 | 96.9 | 96.0–97.6 | 0.0–53.7 | |
| Transgender people and transgender sex workers | ||||||||||||
| Current urogenital infection | NAAT/PCR | 1e | 40 | NA | NA | 0.0 | 0.0–4.3 | NA | NA | NA | ||
| Overall | 1e | 40 | NA | NA | 0.0 | 0.0–4.3 | NA | NA | NA | |||
| Current anorectal infection | NAAT/PCR | 1e | 40 | NA | NA | 0.0 | 0.0–4.3 | NA | NA | NA | ||
| Overall | 1e | 40 | NA | NA | 0.0 | 0.0–4.3 | NA | NA | NA | |||
| Current oropharyngeal infection | NAAT/PCR | 1e | 40 | NA | NA | 2.5 | 0.0–10.4 | NA | NA | NA | ||
| Overall | 1e | 40 | NA | NA | 2.5 | 0.0–10.4 | NA | NA | NA | |||
| Unspecified/mixed anatomical site | NAAT/PCR | 1e | 14 | NA | NA | 0.0 | 0.0–11.9 | NA | NA | NA | ||
| Overall | 1e | 14 | NA | NA | 0.0 | 0.0–11.9 | NA | NA | NA | |||
| HIV-positive individuals and individuals in HIV-discordant couples | ||||||||||||
| Current urogenital infection | NAAT/PCR | 15 | 3,753 | 0.0–2.0 | 0.0 | 0.3 | 0.0–0.7 | 28.4 | p = 0.013 | 50.7 | 10.9–72.8 | 0.0–2.0 |
| Culture | 1e | 85 | NA | NA | 0.0 | 0.0–2.0 | NA | NA | NA | |||
| Otherd | 3 | 1,231 | 0.0–4.2 | 3.2 | 1.8 | 0.0–6.0 | 29.6 | p < 0.001 | 93.2 | 83.6–97.2 | 0.0–99.9 | |
| Overall | 19 | 5,069 | 0.0–4.2 | 0.0 | 0.5 | 0.1–1.0 | 74.3 | p < 0.001 | 75.8 | 62.3–84.4 | 0.0–3.6 | |
| Current anorectal infection | NAAT/PCR | 16 | 3,761 | 0.0–21.4 | 2.7 | 3.4 | 2.1–4.9 | 61.7 | p < 0.001 | 75.7 | 60.5–85.0 | 0.0–10.3 |
| Otherd | 5 | 911 | 0.0–26.6 | 22.0 | 10.5 | 0.8–27.4 | 158.1 | p < 0.001 | 97.5 | 95.9–98.4 | 0.0–85.1 | |
| Overall | 21 | 4,672 | 0.0–26.6 | 3.0 | 4.5 | 2.2–7.4 | 221.4 | p < 0.001 | 91.0 | 87.6–93.4 | 0.0–23.0 | |
| Current oropharyngeal infection | NAAT/PCR | 12 | 2,907 | 0.0–8.0 | 2.3 | 2.4 | 1.7–3.1 | 16.6 | p = 0.120 | 33.7 | 0.0–66.6 | 1.2–4.0 |
| Culture | 1e | 264 | NA | NA | 9.5 | 6.2–13.3 | NA | NA | NA | |||
| Otherd | 1e | 339 | NA | NA | 0.0 | 0.0–0.5 | NA | NA | NA | |||
| Overall | 14 | 3,510 | 0.0–9.5 | 2.3 | 2.3 | 1.1–3.8 | 66.5 | p < 0.001 | 80.5 | 68.1–88.0 | 0.0–9.4 | |
| Unspecified/mixed anatomical site | NAAT/PCR | 1e | 174 | NA | NA | 11.5 | 7.1–16.7 | NA | NA | NA | ||
| Culture | 4 | 1,353 | 1.4–3.6 | 2.6 | 2.1 | 1.0–3.4 | 4.6 | p = 0.201 | 35.1 | 0.0–77.4 | 0.0–8.2 | |
| Otherd | 23 | 19,819 | 0.0–65.0 | 11.3 | 11.2 | 5.1–19.1 | 3,225.1 | p < 0.001 | 99.3 | 99.2–99.4 | 0.0–62.3 | |
| Overall | 28 | 21,346 | 0.0–65.0 | 7.3 | 9.5 | 4.7–15.8 | 3,256.9 | p < 0.001 | 99.2 | 99.1–99.3 | 0.0–55.0 | |
| Sera | Blood tested for antibodies | 1e | 24 | NA | NA | 4.2 | 0.0–17.0 | NA | NA | NA | ||
| STI clinic attendees | ||||||||||||
| Current urogenital infection | NAAT/PCR | 154 | 1,125,284 | 0.0–36.4 | 2.1 | 2.7 | 2.2–3.3 | 11,248.8 | p < 0.001 | 98.6 | 98.6–98.7 | 0.0–13.5 |
| Culture | 154 | 545,153 | 0.0–63.6 | 5.1 | 6.8 | 5.5–8.2 | 17,349.6 | p < 0.001 | 99.1 | 99.1–99.2 | 0.0–30.8 | |
| Gram staining | 16 | 241,508 | 0.1–32.5 | 12.5 | 10.9 | 5.5–17.9 | 9,370.6 | p < 0.001 | 99.8 | 99.8–99.9 | 0.0–49.7 | |
| Otherd | 50 | 50,461 | 0.0–32.0 | 4.6 | 5.4 | 3.7–7.4 | 1,826.3 | p < 0.001 | 97.3 | 96.9–97.7 | 0.0–24.5 | |
| Overall | 374 | 1,962,406 | 0.0–63.6 | 3.7 | 4.9 | 4.2–5.6 | 53,523.5 | p < 0.001 | 99.3 | 99.3–99.3 | 0.0–24.4 | |
| Current anorectal infection | NAAT/PCR | 59 | 576,033 | 0.0–36.9 | 4.2 | 4.2 | 2.9–5.6 | 14,357.1 | p < 0.001 | 99.6 | 99.6–99.6 | 0.0–19.5 |
| Culture | 48 | 120,628 | 0.0–29.2 | 4.2 | 4.4 | 3.1–5.8 | 4,137.9 | p < 0.001 | 98.9 | 98.7–99.0 | 0.0–17.2 | |
| Gram staining | 3 | 9,462 | 5.2–10.1 | 6.6 | 6.4 | 5.9–7.0 | 3.5 | p = 0.178 | 42.0 | 0.0–82.4 | 3.1–10.8 | |
| Otherd | 27 | 33,419 | 1.4–22.7 | 5.2 | 6.2 | 4.6–8.1 | 628.8 | p < 0.001 | 95.9 | 94.8–96.7 | 0.3–18.2 | |
| Overall | 137 | 739,542 | 0.0–36.9 | 4.4 | 4.7 | 3.9–5.5 | 22,200.9 | (p < 0.001) | 99.4 | 99.4–99.4 | 0.0–18.1 | |
| Current oropharyngeal infection | NAAT/PCR | 54 | 345,007 | 0.0–90.6 | 4.3 | 6.0 | 3.6–8.9 | 30,245.8 | p < 0.001 | 99.8 | 99.8–99.8 | 0.0–37.4 |
| Culture | 35 | 28,685 | 0.0–13.2 | 1.9 | 2.2 | 1.3–3.3 | 547.6 | p < 0.001 | 93.8 | 92.3–95.0 | 0.0–10.4 | |
| Gram staining | 3 | 2,544 | 1.6–3.4 | 1.7 | 1.6 | 1.1–2.2 | 1.9 | p = 0.390 | 0.0 | 0.0–89.6 | 0.0–6.7 | |
| Otherd | 15 | 18,135 | 0.7–20.1 | 5.4 | 6.8 | 4.3–9.7 | 244.5 | p < 0.001 | 94.3 | 92.0–95.9 | 0.1–21.6 | |
| Overall | 107 | 394,371 | 0.0–90.6 | 3.6 | 4.7 | 3.4–6.1 | 32,161.7 | p < 0.001 | 99.7 | 99.7–99.7 | 0.0–26.7 | |
| Unspecified/mixed anatomical site | NAAT/PCR | 67 | 551,158 | 0.0–27.2 | 2.1 | 3.2 | 2.4–4.1 | 8,803.5 | p < 0.001 | 99.3 | 99.2–99.3 | 0.0–13.8 |
| Culture | 182 | 3,062,427 | 0.0–56.8 | 7.0 | 8.5 | 7.1–10.0 | 67,565.5 | p < 0.001 | 99.7 | 99.7–99.7 | 0.0–36.0 | |
| Gram staining | 1e | 3,179 | NA | NA | 7.0 | 6.1–7.9 | NA | NA | NA | |||
| Otherd | 163 | 4,859,245 | 0.0–81.3 | 4.0 | 7.7 | 6.2–9.4 | 84,540.2 | p < 0.001 | 99.8 | 99.8–99.8 | 0.0–36.9 | |
| Overall | 413 | 8,476,009 | 0.0–81.3 | 4.8 | 7.2 | 6.3–8.1 | 230,664.4 | p < 0.001 | 99.8 | 99.8–99.8 | 0.0–33.2 | |
| Sera | Blood tested for antibodies | 4 | 989 | 25.8–79.2 | 28.6 | 40.3 | 16.7–66.6 | 136.0 | p < 0.001 | 97.8 | 96.3–98.7 | 0.0–100.0 |
CI: confidence interval; FSWs: female sex workers; MSM: men who have sex with men; MSWs: male sex workers; NA: not applicable; NAAT: nucleic acid amplification test; NG: Neisseria gonorrhoeae; STI: sexually transmitted infection.
The main results have been bolded to emphasize them and to align them with the corresponding discussions in the results section.
a Q: the Cochran’s Q statistic is a measure assessing the existence of heterogeneity in pooled outcome measures, here NG prevalence.
b I2: a measure that assesses the magnitude of between-study variation that is due to actual differences in NG prevalence across studies rather than chance.
c Prediction interval: a measure that estimates the distribution (95% interval) of true NG prevalence around the estimated mean.
d Other assays include unclear testing technique, enzyme immunoassay, complement fixation or mixed testing techniques.
e No meta-analysis was done due to the small number of studies (n < 3).
Table 3. Pooled estimates for Neisseria gonorrhoeae prevalence in symptomatic populations, sexual contacts of persons infected with Neisseria gonorrhoeae or Chlamydia trachomatis and patients with confirmed or suspected sexually transmitted infections and related infections in World Health Organization European Region countries, 1949–2021.
| Population type | Outcome measures | Sample size | NG prevalence (%) | Pooled NG prevalence | Heterogeneity measures | ||||||||
|---|---|---|---|---|---|---|---|---|---|---|---|---|---|
| Total n |
Total n |
Range | Median | Mean (%) | 95% CI | Cochran’s Q statistica | I2b | Prediction intervalc (%) | |||||
| Q | p-value | I2 (%) | 95% CI | ||||||||||
| Symptomatic women | |||||||||||||
| Current urogenital infection | NAAT/PCR | 17 | 10,128 | 0.0–16.5 | 1.1 | 1.1 | 0.3–2.2 | 115.4 | p < 0.001 | 86.1 | 79.3–90.7 | 0.0–7.0 | |
| Culture | 74 | 16,617 | 0.0–44.4 | 5.6 | 7.1 | 4.9–9.6 | 1,935.8 | p < 0.001 | 96.2 | 95.7–96.7 | 0.0–37.0 | ||
| Gram staining | 4 | 865 | 0.0–10.1 | 3.1 | 2.9 | 0.0–9.3 | 65.9 | p < 0.001 | 95.4 | 91.2–97.6 | 0.0–52.3 | ||
| Otherd | 8 | 875 | 0.0–52.9 | 6.3 | 7.4 | 0.6–19.1 | 101.6 | p < 0.001 | 93.1 | 88.7–95.8 | 0.0–60.2 | ||
| Overall | 103 | 28,485 | 0.0–52.9 | 2.5 | 5.6 | 4.0–7.4 | 2,566.4 | p < 0.001 | 96.0 | 95.6–96.4 | 0.0–31.9 | ||
| Current anorectal infection | NAAT/PCR | 1e | 50 | NA | NA | 14.0 | 5.6–25.2 | NA | NA | NA | |||
| Culture | 3 | 3,368 | 0.2–1.5 | 1.3 | 0.9 | 0.2–2.0 | 16.4 | p = 0.003 | 87.8 | 65.8–95.7 | 0.0–40.9 | ||
| Gram staining | 1e | 395 | NA | NA | 0.3 | 0.0–1.1 | NA | NA | NA | ||||
| Overall | 5 | 3,813 | 1.2–14.0 | 1.3 | 1.6 | 0.0–5.5 | 36.6 | p < 0.001 | 89.1 | 77.2–94.8 | 0.0–25.9 | ||
| Current oropharyngeal infection | NAAT/PCR | 1e | 50 | NA | NA | 8.0 | 1.8–17.4 | NA | NA | NA | |||
| Overall | 1e | 50 | NA | NA | 8.0 | 1.8–17.4 | NA | NA | NA | ||||
| Unspecified/mixed anatomical site | NAAT/PCR | 1e | 1,457 | NA | NA | 1.0 | 0.6–1.6 | NA | NA | NA | |||
| Culture | 41 | 33,686 | 0.0–44.6 | 15.9 | 14.2 | 10.7–18.1 | 1,341.5 | p < 0.001 | 97.0 | 96.5–97.5 | 0.0–44.2 | ||
| Gram staining | 1e | 438 | NA | NA | 0.0 | 0.0–0.4 | NA | NA | NA | ||||
| Otherd | 13 | 4,015 | 1.0–52.2 | 22.7 | 19.6 | 10.7–30.5 | 475.6 | p < 0.001 | 97.5 | 96.7–98.1 | 0.0–68.7 | ||
| Overall | 56 | 39,596 | 0.0–52.2 | 15.9 | 14.6 | 11.1–18.4 | 2,519.0 | p < 0.001 | 97.8 | 97.5–98.1 | 0.0–49.4 | ||
| Sera | Blood tested for antibodies | 6 | 726 | 17.3–32.8 | 21.4 | 22.5 | 17.9–27.4 | 12.1 | p = 0.033 | 58.7 | 0.0–83.3 | 10.2–37.8 | |
| Symptomatic men | |||||||||||||
| Current urogenital infection | NAAT/PCR | 18 | 7,288 | 0.0–49.0 | 8.9 | 11.9 | 5.9–19.5 | 326.8 | p < 0.001 | 94.8 | 93.0–96.1 | 0.0–53.0 | |
| Culture | 31 | 12,784 | 1.3–51.8 | 8.9 | 12.8 | 8.5–17.8 | 950.8 | p < 0.001 | 96.8 | 96.2–97.4 | 0.0–47.9 | ||
| Gram staining | 4 | 908 | 0.6–61.7 | 24.9 | 23.5 | 2.9–55.2 | 188.9 | p < 0.001 | 98.4 | 97.5–99.0 | 0.0–100.0 | ||
| Otherd | 8 | 3,904 | 1.0–30.0 | 4.0 | 5.7 | 1.6–12.0 | 104.6 | p < 0.001 | 93.3 | 89.1–95.9 | 0.0–35.4 | ||
| Overall | 61 | 24,884 | 0.0–61.7 | 8.9 | 12.1 | 8.8–15.8 | 1,906.6 | p < 0.001 | 96.9 | 96.4–97.2 | 0.0–48.6 | ||
| Current anorectal infection | NAAT/PCR | 4 | 616 | 14.5–31.3 | 25.1 | 23.3 | 18.8–28.1 | 4.3 | p = 0.234 | 29.7 | 0.0–74.4 | 10.6–39.0 | |
| Culture | 8 | 4,716 | 0.5–22.0 | 8.8 | 7.0 | 2.0–14.3 | 323.2 | p < 0.001 | 97.8 | 96.9–98.5 | 0.0–41.0 | ||
| Otherd | 1e | 3,066 | NA | NA | 0.3 | 0.1–0.5 | NA | NA | NA | ||||
| Overall | 13 | 8,398 | 0.3–31.3 | 12.0 | 9.8 | 4.3–17.1 | 771.3 | p < 0.001 | 98.4 | 98.0–98.8 | 0.0–46.5 | ||
| Unspecified/mixed anatomical site | NAAT/PCR | 16 | 1,127 | 3.6–45.6 | 27.6 | 25.8 | 19.7–32.3 | 83.5 | p < 0.001 | 82.0 | 71.9–88.5 | 5.3–54.0 | |
| Culture | 3 | 330 | 2.4–12.0 | 7.2 | 6.9 | 2.5–13.0 | 6.6 | p = 0.037 | 69.7 | 0.0–91.2 | 0.0–98.8 | ||
| Otherd | 7 | 1,205 | 0.0–50.0 | 16.6 | 14.9 | 3.2–32.3 | 240.3 | p < 0.001 | 97.5 | 96.3–98.3 | 0.0–83.1 | ||
| Overall | 26 | 2,662 | 0.0–50.0 | 23.3 | 20.1 | 14.2–26.7 | 411.3 | p < 0.001 | 93.9 | 92.2–95.3 | 0.0–58.4 | ||
| Symptomatic mixed sexes | |||||||||||||
| Unspecified/mixed anatomical site | NAAT/PCR | 1e | 1,168 | NA | NA | 5.2 | 4.0–6.6 | NA | NA | NA | |||
| Otherd | 1e | 1,055 | NA | NA | 9.2 | 7.5–11.0 | NA | NA | NA | ||||
| Overall | 2e | 2,223 | 0.0–87.0 | 4.2 | 7.1 | 3.7–11.5 | NA | NA | NA | ||||
| Sexual contacts of persons infected with NG/CT | |||||||||||||
| Current urogenital infection | NAAT/PCR | 5 | 5,586 | 1.0–46.7 | 4.9 | 9.8 | 0.6–27.7 | 233.8 | p < 0.001 | 98.3 | 97.4–98.9 | 0.0–89.7 | |
| Culture | 5 | 789 | 11.1–51.3 | 17.2 | 22.8 | 10.5–38.0 | 90.4 | p < 0.001 | 95.6 | 92.2–97.5 | 0.0–82.6 | ||
| Overall | 10 | 6,375 | 1.0–51.3 | 14.7 | 15.7 | 6.5–27.8 | 648.4 | p < 0.001 | 98.6 | 98.2–98.9 | 0.0–68.7 | ||
| Current anorectal infection | NAAT/PCR | 3 | 433 | 0.7–25.7 | 23.4 | 13.5 | 0.8–37.0 | 68.9 | p < 0.001 | 97.1 | 94.2–98.5 | 0.0–100.0 | |
| Culture | 2e | 34 | 17.7–23.5 | 20.6 | 20.5 | 8.0–36.4 | NA | NA | NA | ||||
| Overall | 5 | 467 | 0.7–25.7 | 23.4 | 15.4 | 4.5–30.7 | 70.5 | p < 0.001 | 94.3 | 89.6–96.9 | 0.0–77.8 | ||
| Current oropharyngeal infection | NAAT/PCR | 3 | 433 | 4.2–36.5 | 21.3 | 18.5 | 3.6–41.0 | 49.4 | p < 0.001 | 96.0 | 91.3–98.1 | 0.0–100.0 | |
| Overall | 3 | 433 | 4.2–36.5 | 21.3 | 18.5 | 3.6–41.0 | 49.4 | p < 0.001 | 96.0 | 91.3–98.1 | 0.0–100.0 | ||
| Unspecified/mixed anatomical site | Culture | 10 | 1,360 | 10.8–87.0 | 42.9 | 43.7 | 26.0–62.3 | 418.8 | p < 0.001 | 97.9 | 97.1–98.4 | 0.0–98.7 | |
| Otherd | 14 | 25,331 | 1.4–84.5 | 70.6 | 52.5 | 33.9–70.7 | 3,246.9 | p < 0.001 | 99.6 | 99.5–99.7 | 0.0–100.0 | ||
| Overall | 24 | 26,691 | 1.4–87.0 | 59.5 | 48.9 | 35.7–62.1 | 3,680.3 | p < 0.001 | 99.4 | 99.3–99.4 | 0.3–99.3 | ||
| Patients with confirmed/suspected STIs and related infections | |||||||||||||
| Current urogenital infection | NAAT/PCR | 10 | 13,001 | 0.5–22.5 | 2.7 | 3.6 | 1.3–7.0 | 156.3 | p < 0.001 | 94.2 | 91.3–96.2 | 0.0–20.7 | |
| Culture | 22 | 11,493 | 1.0–28.7 | 8.6 | 9.2 | 6.5–12.2 | 608.5 | p < 0.001 | 96.5 | 95.6–97.3 | 0.3–27.3 | ||
| Otherd | 4 | 6,222 | 0.0–32.7 | 10.1 | 9.9 | 0.7–27.7 | 384.7 | p < 0.001 | 99.2 | 98.9–99.5 | 0.0–99.0 | ||
| Overall | 36 | 30,716 | 0.0–32.7 | 7.0 | 7.5 | 5.2–10.2 | 2,555.2 | p < 0.001 | 98.6 | 98.4–98.8 | 0.0–28.4 | ||
| Current anorectal infection | NAAT/PCR | 13 | 2,458 | 0.0–50.0 | 15.9 | 16.8 | 9.3–25.7 | 73.1 | p < 0.001 | 83.6 | 73.3–89.9 | 0.0–54.4 | |
| Culture | 1e | 32 | NA | NA | 3.1 | 0.0–12.9 | NA | NA | NA | ||||
| Otherd | 2e | 115 | 4.2–15.4 | 9.8 | 10.7 | 2.6–22.6 | NA | NA | NA | ||||
| Overall | 16 | 2,605 | 0.0–50.0 | 14.8 | 14.7 | 8.6–21.9 | 78.9 | p < 0.001 | 81.0 | 70.1–87.9 | 0.0–47.8 | ||
| Current oropharyngeal infection | NAAT/PCR | 4 | 387 | 0.0–10.1 | 5.0 | 4.9 | 1.2–10.5 | 8.9 | p = 0.031 | 66.3 | 1.3–88.5 | 0.0–38.2 | |
| Culture | 1e | 32 | NA | NA | 3.1 | 0.0–12.9 | NA | NA | NA | ||||
| Overall | 5 | 419 | 0.0–10.1 | 3.0 | 4.7 | 1.5–9.2 | 9.3 | p = 0.054 | 57.0 | 0.0–84.1 | 0.0–22.9 | ||
| Unspecified/mixed anatomical site | NAAT/PCR | 6 | 1,461 | 2.0–29.0 | 13.3 | 10.6 | 3.9–19.8 | 78.2 | p < 0.001 | 93.6 | 88.7–96.4 | 0.0–50.1 | |
| Culture | 4 | 2,506 | 11.5–52.4 | 37.6 | 33.5 | 16.9–52.4 | 192.4 | p < 0.001 | 98.4 | 97.5–99.0 | 0.0–100.0 | ||
| Gram staining | 3 | 692 | 7.8–33.2 | 24.6 | 21.4 | 8.7–37.7 | 20.7 | p < 0.001 | 90.3 | 74.4–96.3 | 0.0–100.0 | ||
| Otherd | 7 | 2,744 | 7.1–50.0 | 19.5 | 19.9 | 10.4–31.6 | 277.2 | p < 0.001 | 97.8 | 96.9–98.5 | 0.0–66.2 | ||
| Overall | 20 | 7,403 | 2.0–52.4 | 19.2 | 19.7 | 13.5–26.8 | 806.5 | p < 0.001 | 97.6 | 97.1–98.1 | 0.1–57.5 | ||
| Sera | Blood tested for antibodies | 1e | 43 | NA | NA | 23.3 | 11.7–37.2 | NA | NA | NA | |||
CI: confidence interval; CT: Chlamydia trachomatis; NA: not applicable; NAAT: nucleic acid amplification test; NG: Neisseria gonorrhoeae; STIs: sexually transmitted infections.
The main results have been bolded to emphasise them and to align them with the corresponding discussions in the results section.
a Q: the Cochran’s Q statistic is a measure assessing the existence of heterogeneity in pooled outcome measures, here NG prevalence.
b I2: a measure that assesses the magnitude of between-study variation that is due to actual differences in NG prevalence across studies rather than chance.
c Prediction interval: a measure that estimates the distribution (95% interval) of true NG prevalence around the estimated mean.
d Other assays include unclear testing technique, enzyme immunoassay, complement fixation or mixed testing techniques.
e No meta-analysis was done due to the small number of studies (n < 3).
Precision and risk of bias assessments
Results of the precision and ROB assessments are summarised in Supplementary Table S4. Among all studies (n = 1,573), 1,232 (78.3%) had high precision, 50 (3.2%) had low ROB in the sampling method domain and 93 (5.9%) had low ROB in the response rate domain. In contrast, 341 (21.7%) studies had low precision, 1,523 (96.8%) had high ROB in the sampling method domain and 92 (5.9%) had high ROB in the response rate domain. For 1,388 (88.2%) studies, the ROB assessment for the response rate domain was ‘unclear’. Only 6 (0.4%) studies had low ROB in both quality domains, whereas 75 (4.8%) studies had high ROB in both quality domains.
Notably, in the meta-regression analyses for NG prevalence (note below), no evidence was found for variation in prevalence by sampling method or response rate. However, there was evidence for a small-study effect with larger (high precision) studies reporting lower prevalence than smaller (low precision) studies.
Pooled estimates for Neisseria gonorrhoeae prevalence
Pooled NG prevalence among the different population types stratified by anatomical site and assay type is listed in Tables 1–3. Among general populations for all assay types, pooled prevalence was 1.0% (95% CI: 0.7–1.2%) for urogenital infection, 2.3% (95% CI: 0.2–6.3%) for anorectal infection and 0.9% (95% CI: 0.0–4.6%) for oropharyngeal infection (Table 1).
Among female sex workers (FSWs), pooled prevalence was 3.2% (95% CI: 1.8–4.8%) for urogenital infection, 1.7% (95% CI: 0.1–5.0%) for anorectal infection and 2.6% (95% CI: 0.4–6.3%) for oropharyngeal infection (Table 2). Among men who have sex with men (MSM) and male sex workers (MSWs), pooled prevalence was 0.9% (95% CI: 0.5–1.4%) for urogenital infection, 5.6% (95% CI: 3.6–8.1%) for anorectal infection and 3.8% (95% CI: 2.5–5.4%) for oropharyngeal infection (Table 2). Among STI clinic attendees, pooled prevalence was 4.9% (95% CI: 4.2–5.6%) for urogenital infection, 4.7% (95% CI: 3.9–5.5%) for anorectal infection and 4.7% (95% CI: 3.4–6.1%) for oropharyngeal infection (Table 2).
Among symptomatic women, pooled prevalence was 5.6% (95% CI: 4.0–7.4%) for urogenital infection and 1.6% (95% CI: 0.0–5.5%) for anorectal infection (Table 3). Among symptomatic men, pooled prevalence was 12.1% (95% CI: 8.8–15.8%) for urogenital infection and 9.8% (95% CI: 4.3–17.1%) for anorectal infection (Table 3). Among sexual contacts of persons infected with NG or Chlamydia trachomatis (CT), pooled prevalence was 15.7% (95% CI: 6.5–27.8%) for urogenital infection, 15.4% (95% CI: 4.5–30.7%) for anorectal infection and 18.5% (95% CI: 3.6–41.0%) for oropharyngeal infection (Table 3).
Most meta-analyses showed strong evidence for heterogeneity (p value < 0.001) with most of the heterogeneity being attributed to true variation in prevalence across studies rather than sampling variation (I2 > 50%) (Tables 1–3). Heterogeneity was confirmed by the wide prediction intervals of the distribution of prevalence around the pooled means (Tables 1–3). Forest plots of prevalence of current urogenital infection across all populations are found in Supplementary Figure S1.
Associations with Neisseria gonorrhoeae prevalence
Results of the univariable and multivariable meta-regression analyses of NG prevalence by anatomical site are shown in Table 4, Table 5 and Table 6. Two multivariable models were implemented for each anatomical site to account for the collinearity between the year of data collection as a categorical variable and the year of data collection as a linear term. In these multivariable analyses, the models considered explained more than 30% of the variation in prevalence (Tables 4–6).
Table 4. Univariable and multivariable meta-regression analyses for Neisseria gonorrhoeae prevalence in urogenital specimens in World Health Organization European Region countries, 1949–2021.
| Urogenital specimens | Outcome measures | Sample size | Univariable analysis | Multivariable analyses | ||||||||||
|---|---|---|---|---|---|---|---|---|---|---|---|---|---|---|
| Total n | Total n | RR | 95% CI | p value | LT test p-value | Adjusted R2 | Model 1a | Model 2b | ||||||
| ARR | 95% CI | p value | ARR | 95% CI | p value | |||||||||
| Population characteristics | ||||||||||||||
| Population type | General populations | 262 | 644,913 | 1.00 | NA | < 0.001 | 18.84 | 1.00 | NA | 1.00 | NA | |||
| Intermediate-risk populations | 24 | 6,559 | 2.54 | 1.28–5.04 | 0.008 | NA | 3.00 | 1.59–5.68 | 0.001 | 2.47 | 1.32–4.61 | 0.005 | ||
| FSWs | 31 | 10,021 | 3.28 | 1.96–5.47 | < 0.001 | NA | 4.04 | 2.52–6.48 | < 0.001 | 3.73 | 2.35–5.92 | < 0.001 | ||
| MSM, MSWs, and transgender people | 16 | 6,436 | 0.95 | 0.45–2.01 | 0.887 | NA | 1.31 | 0.64–2.65 | 0.459 | 1.36 | 0.68–2.73 | 0.383 | ||
| Infertility clinic attendees | 51 | 7,150 | 2.58 | 1.38–4.80 | 0.003 | NA | 1.79 | 1.00–3.22 | 0.051 | 1.46 | 0.81–2.61 | 0.204 | ||
| Symptomatic women | 103 | 28,485 | 4.11 | 2.97–5.69 | < 0.001 | NA | 3.27 | 2.39–4.46 | < 0.001 | 2.98 | 2.20–4.05 | < 0.001 | ||
| Symptomatic men | 61 | 24,884 | 7.19 | 4.99–10.30 | < 0.001 | NA | 5.53 | 3.74–8.18 | < 0.001 | 5.22 | 3.57–7.64 | < 0.001 | ||
| STI clinic attendees | 374 | 1,962,406 | 2.91 | 2.33–3.65 | < 0.001 | NA | 3.14 | 2.51–3.93 | < 0.001 | 2.98 | 2.40–3.71 | < 0.001 | ||
| HIV-positive individuals and individuals in HIV discordant couples | 19 | 5,069 | 0.85 | 0.35–2.04 | 0.714 | NA | 1.02 | 0.45–2.30 | 0.970 | 0.94 | 0.42–2.09 | 0.873 | ||
| Sexual contacts of persons infected with NG/CT | 10 | 6,375 | 7.83 | 3.67–16.60 | < 0.001 | NA | 8.08 | 4.08–16.00 | < 0.001 | 7.03 | 3.59–13.70 | < 0.001 | ||
| Patients with confirmed/suspected STIs and related infections | 36 | 30,716 | 4.53 | 2.93–7.01 | < 0.001 | NA | 4.85 | 3.25–7.25 | < 0.001 | 4.59 | 3.10–6.81 | < 0.001 | ||
| Other populationsc | 25 | 23,715 | 2.83 | 1.67–4.81 | < 0.001 | NA | 4.05 | 2.50–6.55 | < 0.001 | 3.75 | 2.34–6.02 | < 0.001 | ||
| Age group | < 20 years | 50 | 11,635 | 1.00 | NA | 0.007 | 1.53 | 1.00 | NA | 1.00 | NA | |||
| 20–29 years | 34 | 16,002 | 0.74 | 0.39–1.41 | 0.359 | NA | 0.83 | 0.49–1.41 | 0.489 | 0.88 | 0.52–1.47 | 0.617 | ||
| 30–39 years | 20 | 5,386 | 0.99 | 0.43–2.26 | 0.979 | NA | 1.26 | 0.65–2.45 | 0.499 | 1.37 | 0.71–2.63 | 0.351 | ||
| ≥ 40 years | 18 | 4,012 | 0.82 | 0.37–1.85 | 0.639 | NA | 1.69 | 0.85–3.34 | 0.132 | 2.06 | 1.05–4.04 | 0.035 | ||
| Mixed ages | 890 | 2,719,694 | 0.53 | 0.35–0.80 | 0.003 | NA | 0.37 | 0.26–0.52 | < 0.001 | 0.42 | 0.30–0.60 | < 0.001 | ||
| Sex | Women | 558 | 1,154,985 | 1.00 | NA | < 0.001 | 2.40 | 1.00 | NA | 1.00 | NA | |||
| Men | 371 | 933,280 | 1.62 | 1.34–1.98 | < 0.001 | NA | NA | 1.41 | 1.16–1.73 | 0.001 | 1.45 | 1.19–1.77 | < 0.001 | |
| Mixed sexes | 83 | 668,464 | 1.21 | 0.88–1.65 | 0.239 | NA | NA | 1.28 | 0.97–1.68 | 0.076 | 1.17 | 0.90–1.53 | 0.248 | |
| European subregions | Eastern Europe | 77 | 281,396 | 1.00 | NA | 0.922 | 0.00 | NA | NA | NA | NA | |||
| Southern Europe | 121 | 72,030 | 1.08 | 0.70–1.67 | 0.724 | NA | NA | NA | NA | NA | NA | |||
| Western Europe | 330 | 1,242,348 | 0.96 | 0.66–1.38 | 0.816 | NA | NA | NA | NA | NA | NA | |||
| Northern Europe | 424 | 1,136,092 | 1.04 | 0.73–1.50 | 0.815 | NA | NA | NA | NA | NA | NA | |||
| Israel, Türkiye and mixed regions | 60 | 24,863 | 1.06 | 0.62–1.81 | 0.838 | NA | NA | NA | NA | NA | NA | |||
| Country’s income level | LMIC | 7 | 1,353 | 1.00 | NA | 0.021 | 1.01 | 1.00 | NA | 1.00 | NA | |||
| UMIC | 76 | 279,505 | 2.16 | 0.68–6.89 | 0.193 | NA | NA | 2.12 | 0.78–5.79 | 0.143 | 1.49 | 0.56–3.96 | 0.427 | |
| HIC | 927 | 2,467,907 | 1.93 | 0.63–5.88 | 0.246 | NA | NA | 1.46 | 0.56–3.83 | 0.441 | 1.05 | 0.41–2.71 | 0.918 | |
| Mixed income | 2 | 7,964 | 0.14 | 0.02–1.17 | 0.069 | NA | NA | 0.39 | 0.07–2.33 | 0.303 | 0.26 | 0.04–1.47 | 0.127 | |
| Study methodology characteristics | ||||||||||||||
| Assay type | NAAT/PCR | 427 | 1,448,120 | 1.00 | NA | < 0.001 | 6.31 | 1.00 | NA | 1.00 | NA | |||
| Culture | 453 | 985,482 | 1.91 | 1.57–2.32 | < 0.001 | NA | NA | 0.98 | 0.76–1.26 | 0.850 | 0.81 | 0.64–1.03 | 0.087 | |
| Gram Staining | 32 | 247,107 | 2.52 | 1.53–4.14 | < 0.001 | NA | NA | 1.31 | 0.83–2.06 | 0.246 | 0.98 | 0.62–1.53 | 0.919 | |
| Other/unclear | 100 | 76,020 | 1.79 | 1.30–2.46 | < 0.001 | NA | NA | 0.94 | 0.70–1.27 | 0.686 | 0.84 | 0.63–1.13 | 0.250 | |
| Sample size d | < 200 | 189 | 14,814 | 1.00 | NA | < 0.001 | 7.82 | 1.00 | NA | 1.00 | NA | |||
| ≥ 200 | 823 | 2,741,915 | 0.38 | 0.29–0.49 | < 0.001 | NA | NA | 0.44 | 0.34–0.56 | < 0.001 | 0.43 | 0.34–0.55 | < 0.001 | |
| Sampling method | Probability based | 39 | 15,610 | 1.00 | NA | 0.106 | 0.00 | NA | NA | NA | NA | |||
| Non-probability based | 973 | 2,741,119 | 1.73 | 0.89–3.34 | 0.106 | NA | NA | NA | NA | NA | NA | |||
| Response rate | ≥ 80% | 62 | 44,933 | 1.00 | NA | < 0.001 | 1.44 | 1.00 | NA | 1.00 | NA | |||
| < 80% | 68 | 30,509 | 1.05 | 0.58–1.89 | 0.874 | NA | NA | 0.83 | 0.50–1.37 | 0.460 | 0.78 | 0.48–1.28 | 0.334 | |
| Unclear | 882 | 2,681,287 | 1.99 | 1.33–2.98 | 0.001 | NA | NA | 1.35 | 0.96–1.90 | 0.080 | 1.31 | 0.94–1.84 | 0.110 | |
| Temporal trend | ||||||||||||||
| Year of data collection category | < 2000 | 455 | 939,407 | 1.00 | NA | < 0.001 | 6.90 | 1.00 | NA | NA | NA | |||
| 2000–2010 | 258 | 881,492 | 0.53 | 0.43–0.66 | < 0.001 | NA | NA | 0.46 | 0.36–0.59 | < 0.001 | NA | NA | ||
| > 2010 | 299 | 935,830 | 0.49 | 0.39–0.61 | < 0.001 | NA | NA | 0.54 | 0.41–0.71 | < 0.001 | NA | NA | ||
| Year of data collection | 1,012 | 2,756,729 | 0.97 | 0.97–0.98 | < 0.001 | < 0.001 | 11.08 | NA | NA | 0.97 | 0.96–0.98 | < 0.001 | ||
ARR: adjusted risk ratio; CI: confidence interval; CT: Chlamydia trachomatis; FSWs: female sex workers; HIC: high-income country; MSM: men who have sex with men, MSWs: male sex workers; NA: not applicable; NAAT: nucleic acid amplification test; NG: Neisseria gonorrhoeae; LMIC: low-middle income country; LT test: likelihood ratio test; RR: risk ratio; STI: sexually transmitted infection; UMIC: upper-middle income country.
The main results have been bolded to emphasize them and to align them with the corresponding discussions in the results section.
a Adjusted R2 in the final multivariable model 1 = 37.43%.
b Adjusted R2 in the final multivariable model 2 = 39.81%.
c Other populations include populations with an undetermined risk of acquiring Neisseria gonorrhoeae infection such as patients with cervical cancer, victims of sexual assault, specimens from virology/bacteriology laboratory and requesting home-based N. gonorrhoeae or Chlamydia trachomatis testing.
d Sample size denotes the sample size of each study population at the baseline found in the original publication.
Table 5. Univariable and multivariable meta-regression analyses for Neisseria gonorrhoeae prevalence in anorectal specimens in World Health Organization European Region countries, 1949–2021.
| Anorectal specimens | Outcome measures | Sample size | Univariable analysis | Multivariable analyses | ||||||||||
|---|---|---|---|---|---|---|---|---|---|---|---|---|---|---|
| Total n | Total n | RR | 95% CI | p value | LT test p value | Adjusted R2 | Model 1a | Model 2b | ||||||
| ARR | 95% CI | p value | ARR | 95% CI | p value | |||||||||
| Population characteristics | ||||||||||||||
| Population type | MSM, MSWs, and transgender peoplec | 15 | 9,893 | 1.00 | NA | < 0.001 | 12.87 | 1.00 | NA | 1.00 | NA | |||
| General populations | 3 | 1,258 | 0.41 | 0.11–1.55 | 0.187 | NA | NA | 1.12 | 0.33–3.85 | 0.854 | 1.23 | 0.35–4.27 | 0.744 | |
| Intermediate-risk populations | 2 | 141 | 4.01 | 0.46–34.70 | 0.207 | NA | NA | 10.10 | 1.43–72.00 | 0.021 | 9.35 | 1.31–66.60 | 0.026 | |
| FSWs | 5 | 2,440 | 0.50 | 0.16–1.61 | 0.244 | NA | NA | 1.18 | 0.39–3.57 | 0.766 | 1.09 | 0.36–3.31 | 0.877 | |
| Symptomatic women | 5 | 3,813 | 0.27 | 0.09–0.81 | 0.020 | NA | NA | 1.33 | 0.39–4.46 | 0.647 | 1.21 | 0.36–4.06 | 0.759 | |
| Symptomatic men | 13 | 8,398 | 1.30 | 0.59–2.85 | 0.512 | NA | NA | 1.13 | 0.56–2.30 | 0.730 | 1.11 | 0.54–2.25 | 0.782 | |
| STI clinic attendees | 137 | 739,542 | 0.86 | 0.49–1.52 | 0.597 | NA | NA | 1.27 | 0.75–2.16 | 0.366 | 1.24 | 0.73–2.09 | 0.427 | |
| HIV-positive individuals and individuals in HIV discordant couples | 21 | 4,672 | 1.05 | 0.51–2.19 | 0.887 | NA | NA | 0.90 | 0.47–1.74 | 0.765 | 0.89 | 0.46–1.72 | 0.731 | |
| Sexual contacts of persons infected with NG/CT | 5 | 467 | 2.97 | 0.98–9.00 | 0.054 | NA | NA | 3.45 | 1.25–9.53 | 0.017 | 3.59 | 1.29–9.95 | 0.014 | |
| Patients with confirmed/suspected STIs and related infections | 16 | 2,605 | 3.13 | 1.44–6.78 | 0.004 | NA | NA | 3.23 | 1.60–6.50 | 0.001 | 3.20 | 1.59–6.47 | 0.001 | |
| Other populationsd | 7 | 1,348 | 1.17 | 0.42–3.25 | 0.762 | NA | NA | 2.21 | 0.86–5.68 | 0.100 | 2.29 | 0.89–5.91 | 0.087 | |
| Age group | ≤ 30 years | 8 | 1,165 | 1.00 | NA | 0.559 | 0.00 | NA | NA | NA | NA | |||
| > 30 years | 6 | 498 | 1.41 | 0.34–5.85 | 0.631 | NA | NA | NA | NA | NA | NA | |||
| Mixed ages | 215 | 772,914 | 0.80 | 0.34–1.89 | 0.615 | NA | NA | NA | NA | NA | NA | |||
| Sex | Women | 52 | 176,849 | 1.00 | NA | < 0.001 | 11.86 | 1.00 | NA | 1.00 | NA | |||
| Men | 167 | 579,396 | 2.62 | 1.83–3.75 | < 0.001 | NA | NA | 2.86 | 1.96–4.19 | < 0.001 | 2.75 | 1.89–4.02 | < 0.001 | |
| Mixed sexes | 10 | 18,332 | 2.05 | 0.99–4.24 | 0.052 | NA | NA | 2.05 | 1.06–3.98 | 0.033 | 2.05 | 1.06–3.97 | 0.034 | |
| European subregions | Eastern Europe | 6 | 2,132 | 1.00 | NA | 0.004 | 5.83 | 1.00 | NA | 1.00 | NA | |||
| Southern Europe | 24 | 11,557 | 3.39 | 1.19–9.64 | 0.023 | NA | NA | 0.71 | 0.24–2.12 | 0.537 | 0.63 | 0.21–1.89 | 0.408 | |
| Western Europe | 120 | 633,385 | 1.58 | 0.61–4.14 | 0.347 | NA | NA | 0.80 | 0.30–2.14 | 0.650 | 0.70 | 0.26–1.88 | 0.473 | |
| Northern Europe | 78 | 127,487 | 2.25 | 0.85–5.97 | 0.101 | NA | NA | 0.94 | 0.34–2.62 | 0.910 | 0.85 | 0.31–2.37 | 0.759 | |
| Israel, Türkiye and mixed regions | 1 | 16 | 12.30 | 1.17–129.80 | 0.037 | NA | NA | 2.10 | 0.24–18.50 | 0.504 | 1.96 | 0.22–17.50 | 0.545 | |
| Country’s income level | UMIC | 4 | 1,342 | 1.00 | NA | 0.784 | 0.00 | NA | NA | NA | NA | |||
| HIC | 225 | 773,235 | 1.18 | 0.37–3.76 | 0.784 | NA | NA | NA | NA | NA | NA | |||
| Study methodology characteristics | ||||||||||||||
| Assay type | NAAT/PCR | 121 | 593,512 | 1.00 | NA | 0.288 | 0.41 | NA | NA | NA | NA | |||
| Culture | 65 | 129,889 | 0.74 | 0.52–1.06 | 0.098 | NA | NA | NA | NA | NA | NA | |||
| Gram staining | 4 | 9,857 | 0.80 | 0.25–2.53 | 0.707 | NA | NA | NA | NA | NA | NA | |||
| Other/unclear | 39 | 41,319 | 1.10 | 0.73–1.65 | 0.661 | NA | NA | NA | NA | NA | NA | |||
| Sample size e | < 200 | 38 | 2,715 | 1.00 | NA | < 0.001 | 11.42 | 1.00 | NA | 1.00 | NA | |||
| ≥ 200 | 191 | 771,862 | 0.38 | 0.26–0.56 | < 0.001 | NA | NA | 0.46 | 0.31–0.67 | < 0.001 | 0.45 | 0.31–0.66 | < 0.001 | |
| Sampling method | Probability based | 4 | 1,154 | 1.00 | NA | 0.927 | 0.00 | NA | NA | NA | NA | |||
| Non-probability based | 225 | 773,423 | 0.95 | 0.32–2.85 | 0.927 | NA | NA | NA | NA | NA | NA | |||
| Response rate | ≥ 80% | 7 | 22,936 | 1.00 | NA | 0.509 | 0.00 | NA | NA | NA | NA | |||
| < 80% | 16 | 5,859 | 0.95 | 0.32–2.78 | 0.925 | NA | NA | NA | NA | NA | NA | |||
| Unclear | 206 | 745,782 | 1.32 | 0.54–3.21 | 0.536 | NA | NA | NA | NA | NA | NA | |||
| Temporal trend | ||||||||||||||
| Year of data collection category | < 2000 | 49 | 130,000 | 1.00 | NA | 0.001 | 6.73 | 1.00 | NA | NA | NA | |||
| 2000–2010 | 60 | 139,618 | 1.41 | 0.93–2.16 | 0.109 | NA | NA | 1.60 | 1.10–2.33 | 0.014 | NA | NA | ||
| > 2010 | 120 | 504,959 | 2.02 | 1.40–2.91 | < 0.001 | NA | NA | 2.07 | 1.45–2.96 | < 0.001 | NA | NA | ||
| Year of data collection | 229 | 774,577 | 1.02 | 1.01–1.03 | 0.001 | 0.001 | 5.60 | NA | NA | 1.02 | 1.01–1.04 | < 0.001 | ||
ARR: adjusted risk ratio; CI: confidence interval; CT: Chlamydia trachomatis; FSWs: female sex workers; HIC: high-income country; MSM: men who have sex with men; MSWs: male sex workers; NA: not applicable; NAAT: nucleic acid amplification test, NG: Neisseria gonorrhoeae; LT test: likelihood ratio test, RR: risk ratio; STI: sexually transmitted infection; UMIC: upper-middle income country.
The main results have been bolded to emphasise them and to align them with the corresponding discussions in the results section.
a Adjusted R2 in the final multivariable model 1 = 35.94%.
b Adjusted R2 in the final multivariable model 2 = 35.20%.
c MSM, MSWs, and transgender people group was used as a reference because of epidemiological relevance and because the general populations group had small number of measures.
d Other populations include populations with an undetermined risk of acquiring Neisseria gonorrhoeae infection such as patients with cervical cancer, victims of sexual assault, specimens from virology/bacteriology laboratory and requesting home-based N. gonorrhoeae or Chlamydia trachomatis testing.
e Sample size denotes the sample size of each study population at the baseline found in the original publication.
Table 6. Univariable and multivariable meta-regression analyses for Neisseria gonorrhoeae prevalence in oropharyngeal specimens in World Health Organization European Region countries, 1949–2021.
| Oropharyngeal specimens | Outcome measures | Sample size | Univariable analysis | Multivariable analyses | ||||||||||
|---|---|---|---|---|---|---|---|---|---|---|---|---|---|---|
| Total n | Total n | RR | 95% CI | p value | LT test p value | Adjusted R2 | Model 1a | Model 2b | ||||||
| ARR | 95% CI | p value | ARR | 95% CI | p value | |||||||||
| Population characteristics | ||||||||||||||
| Population typec | MSM, MSWs, and transgender peopled | 19 | 11,395 | 1.00 | NA | 0.266 | 1.56 | 1.00 | NA | 1.00 | NA | |||
| General populations | 3 | 475 | 1.08 | 0.14–8.34 | 0.936 | NA | NA | 1.83 | 0.29–11.60 | 0.518 | 1.63 | 0.25–10.60 | 0.609 | |
| FSWs | 7 | 2,949 | 0.84 | 0.31–2.28 | 0.738 | NA | NA | 1.89 | 0.74–4.78 | 0.180 | 1.67 | 0.65–4.26 | 0.284 | |
| STI clinic attendees | 107 | 394,371 | 1.08 | 0.63–1.82 | 0.772 | NA | NA | 1.81 | 1.12–2.92 | 0.016 | 1.60 | 0.99–2.59 | 0.053 | |
| HIV-positive individuals and individuals in HIV discordant couples | 14 | 3,510 | 0.87 | 0.39–1.95 | 0.752 | NA | NA | 0.90 | 0.45–1.82 | 0.776 | 0.79 | 0.39–1.60 | 0.514 | |
| Sexual contacts of persons infected with NG/CT | 3 | 433 | 4.37 | 1.26–15.10 | 0.020 | NA | NA | 5.20 | 1.82–14.90 | 0.002 | 5.08 | 1.74–14.80 | 0.003 | |
| Patients with confirmed/suspected STIs and related infections | 6 | 469 | 1.73 | 0.57–5.28 | 0.329 | NA | NA | 3.00 | 1.13–7.99 | 0.028 | 2.86 | 1.06–7.71 | 0.038 | |
| Other populationse | 8 | 1,460 | 1.76 | 0.70–4.45 | 0.224 | NA | NA | 2.58 | 1.12–5.93 | 0.026 | 2.69 | 1.16–6.27 | 0.022 | |
| Age group | ≤ 30 years | 6 | 664 | 1.00 | NA | 0.253 | 0.45 | NA | NA | NA | NA | |||
| > 30 years | 4 | 462 | 0.83 | 0.16–4.37 | 0.832 | NA | NA | NA | NA | NA | NA | |||
| Mixed ages | 157 | 413,936 | 0.50 | 0.20–1.22 | 0.129 | NA | NA | NA | NA | NA | NA | |||
| Sex | Women | 43 | 151,890 | 1.00 | NA | 0.020 | 5.66 | 1.00 | NA | 1.00 | NA | |||
| Men | 116 | 241,147 | 1.70 | 1.15–2.50 | 0.007 | NA | NA | 2.55 | 1.72–3.78 | < 0.001 | 2.64 | 1.77–3.93 | < 0.001 | |
| Mixed sexes | 8 | 22,025 | 1.12 | 0.51–2.45 | 0.767 | NA | NA | 1.30 | 0.62–2.75 | 0.488 | 1.49 | 0.70–3.16 | 0.297 | |
| European subregions | Eastern Europe | 3 | 1,198 | 1.00 | - NA | 0.979 | 0.00 | NA | NA | NA | NA | |||
| Southern Europe | 19 | 8,217 | 1.36 | 0.35–5.30 | 0.648 | NA | NA | NA | NA | NA | NA | |||
| Western Europe | 85 | 379,721 | 1.31 | 0.36–4.72 | 0.668 | NA | NA | NA | NA | NA | NA | |||
| Northern Europe | 57 | 23,580 | 1.43 | 0.39–5.21 | 0.579 | NA | NA | NA | NA | NA | NA | |||
| Israel, Türkiye and mixed regions | 3 | 2,346 | 1.25 | 0.22–7.05 | 0.793 | NA | NA | NA | NA | NA | NA | |||
| Country’s income level | UMIC | 3 | 1,198 | 1.00 | NA | 0.629 | 0.00 | NA | NA | NA | NA | |||
| HIC | 164 | 413,864 | 1.35 | 0.38–4.76 | 0.629 | NA | NA | NA | NA | NA | NA | |||
| Study methodology characteristics | ||||||||||||||
| Assay type | NAAT/PCR | 102 | 359,846 | 1.00 | NA | 0.029 | 4.14 | 1.00 | NA | 1.00 | NA | |||
| Culture | 40 | 29,580 | 0.56 | 0.37–0.85 | 0.008 | NA | NA | 0.60 | 0.36–1.01 | 0.056 | 0.59 | 0.34–1.02 | 0.060 | |
| Gram staining | 3 | 2,544 | 0.44 | 0.13–1.46 | 0.181 | NA | NA | 0.57 | 0.19–1.66 | 0.299 | 0.49 | 0.16–1.46 | 0.198 | |
| Other/unclear | 22 | 23,092 | 1.05 | 0.65–1.71 | 0.822 | NA | NA | 0.71 | 0.45–1.11 | 0.134 | 0.71 | 0.45–1.13 | 0.145 | |
| Sample size f | < 200 | 18 | 1,557 | 1.00 | NA | 0.011 | 5.10 | 1.00 | NA | 1.00 | NA | |||
| ≥ 200 | 149 | 413,505 | 0.48 | 0.27–0.84 | 0.011 | NA | NA | 0.42 | 0.25–0.71 | 0.001 | 0.40 | 0.24–0.68 | 0.001 | |
| Sampling method | Probability based | 4 | 1,118 | 1.00 | NA | 0.505 | 0.00 | NA | NA | NA | NA | |||
| Non-probability based | 163 | 413,944 | 1.43 | 0.49–4.20 | 0.505 | NA | NA | NA | NA | NA | NA | |||
| Response rate | ≥ 80% | 9 | 3,826 | 1.00 | NA | 0.156 | 1.10 | NA | NA | NA | NA | |||
| < 80% | 11 | 3,909 | 0.36 | 0.12–1.01 | 0.054 | NA | NA | NA | NA | NA | NA | |||
| Unclear | 147 | 407,327 | 0.59 | 0.27–1.29 | 0.192 | NA | NA | NA | NA | NA | NA | |||
| Temporal trend | ||||||||||||||
| Year of data collection category | < 2000 | 26 | 9,190 | 1.00 | NA | < 0.001 | 11.74 | 1.00 | NA | NA | NA | |||
| 2000–2010 | 49 | 161,036 | 1.23 | 0.74–2.07 | 0.423 | NA | NA | 1.15 | 0.65–2.06 | 0.626 | NA | NA | ||
| > 2010 | 92 | 244,836 | 2.33 | 1.45–3.73 | < 0.001 | NA | NA | 1.92 | 1.03–3.57 | 0.040 | NA | NA | ||
| Year of data collection | 167 | 415,062 | 1.02 | 1.01–1.04 | 0.001 | 0.001 | 7.85 | NA | NA | 1.02 | 1.00–1.04 | 0.097 | ||
ARR: adjusted risk ratio; CI: confidence interval; CT: Chlamydia trachomatis; FSWs: female sex workers; HIC: high-income country; MSM: men who have sex with men; MSWs: male sex workers; NA: not applicable; NAAT: nucleic acid amplification test; NG: Neisseria gonorrhoeae; LT test: likelihood ratio test; RR: risk ratio; STI: sexually transmitted infection; UMIC: upper-middle income country.
The main results have been bolded to emphasise them and to align them with the corresponding discussions in the results section.
a Adjusted R2 in the final multivariable model 1 = 33.15%.
b Adjusted R2 in the final multivariable model 2 = 30.43%.
c Population classification was included in the multivariable analyses for epidemiological relevance.
d MSM, MSWs, and transgender people group was used as a reference because of epidemiological relevance and because the general populations group had small number of measures.
e Other populations include populations with an undetermined risk of acquiring Neisseria gonorrhoeae infection such as patients with cervical cancer, victims of sexual assault, specimens from virology/bacteriology laboratory and requesting home-based N. gonorrhoeae or Chlamydia trachomatis testing.
f Sample size denotes the sample size of each study population at the baseline found in the original publication.
Urogenital Neisseria gonorrhoeae infection
Compared with general populations, prevalence was highest among sexual contacts of persons infected with NG or CT, followed by symptomatic men, patients with confirmed or suspected STIs, FSWs, symptomatic women, STI clinical attendees and intermediate risk populations (Table 4). Compared with women, men had 1.45-fold (95% CI: 1.19–1.77) higher prevalence (Table 4). Prevalence declined by 0.97-fold (95% CI: 0.96–0.98) per year, that is a 3% decline per year (Table 4).
Anorectal Neisseria gonorrhoeae infection
Compared with MSM, MSWs, and transgender people, prevalence was also highest among sexual contacts of persons infected with NG or CT, but otherwise differences in prevalence were not statistically significant, or significant but with relatively wide 95% CIs (Table 5). Compared with women, men had 2.75-fold (95% CI: 1.89–4.02) higher prevalence (Table 5). Prevalence increased by 1.02-fold (95% CI: 1.01–1.04) per year, that is a 2% increase per year (Table 5).
Oropharyngeal Neisseria gonorrhoeae infection
Compared with MSM, MSWs and transgender people, prevalence was also highest among sexual contacts of persons infected with NG or CT, but otherwise differences in prevalence were not statistically significant, or significant but with relatively wide 95% CIs (Table 6). Compared with women, men had 2.64-fold (95% CI: 1.77–3.93) higher prevalence (Table 6). Prevalence increased by 1.02-fold (95% CI: 1.00–1.04) per year, that is a 2% increase per year, with this increase being of borderline statistical significance (Table 6).
Other results for all anatomical sites
There was no evidence for differences in prevalence by age group, European subregion, or country income level for all analyses across the anatomical sites (Tables 4–6). Regarding the effects of study methods on prevalence, no statistically significant differences in prevalence were found based on assay type, sampling method or response rate in all analyses across the anatomical sites (Tables 4–6). However, there was evidence for a small-study effect with studies including a sample size ≥ 200 reporting > 50% lower prevalence in all analyses across the anatomical sites.
Sensitivity analyses to confirm the findings
The sensitivity analyses performed to validate the findings from the main analysis showed similar results when using the year of publication vs year of data collection in the models, as shown in Supplementary Tables S5-S7.
The sensitivity analyses performed to examine whether the results differed based on different diagnostic methods yielded results consistent with those observed in the main analysis (not shown). However, due to the smaller number of included studies in each subanalysis, some effect sizes had wider 95% CIs, leading to non-significant effects for some outcomes.
The cumulative meta-analyses, using the year of publication as the ordering variable, supported the observed trends in NG prevalence generated by the meta-regression analyses, as shown in Supplementary Figure S2.
Discussion
By providing an assessment of NG epidemiology in Europe from 1949 to 2021, this study identified two distinct and contrasting epidemiologies arising from infection transmission in two different sexual transmission networks. The first epidemiology is that of NG transmission in heterosexual sexual networks. Here, prevalence of urogenital infection averaged at 1% among the general population over the last few decades, a level comparable to the global prevalence level [6]. Prevalence of infection showed strong hierarchy with higher prevalence in populations at higher risk of infection (such as FSWs), as has been observed for other STIs [23,24,49,50]. Prevalence was particularly high, as expected, among symptomatic populations and populations suspected of exposure to STIs.
Neisseria gonorrhoeae urogenital prevalence was found to decline at a relative rate of 3% per year (Table 4), but this rate of decline is substantially slower than that needed to attain the WHO target of 90% incidence reduction by 2030. The decline may be attributed to safer sex practices following recognition of the HIV epidemic [51,52], improved awareness of STIs [53], enhanced access to HIV and STI services [9,10,54] and/or changes to structure of sexual networks following changes in socioeconomic conditions [26].
The second epidemiology is that of NG transmission in sexual networks of MSM, MSWs and transgender people where infection is being transmitted through both anal and oral sex. Higher prevalence of infection is found in these networks. Neisseria gonorrhoeae prevalence among MSM, MSWs and transgender people was estimated at 6% for anorectal infection and at 4% for oropharyngeal infection, much higher than the prevalence of urogenital infection in this population at only 1%. Prevalence was also found to be increasing at a relative rate of 2% per year for both anorectal and oropharyngeal infections (Tables 5–6).
These findings are concerning given these estimated high levels of infection, the widespread AMR observed in gonococcal strains and the critical role played by the oropharynx in the development of gonococcal AMR [2,55-59]. The oropharynx can be inhabited by diverse Neisseria species, capable of harbouring a range of genetic elements associated with antibiotic resistance, acquired through various past exposures to antibiotics [55,56].
The increase in infection transmission in sexual networks of MSM and MSWs may reflect higher number of sexual partners facilitated by availability of social media apps [2,60,61], increased use of chemsex [62-66] and the introduction of HIV pre-exposure prophylaxis leading to increases in unprotected and risky sexual behaviour [67,68].
The results indicate several other notable findings. Highest NG prevalence was observed among sexual contacts of persons infected with NG or CT, regardless of the anatomical site of infection. This finding highlights the criticality of partner notification and expedited partner therapy services and affirms the role of these services as part of the WHO Global Health Sector Strategy on STIs [9,10]. In all analyses and regardless of anatomical site, men had a higher prevalence of infection than women. This finding further supports the proportionally higher role of sexual networks of high-risk groups among MSM, MSWs and transgender people in NG transmission in Europe. Prevalence of infection among infertility clinic attendees was similar to that in the general population, unlike in other regions such as the Middle East and North Africa where it was considerably higher [5], perhaps reflecting better access to reproductive and screening services. No differences in prevalence were observed by age group, European subregion or country income level, regardless of anatomical site, suggesting that exposure to infection may not be restricted to younger persons but also occurs among older cohorts, and that infection transmission may not vary substantially within Europe.
This study has limitations. Data availability and quality varied across European countries, anatomical sites and population groups. Studies were missing for 16 of the 53 European countries. Western and northern Europe had a higher number of conducted studies compared with other subregions, as shown in Supplementary Table S3. Research on urogenital infections was more common, whereas studies on oropharyngeal infections were scarce. Prevalence studies were common in general populations where NG prevalence is typically lower. However, in key populations like MSM and FSWs, where prevalence levels were higher, the number of conducted studies was comparatively lower.
The included studies demonstrated diversity in assay types, sample sizes, sampling methods and response rates. Over time, there were shifts in the usage of diagnostic assays, and most studies used convenience sampling instead of probability-based methods. A consistent trend was noted, with smaller studies reporting higher prevalence levels, indicating a strong small-study effect across all analyses. Formal assessment of publication bias was not possible due to methodological challenges associated with evaluating it for proportion measures [69]. Given the extensive scope of this review encompassing multiple diverse population types, certain population categories, such as MSM, transgender people and MSWs were combined for analysis as they are epidemiologically related and exhibit somewhat related levels of infection risk.
However, data were available for 37 countries, constituting 90% of Europe’s total population [70]. The countries without data primarily comprised small populations and were not representative of the overall European population. Despite variations in assay type, sampling method and response rate among studies, these factors did not appear to influence prevalence, as indicated by the meta-regression analyses across anatomical sites. Although there was heterogeneity in prevalence, a large portion of this heterogeneity was explained by epidemiological factors and study methods in subsequent meta-regression analyses.
The study incorporated an extensive volume of NG prevalence data, comprising 1,573 prevalence measures and including 2,199 stratified measures. This dataset surpasses those published for other regions [6], enabling diverse analyses across anatomical sites and facilitating the identification of infection patterns in different population types. Despite variations in the number of studies across categories and strata, there was a meaningful number of studies even in categories and strata with sparse data points. Most studies were published after 2010, a period marked by significant improvement in study design, diagnostic assays and laboratory methods compared with earlier years. While the review was based on data up to 2021, it is improbable that very recent data would appreciably impact the findings, as changes in prevalence typically take several years to materialise and be observed. Therefore, the limitations of this study are not likely to have affected the findings, and the results should be representative, applicable and generalisable for the European Region.
Conclusions
Neisseria gonorrhoeae epidemiology in Europe up to 2021, presents with two distinct and contrasting epidemiologies. Infection transmission through vaginal sex appears to be decreasing leading to lower prevalence of urogenital infection in populations exposed to NG through heterosexual sexual networks. Meanwhile, infection transmission through anal and oral sex is increasing leading to higher prevalence of anorectal and oropharyngeal infection among populations such as MSM. This increased transmission could foster opportunities for new drug-resistant strains to emerge. Europe is far from achieving the WHO target of 90% incidence reduction by 2030. Controlling infection transmission requires a major expansion of STI services combined with the introduction of novel interventions such as vaccines. The current vaccines under development may provide a much-needed tool to fundamentally tackle NG infection and its drug resistance in Europe and elsewhere.
Ethical statement
Ethical approval was not required for this study as it entailed a systematic review of publicly available data.
Funding statement
This work was supported by the Biomedical Research Program at Weill Cornell Medicine in Qatar and by the Qatar Research, Development and Innovation (ARG01-0522-230273) and Qatar National Research Fund (NPRP 9-040-3-008).
Acknowledgements
The authors are grateful to Ms. Adona Canlas for administrative support. This publication was made possible by ARG01-0522-230273 from the Qatar Research, Development and Innovation and NPRP grant number 9-040-3-008 from the Qatar National Research Fund (a member of Qatar Foundation). The findings achieved herein are solely the responsibility of the authors. The authors are also grateful for infrastructure support provided by the Biomedical Research Program and the Biostatistics, Epidemiology, and Biomathematics Research Core, both at Weill Cornell Medicine in Qatar.
Supplementary Data
Conflict of interest: None declared.
Authors’ contributions: OC, SM, and MH conducted the systematic search, data extraction, and data analysis. OC wrote the first draft of the paper with SM, MH, and LJA. EHE contributed to study design. LJA conceived the study and led the data extraction and analyses and interpretation of the results. All authors contributed to drafting and revising the manuscript.
References
- 1.Kirkcaldy RD, Weston E, Segurado AC, Hughes G. Epidemiology of gonorrhoea: a global perspective. Sex Health. 2019;16(5):401-11. 10.1071/SH19061 [DOI] [PMC free article] [PubMed] [Google Scholar]
- 2.Unemo M, Seifert HS, Hook EW, 3rd, Hawkes S, Ndowa F, Dillon JR. Gonorrhoea. Nat Rev Dis Primers. 2019;5(1):79. 10.1038/s41572-019-0128-6 [DOI] [PubMed] [Google Scholar]
- 3.Neslon K. E., Williams CM. Infectious disease Epidemiology: Theory and Practice. Second Edition ed. Sudbury, Massachussets: Jones and Bartlett Publishers; 2007. [Google Scholar]
- 4.Centers for Disease Control and Prevention (CDC). Sexually Transmitted Diseases (STDs): Gonorrhoea - CDC Fact Sheet. Atlanta: CDC; 2022. [Accessed: 30 Mar 2023]. Available from: http://www.cdc.gov/std/gonorrhoea/stdfact-gonorrhoea.htm.
- 5.Chemaitelly H, Majed A, Abu-Hijleh F, Blondeel K, Matsaseng TC, Kiarie J, et al. Global epidemiology of Neisseria gonorrhoeae in infertile populations: systematic review, meta-analysis and metaregression. Sex Transm Infect. 2021;97(2):157-69. 10.1136/sextrans-2020-054515 [DOI] [PMC free article] [PubMed] [Google Scholar]
- 6.Rowley J, Vander Hoorn S, Korenromp E, Low N, Unemo M, Abu-Raddad LJ, et al. Chlamydia, gonorrhoea, trichomoniasis and syphilis: global prevalence and incidence estimates, 2016. Bull World Health Organ. 2019;97(8):548-562P. 10.2471/BLT.18.228486 [DOI] [PMC free article] [PubMed] [Google Scholar]
- 7.Centers for Disease Control and Prevention (CDC). Sexually Transmitted Disease Surveillance, 2019. Atlanta: CDC; 2021. Available from: https://www.cdc.gov/std/statistics/2019/std-surveillance-2019.pdf.
- 8.European Centre for Disease Prevention and Control (ECDC). Gonorrhoea Annual epidemiological report for 2018. Stockholm: ECDC; 2020. Available from: https://www.ecdc.europa.eu/en/all-topics-zgonorrhoeasurveillance-and-disease-data/annual-epidemiological-reports-gonorrhoea.
- 9.World Health Organization (WHO). Global health sector strategy on sexually transmitted infections 2016-2021: toward ending STIs. Geneva: WHO; 2016. Available from: https://www.who.int/publications/i/item/WHO-RHR-16.09http://
- 10.World Health Organization (WHO). Global health sector strategies on, respectively, HIV, viral hepatitis and sexually transmitted infections for the period 2022-2030. Geneva: WHO; 2022. Available from: https://www.who.int/publications/i/item/9789240053779.
- 11.Wi T, Lahra MM, Ndowa F, Bala M, Dillon JR, Ramon-Pardo P, et al. Antimicrobial resistance in Neisseria gonorrhoeae: Global surveillance and a call for international collaborative action. PLoS Med. 2017;14(7):e1002344. 10.1371/journal.pmed.1002344 [DOI] [PMC free article] [PubMed] [Google Scholar]
- 12.Lewis DA. Global resistance of Neisseria gonorrhoeae: when theory becomes reality. Curr Opin Infect Dis. 2014;27(1):62-7. 10.1097/QCO.0000000000000025 [DOI] [PubMed] [Google Scholar]
- 13.Bolan GA, Sparling PF, Wasserheit JN. The emerging threat of untreatable gonococcal infection. N Engl J Med. 2012;366(6):485-7. 10.1056/NEJMp1112456 [DOI] [PubMed] [Google Scholar]
- 14.Kirkcaldy RD, Harvey A, Papp JR, Del Rio C, Soge OO, Holmes KK, et al. Neisseria gonorrhoeae Antimicrobial Susceptibility Surveillance - The Gonococcal Isolate Surveillance Project, 27 Sites, United States, 2014. MMWR Surveill Summ. 2016;65(7):1-19. 10.15585/mmwr.ss6507a1 [DOI] [PubMed] [Google Scholar]
- 15.Unemo M, Lahra MM, Cole M, Galarza P, Ndowa F, Martin I, et al. World Health Organization Global Gonococcal Antimicrobial Surveillance Program (WHO GASP): review of new data and evidence to inform international collaborative actions and research efforts. Sex Health. 2019;16(5):412-25. 10.1071/SH19023 [DOI] [PMC free article] [PubMed] [Google Scholar]
- 16.World Health Organization (WHO). Global priority list of antibiotic-resistant bacteria to guide research, discovery, and development of new antibiotics. Geneva: WHO; 2017. Available from: http://remed.org/wp-content/uploads/2017/03/lobal-priority-list-of-antibiotic-resistant-bacteria-2017.pdf.
- 17.World Health Organization (WHO). Global action plan to control the spread and impact of antimicrobial resistance in Neisseria gonorrhoeae. Geneva: WHO; 2012. Available from: https://apps.who.int/iris/bitstream/handle/10665/44863/9789241503501_eng.pdf?sequence=1.
- 18.Petousis-Harris H, Paynter J, Morgan J, Saxton P, McArdle B, Goodyear-Smith F, et al. Effectiveness of a group B outer membrane vesicle meningococcal vaccine against gonorrhoea in New Zealand: a retrospective case-control study. Lancet. 2017;390(10102):1603-10. 10.1016/S0140-6736(17)31449-6 [DOI] [PubMed] [Google Scholar]
- 19.Semchenko EA, Tan A, Borrow R, Seib KL. The Serogroup B Meningococcal Vaccine Bexsero Elicits Antibodies to Neisseria gonorrhoeae. Clin Infect Dis. 2019;69(7):1101-11. 10.1093/cid/ciy1061 [DOI] [PMC free article] [PubMed] [Google Scholar]
- 20.Edwards JL, Jennings MP, Apicella MA, Seib KL. Is gonococcal disease preventable? The importance of understanding immunity and pathogenesis in vaccine development. Crit Rev Microbiol. 2016;42(6):928-41. 10.3109/1040841X.2015.1105782 [DOI] [PMC free article] [PubMed] [Google Scholar]
- 21.Edwards JL, Jennings MP, Seib KL. Neisseria gonorrhoeae vaccine development: hope on the horizon? Curr Opin Infect Dis. 2018;31(3):246-50. 10.1097/QCO.0000000000000450 [DOI] [PubMed] [Google Scholar]
- 22.Chemaitelly H, Harfouche M, Blondeel K, Matsaseng TC, Kiarie J, Toskin I, et al. Global epidemiology of Neisseria gonorrhoeae in infertile populations: protocol for a systematic review. BMJ Open. 2019;9(5):e025808. 10.1136/bmjopen-2018-025808 [DOI] [PMC free article] [PubMed] [Google Scholar]
- 23.Smolak A, Chemaitelly H, Hermez JG, Low N, Abu-Raddad LJ. Epidemiology of Chlamydia trachomatis in the Middle East and north Africa: a systematic review, meta-analysis, and meta-regression. Lancet Glob Health. 2019;7(9):e1197-225. 10.1016/S2214-109X(19)30279-7 [DOI] [PubMed] [Google Scholar]
- 24.Alareeki A, Osman AMM, Khandakji MN, Looker KJ, Harfouche M, Abu-Raddad LJ. Epidemiology of herpes simplex virus type 2 in Europe: systematic review, meta-analyses, and meta-regressions. Lancet Reg Health Eur. 2023;25:100558. 10.1016/j.lanepe.2022.100558 [DOI] [PMC free article] [PubMed] [Google Scholar]
- 25.AlMukdad S, Farooqui US, Harfouche M, Aldos L, Abu-Raddad LJ. Epidemiology of Herpes Simplex Virus Type 2 in Canada, Australia, and New Zealand: Systematic Review, Meta-Analyses, and Meta-Regressions. Sex Transm Dis. 2022;49(6):403-13. 10.1097/OLQ.0000000000001612 [DOI] [PMC free article] [PubMed] [Google Scholar]
- 26.AlMukdad S, Harfouche M, Wettstein A, Abu-Raddad LJ. Epidemiology of herpes simplex virus type 2 in Asia: A systematic review, meta-analysis, and meta-regression. Lancet Reg Health West Pac. 2021;12:100176. 10.1016/j.lanwpc.2021.100176 [DOI] [PMC free article] [PubMed] [Google Scholar]
- 27.Harfouche M, Abu-Hijleh FM, James C, Looker KJ, Abu-Raddad LJ. Epidemiology of herpes simplex virus type 2 in sub-Saharan Africa: Systematic review, meta-analyses, and meta-regressions. EClinicalMedicine. 2021;35:100876. 10.1016/j.eclinm.2021.100876 [DOI] [PMC free article] [PubMed] [Google Scholar]
- 28.Harfouche M, Alareeki A, Osman AMM, Alaama AS, Hermez JG, Abu-Raddad LJ. Epidemiology of herpes simplex virus type 2 in the Middle East and North Africa: Systematic review, meta-analyses, and meta-regressions. J Med Virol. 2023;95(3):e28603. 10.1002/jmv.28603 [DOI] [PubMed] [Google Scholar]
- 29.Harfouche M, Maalmi H, Abu-Raddad LJ. Epidemiology of herpes simplex virus type 2 in Latin America and the Caribbean: systematic review, meta-analyses and metaregressions. Sex Transm Infect. 2021;97(7):490-500. 10.1136/sextrans-2021-054972 [DOI] [PMC free article] [PubMed] [Google Scholar]
- 30.Chemaitelly H, Weiss HA, Calvert C, Harfouche M, Abu-Raddad LJ. HIV epidemiology among female sex workers and their clients in the Middle East and North Africa: systematic review, meta-analyses, and meta-regressions. BMC Med. 2019;17(1):119. 10.1186/s12916-019-1349-y [DOI] [PMC free article] [PubMed] [Google Scholar]
- 31.Chemaitelly H, Weiss HA, Smolak A, Majed E, Abu-Raddad LJ. Epidemiology of Treponema pallidum, Chlamydia trachomatis, Neisseria gonorrhoeae, Trichomonas vaginalis, and herpes simplex virus type 2 among female sex workers in the Middle East and North Africa: systematic review and meta-analytics. J Glob Health. 2019;9(2):020408. 10.7189/jogh.09.020408 [DOI] [PMC free article] [PubMed] [Google Scholar]
- 32.Higgins JPT, Green S. Cochrane Collaboration. Cochrane handbook for systematic reviews of interventions. Chichester, England; Hoboken, NJ: Wiley-Blackwell; 2008. xxi, 649 p. p. [Google Scholar]
- 33.Page MJ, McKenzie JE, Bossuyt PM, Boutron I, Hoffmann TC, Mulrow CD, et al. The PRISMA 2020 statement: an updated guideline for reporting systematic reviews. BMJ. 2021;372:n71. 10.1136/bmj.n71 [DOI] [PMC free article] [PubMed] [Google Scholar]
- 34.Moher D, Liberati A, Tetzlaff J, Altman DG, PRISMA Group . Preferred reporting items for systematic reviews and meta-analyses: the PRISMA statement. PLoS Med. 2009;6(7):e1000097-6. 10.1371/journal.pmed.1000097 [DOI] [PMC free article] [PubMed] [Google Scholar]
- 35.World Health Organization (WHO). Countries. Geneva: WHO. [Accessed: 19 Jan 2023]. Available from: https://www.who.int/countries
- 36.World Atlas. Europe countries and regions. Available from: https://www.worldatlas.com/articles/the-four-european-regions-as-defined-by-the-united-nationsgeoscheme-for-europe.html.
- 37.El-Kettani A, Mahiané G, Bennani A, Abu-Raddad L, Smolak A, Rowley J, et al. Trends in adult Chlamydia and Gonorrhoea prevalence, incidence and urethral discharge case reporting in Morocco over 1995-2015—Estimates using the spectrum-sexually transmitted infection model. Sex Transm Dis. 2017;44(9):557-64. 10.1097/OLQ.0000000000000647 [DOI] [PMC free article] [PubMed] [Google Scholar]
- 38.Smolak A, Rowley J, Nagelkerke N, Kassebaum NJ, Chico RM, Korenromp EL, et al. Trends and predictors of syphilis prevalence in the general population: global pooled analyses of 1103 prevalence measures including 136 million syphilis tests. Clin Infect Dis. 2018;66(8):1184-91. 10.1093/cid/cix975 [DOI] [PMC free article] [PubMed] [Google Scholar]
- 39.Korenromp EL, Mahiané G, Rowley J, Nagelkerke N, Abu-Raddad L, Ndowa F, et al. Estimating prevalence trends in adult gonorrhoea and syphilis in low- and middle-income countries with the Spectrum-STI model: results for Zimbabwe and Morocco from 1995 to 2016. Sex Transm Infect. 2017;93(8):599-606. 10.1136/sextrans-2016-052953 [DOI] [PMC free article] [PubMed] [Google Scholar]
- 40.Hoy D, Brooks P, Woolf A, Blyth F, March L, Bain C, et al. Assessing risk of bias in prevalence studies: modification of an existing tool and evidence of interrater agreement. J Clin Epidemiol. 2012;65(9):934-9. 10.1016/j.jclinepi.2011.11.014 [DOI] [PubMed] [Google Scholar]
- 41.Clopper CJ, Pearson ES. The use of confidence or fiducial limits illustrated in the case of the binomial. Biometrika. 1934;26(4):404-13. 10.1093/biomet/26.4.404 [DOI] [Google Scholar]
- 42.Borenstein M, Hedges LV, Higgins JP, Rothstein HR. Introduction to meta-analysis: John Wiley & Sons; 2021. [Google Scholar]
- 43.Freeman MF, Tukey JW. Transformations related to the angular and the square root. Ann Math Stat. 1950;21(4):607-11. 10.1214/aoms/1177729756 [DOI] [Google Scholar]
- 44.Schwarzer G, Chemaitelly H, Abu-Raddad LJ, Rücker G. Seriously misleading results using inverse of Freeman-Tukey double arcsine transformation in meta-analysis of single proportions. Res Synth Methods. 2019;10(3):476-83. 10.1002/jrsm.1348 [DOI] [PMC free article] [PubMed] [Google Scholar]
- 45.Higgins JP, Thompson SG. Quantifying heterogeneity in a meta-analysis. Stat Med. 2002;21(11):1539-58. 10.1002/sim.1186 [DOI] [PubMed] [Google Scholar]
- 46.RStudio Team. RStudio: integrated development for R. RStudio, Inc., Boston, MA. Available from: http://www.rstudio.com/.
- 47.Schwarzer G. meta: An R package for meta-analysis. R News. 2007;7(3):40-5. Available from: https://cran.rstudio.org/doc/Rnews/Rnews_2007-3.pdf#page=40 [Google Scholar]
- 48.Stata Corporation LLC. Stata statistical software: release 14. College Station, TX, USA.2015. Available from: www. https://www.stata.com/stata14/
- 49.Low N, Broutet N, Adu-Sarkodie Y, Barton P, Hossain M, Hawkes S. Global control of sexually transmitted infections. Lancet. 2006;368(9551):2001-16. 10.1016/S0140-6736(06)69482-8 [DOI] [PubMed] [Google Scholar]
- 50.Smith JS, Robinson NJ. Age-specific prevalence of infection with herpes simplex virus types 2 and 1: a global review. J Infect Dis. 2002;186(s1) Suppl 1;S3-28. 10.1086/343739 [DOI] [PubMed] [Google Scholar]
- 51.Hallett TB, Aberle-Grasse J, Bello G, Boulos LM, Cayemittes MP, Cheluget B, et al. Declines in HIV prevalence can be associated with changing sexual behaviour in Uganda, urban Kenya, Zimbabwe, and urban Haiti. Sex Transm Infect. 2006;82(Suppl 1) Suppl 1;i1-8. 10.1136/sti.2005.016014 [DOI] [PMC free article] [PubMed] [Google Scholar]
- 52.Awad SF, Abu-Raddad LJ. Could there have been substantial declines in sexual risk behavior across sub-Saharan Africa in the mid-1990s? Epidemics. 2014;8(0):9-17. 10.1016/j.epidem.2014.06.001 [DOI] [PubMed] [Google Scholar]
- 53.Loeber O, Reuter S, Apter D, van der Doef S, Lazdane G, Pinter B. Aspects of sexuality education in Europe - definitions, differences and developments. Eur J Contracept Reprod Health Care. 2010;15(3):169-76. 10.3109/13625181003797280 [DOI] [PubMed] [Google Scholar]
- 54.Wijesooriya NS, Rochat RW, Kamb ML, Turlapati P, Temmerman M, Broutet N, et al. Global burden of maternal and congenital syphilis in 2008 and 2012: a health systems modelling study. Lancet Glob Health. 2016;4(8):e525-33. 10.1016/S2214-109X(16)30135-8 [DOI] [PMC free article] [PubMed] [Google Scholar]
- 55.Unemo M, Jensen JS. Antimicrobial-resistant sexually transmitted infections: gonorrhoea and Mycoplasma genitalium. Nat Rev Urol. 2017;14(3):139-52. 10.1038/nrurol.2016.268 [DOI] [PubMed] [Google Scholar]
- 56.Adamson PC, Klausner JD. The staying power of pharyngeal gonorrhea: implications for public health and antimicrobial resistance. Clin Infect Dis. 2021;73(4):583-5. 10.1093/cid/ciab074 [DOI] [PMC free article] [PubMed] [Google Scholar]
- 57.Lewis D. Gonorrhoea resistance among men who have sex with men: what's oral sex got to do with it?: Taylor & Francis; 2013. [Google Scholar]
- 58.Lewis DA. Will targeting oropharyngeal gonorrhoea delay the further emergence of drug-resistant Neisseria gonorrhoeae strains? Sex Transm Infect. 2015;91(4):234-7. 10.1136/sextrans-2014-051731 [DOI] [PubMed] [Google Scholar]
- 59.Manavi K, Zafar F, Shahid H. Oropharyngeal gonorrhoea: rate of co-infection with sexually transmitted infection, antibiotic susceptibility and treatment outcome. Int J STD AIDS. 2010;21(2):138-40. 10.1258/ijsa.2009.009167 [DOI] [PubMed] [Google Scholar]
- 60.Stolte G, Dukers NH, de Wit JB, Fennema H, Coutinho RA. A summary report from Amsterdam: increase in sexually transmitted diseases and risky sexual behaviour among homosexual men in relation to the introduction of new anti-HIV drugs. Euro Surveill. 2002;7(2):19-22. 10.2807/esm.07.02.00346-en [DOI] [PubMed] [Google Scholar]
- 61.Dodds JP, Nardone A, Mercey DE, Johnson AM. Increase in high risk sexual behaviour among homosexual men, London 1996-8: cross sectional, questionnaire study. BMJ. 2000;320(7248):1510-1. 10.1136/bmj.320.7248.1510 [DOI] [PMC free article] [PubMed] [Google Scholar]
- 62.Pakianathan M, Whittaker W, Lee MJ, Avery J, Green S, Nathan B, et al. Chemsex and new HIV diagnosis in gay, bisexual and other men who have sex with men attending sexual health clinics. HIV Med. 2018;19(7):485-90. 10.1111/hiv.12629 [DOI] [PubMed] [Google Scholar]
- 63.Tomkins A, George R, Kliner M. Sexualised drug taking among men who have sex with men: a systematic review. Perspect Public Health. 2019;139(1):23-33. 10.1177/1757913918778872 [DOI] [PubMed] [Google Scholar]
- 64.Hegazi A, Lee MJ, Whittaker W, Green S, Simms R, Cutts R, et al. Chemsex and the city: sexualised substance use in gay bisexual and other men who have sex with men attending sexual health clinics. Int J STD AIDS. 2017;28(4):362-6. 10.1177/0956462416651229 [DOI] [PubMed] [Google Scholar]
- 65.Guerra FM, Salway TJ, Beckett R, Friedman L, Buchan SA. Review of sexualized drug use associated with sexually transmitted and blood-borne infections in gay, bisexual and other men who have sex with men. Drug Alcohol Depend. 2020;216:108237. 10.1016/j.drugalcdep.2020.108237 [DOI] [PubMed] [Google Scholar]
- 66.González-Baeza A, Dolengevich-Segal H, Pérez-Valero I, Cabello A, Téllez MJ, Sanz J, et al. Sexualized drug use (Chemsex) is associated with high-risk sexual behaviors and sexually transmitted infections in HIV-positive men who have sex with men: data from the U-SEX GESIDA 9416 study. AIDS Patient Care STDS. 2018;32(3):112-8. 10.1089/apc.2017.0263 [DOI] [PubMed] [Google Scholar]
- 67.Ramchandani MS, Golden MR. Confronting rising STIs in the era of PrEP and treatment as prevention. Curr HIV/AIDS Rep. 2019;16(3):244-56. 10.1007/s11904-019-00446-5 [DOI] [PMC free article] [PubMed] [Google Scholar]
- 68.Kojima N, Davey DJ, Klausner JD. Pre-exposure prophylaxis for HIV infection and new sexually transmitted infections among men who have sex with men. AIDS. 2016;30(14):2251-2. 10.1097/QAD.0000000000001185 [DOI] [PubMed] [Google Scholar]
- 69.Hunter JP, Saratzis A, Sutton AJ, Boucher RH, Sayers RD, Bown MJ. In meta-analyses of proportion studies, funnel plots were found to be an inaccurate method of assessing publication bias. J Clin Epidemiol. 2014;67(8):897-903. 10.1016/j.jclinepi.2014.03.003 [DOI] [PubMed] [Google Scholar]
- 70.United Nations Department of Economic and Social Affairs. World Population Prospects, the 2022 Revision. 2022. Available from: https://population.un.org/wpp/Download/Standard/Population/
Associated Data
This section collects any data citations, data availability statements, or supplementary materials included in this article.