

Abstract
This article addresses the critical link between socioeconomic status and health outcomes in chronic disease patients, emphasizing the need for system-level outcome measurement stratified by socioeconomic status. Despite the acknowledged influence of social determinants, there is a lack of published studies analyzing chronic disease outcomes neighborhood by neighborhood. The importance of mapping as a public health tool, and the significance of analyzing outcomes at the neighborhood level is emphasized. The U.S. Census Bureau's hierarchy of space definitions is presented, particularly focusing on census tracts as a unique opportunity for analyzing chronic disease outcomes. Two Area-Based Deprivation Indices (ABDIs) - the Area Deprivation Index (ADI) and the Social Vulnerability Index (SVI) - as tools to measure socioeconomic disadvantage and vulnerability to environmental stressors, respectively are described. A brief survey of the weaknesses of ABDIs and limitations in addressing individual-level factors is addressed followed by a discussion of the challenges in translating patient address data into census block data. The evolving conversation around equity analysis and its impact on chronic disease management is presented. It highlights the willingness of public payers to tie payments to ABDIs, signaling a shift towards a more equitable healthcare system. Private insurers and health systems are urged to invest in geocoding strategies to understand and improve outcomes for the diverse neighborhoods they serve, acknowledging that the path forward involves addressing health disparities at the population level.
Background
It is widely recognized that socioeconomic status is a determining factor in health outcomes for patients with chronic diseases. Going back as far as 1987, the Alameda County Study in California found evidence that education and economic disparities directly contribute to poor health-related behaviors and the prevalence of chronic disease.1 More recently, a 2021 Australian study found that the increase in cost and utilization for disadvantaged chronic disease patients was 20% higher than their more privileged counterparts while in-hospital poor outcomes increased by 80% in the disadvantaged population.2 Multiple subsequent studies have confirmed this finding including a survey of populations in the American Mid-South which adds that “education-level disparities were more pronounced in health-related behaviors, whereas income-level disparities were more pronounced in [chronic health conditions].”3
Although we can readily acknowledge the influence of social determinates of health on chronic disease outcomes, there remains an alarming lack of system-level outcome measurement stratified by socioeconomic status. In short, published studies from either healthcare payors or providers that speak to the health outcomes of their chronic disease patients by analyzing socioeconomic status at a neighborhood-by-neighborhood level are scarce. This kind of analysis is not easy work, but it is vital to measure whether the care given produces desired results across the socioeconomic spectrum.
Defining a Neighborhood
The idea of mapping as a public health tool is hardly novel and maps have been used in the fight against disease as early as John Snow’s famous 1856 cholera map.4 A robust background on the topic of general mapping and Geographic Information System (GIS) tools has previously been covered in Highberger and Merriman-Nai’s “The Value (and Nuances) of Mapping as a Public Health Tool”5 and does not need to be reiterated here.
When considering analysis of the effectiveness of social determinates of health on chronic disease outcomes specifically, however, it is critical to choose an appropriate way to segment populations into groups that have common characteristics. In other words, equitable analysis must be done at the neighborhood level. To that end, in the United States, the US Census Bureau (UCB) has created a hierarchy of space definitions from County to Census Tract (see Figure 1) that allow for finer grains of data to be analyzed.
Figure 1.

'Census Small-Area Geography' Graphic from the U.S. Census Bureau6
According to the UCB, census tracts have three defining characteristics:
They have a target size of 4,000 people (although can vary from 1,200 to 8,000);
They are created with the intention of being maintained over a long period of time for historical comparison;
They follow “visible and identifiable features” or legal boundaries.6
Although variation can exist within even a small group of people, designating consistently held spaces allows for the tracking of neighborhoods both in comparison to other neighborhoods and to themselves over time. As a result, census tracts provide a unique opportunity to analyze outcomes for patients with chronic conditions.
A Tale of Two Indexes
Once a neighborhood has been defined, the next step in population health analysis is for researchers to systemically define those spaces in terms of socioeconomic factors. To this end, there are two Area-Based Deprivation Indices (ABDIs) that are commonly referenced when attempting to measure social determinates of health in each neighborhood area: the Area Deprivation Index (ADI) and Social Vulnerability Index (SVI).
Area Deprivation Index
The Area Deprivation Index is a statistical tool designed to assess the level of socioeconomic disadvantage within a specific geographic area. Developed by the University of Wisconsin School of Medicine and Public Health, the ADI considers multiple factors such as income, education, employment, and housing conditions to create a composite measure of deprivation. The index utilizes census tract data, allowing for a granular analysis of neighborhoods or communities.
Census tract scores are created on a 1-10 scale at the state level (See Delaware in Figure 2) and 1-100 scale nationally, with higher ADI scores indicate greater levels of deprivation, signaling areas with reduced access to resources, economic opportunities, and social services.8,9 The inherent value of this index has earned it the title of “The Most Scientifically Validated Social Exposome Tool Available For Policies Advancing Health Equity” in recent publication by its proponents.10
Figure 2.
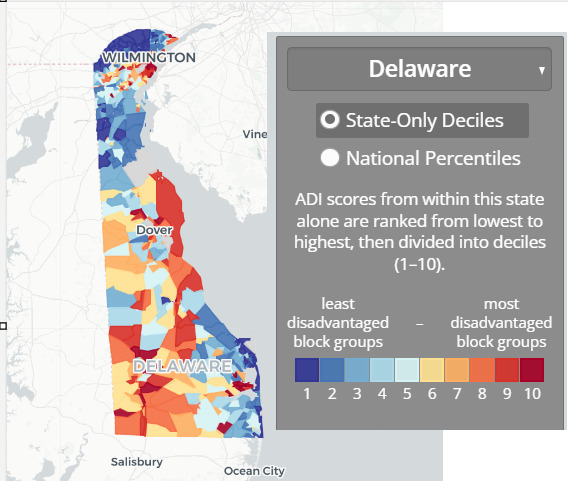
Area Deprivation Map from the Neighborhood Atlas®7
Social Vulnerability Index
The Social Vulnerability Index is a measure that evaluates a community's susceptibility to the impact of environmental and social stressors (Figure 3). Developed by the Agency for Toxic Substances and Disease Registry (ATSDR), the SVI incorporates factors such as socioeconomic status, household composition, and minority status. Census tracts are then ranked on a scale from 0 (Least Vulnerable) to 1 (Most Vulnerable). By considering these variables, the SVI identifies communities that may face challenges in responding to and recovering from disasters, public health emergencies, or other adverse events. Higher SVI scores indicate increased vulnerability and a need for targeted interventions to enhance resilience.
Figure 3.

Social Vulnerability Map of Delaware11
Comparison
Researchers at the University of Michigan who recently performed statistical comparisons of the two indices were very clear in their finding that the “ADI and SVI are not interchangeable measures of socioeconomic deprivation at the tract level.”12 While both the ADI and SVI aim to capture aspects of social and economic disadvantage, they differ in their focus and application. The ADI primarily concentrates on measuring general socioeconomic deprivation within a geographic area, emphasizing factors like income and education. In contrast, the SVI places a specific emphasis on vulnerability to external stressors, including environmental hazards and public health emergencies with indicators related to social vulnerability, including minority status and housing composition.
In summary, the ADI is geared towards assessing overall deprivation, whereas the SVI is tailored to identify communities at higher risk during crises. Depending on the research or policy goals, one or both indices may be employed to gain a comprehensive understanding of the challenges faced by different communities and to target interventions effectively.
Limitations
One notable constraint on the use of both ABDIs is the potential for oversimplification which masks internal variations and nuances. This may obscure the true extent of deprivation experienced by specific populations within a given area. Moreover, ABDIs may not fully consider individual-level factors. No single score can sum up the entire social history or individual needs of a given patient.
The Advisory Board publication recently reported that when the Centers for Medicare & Medicaid Services (CMS) introduced the ADI in 2022 to adjust payment rates and quality incentives in certain healthcare payment models the reception was mixed.13 Some continue to raise concerns that the ADI's methodology may not accurately represent health disparities, particularly in densely populated urban areas due to factors like average home prices. Stakeholders, including provider organizations, are calling for improvements to the ADI's methodology, suggesting considerations for community-level barriers, regional adjustments, and incorporation of additional metrics like life expectancy.
The Insufficiency of 5-Digit ZIP Code in Socioeconomic Analysis
To understand the variation in neighborhoods that can exist within a single zip code one only needs to look at the most populated ZIP code in Delaware, 19720. According to American Community Survey 2022 5-Year Data this zip code covers a geographic area of about 38.3 square miles in the northwest of the state and contains approximately 60,514 residents.14
If only looking at the ADI ranking for this zip code in aggregate, one can observe that the mean ADI for this zip code is 6.6, the median ADI IS 7, and the mode ADI is 5. However, when a distribution is created (Figure 4) it becomes obvious that aggregating these neighborhoods into a single value would be useless for equity analysis when looking at chronic disease patients.
Figure 4.

2021 ADI Census Block Group Distribution Within 19720
Distribution of census blocks within zip code 19720 is based on 2022 Area Deprivation Index data.9 Census blocks marked GQ are suppressed from ranking due to a high group quarters population.
Bearing in mind that the higher the ADI ranking the more vulnerable the population, one can note that 2,079 census block groups received a rank between a more privileged 2 to 5 while 3,035 were ranked between a more vulnerable 6 and 10. It becomes clear at this grain of data that there are highly vulnerable neighborhoods (ranks 8 to 10) within this zip code that effectively disappear if analysis is aggregated above the census block level.
Moving Medical Data from Simple Demographics to Population Description
The typical demographic data capture into an electronic medical record includes elements such as age, sex, race, and home address. However, this captured patient address data is often difficult to translate into an Area-Based Deprivation Index for the simple reason that, typically, only five-digit zip codes are captured. By the same token, medical claims files provided by private insurance payers also will only include 5 digits. However, determining a patient’s neighborhood status with either the ADI or SVI requires a 9-digit ZIP code (ZIP+4) to determine the patient’s census block group. One notable exception: CMS does provide 9-digit zip codes as part of its beneficiary information.
This deficit of four digits may not seem on its face to be a great barrier but the process of geocoding every patient’s address into a neighborhood often requires investment in the time of trained staff and expensive software. It is an overhead cost that may have obvious benefits to population health but is often not directly tied to reimbursement.
Individual research and publications use the ADI in studies on chronic conditions to great effect, such as the study which recently found that in Delaware Medicaid recipients between the ages of 8 and 18 “communities with ADI greater than or equal to 50 was associated with 60% greater odds of a hypertension diagnosis.”15 However, at the enterprise level, health systems and insurers alike are slow to take on the cost and effort associated with a comprehensive geocoding strategy that would allow rapid iterations of these kinds of analysis within chronic disease management programs.
The Path Forward
The conversation around the use of ABDIs in population health and their impact on chronic disease management is only in its nascent stages. Public payers have already shown their willingness to tie payments to the ADI and where CMS leads others in time will inevitably follow. Public policy will ultimately shape the future of ABDIs but in the meantime private insurers and health systems who embrace creating equitable systems of care as one of their core values are faced with a difficult truth: without an investment in geocoding strategies, it is impossible to know if they are truly changing outcomes for the neighborhoods that they serve.
References
- 1.Haan, M., Kaplan, G. A., & Camacho, T. (1987, June). Poverty and health. Prospective evidence from the Alameda County Study. American Journal of Epidemiology, 125(6), 989–998. 10.1093/oxfordjournals.aje.a114637 [DOI] [PubMed] [Google Scholar]
- 2.Yong, J., & Yang, O. (2021, March). Does socioeconomic status affect hospital utilization and health outcomes of chronic disease patients? The European Journal of Health Economics, 22(2), 329–339. 10.1007/s10198-020-01255-z [DOI] [PubMed] [Google Scholar]
- 3.Oates, G. R., Jackson, B. E., Partridge, E. E., Singh, K. P., Fouad, M. N., & Bae, S. (2017). Sociodemographic Patterns of Chronic Disease: How the Mid-South Region Compares to the Rest of the Country. American journal of preventive medicine, 52(1S1), S31–S39. 10.1016/j.amepre.2016.09.004 [DOI] [PMC free article] [PubMed]
- 4.Snow, J. (1856, January). On the mode of communication of cholera. Edinburgh Medical Journal, 1(7), 668–670. [PMC free article] [PubMed] [Google Scholar]
- 5.Highberger, J. P., & Merriman-Nai, S. (2021, July 15). the value (and nuances) of mapping as a public health tool. Delaware Journal of Public Health, 7(3), 6–9. 10.32481/djph.2021.07.003 [DOI] [PMC free article] [PubMed] [Google Scholar]
- 6.US Census Bureau Staff. (2022, April 11). United States Census Bureau Glossary. Accessed Feb 21, 2024. Census.gov. https://www.census.gov/programs-surveys/geography/about/glossary.html Accessed Feb 21, 2024
- 7.Neighborhood Atlas. (n.d.). Delaware. Retrieved from https://www.neighborhoodatlas.medicine.wisc.edu/mapping
- 8.Kind, A. J. H., & Buckingham, W. R. (2018, June 28). Making neighborhood-disadvantage metrics accessible - The Neighborhood Atlas. The New England Journal of Medicine, 378(26), 2456–2458. 10.1056/NEJMp1802313 [DOI] [PMC free article] [PubMed] [Google Scholar]
- 9.University of Wisconsin School of Medicine and Public Health. (2021). Area Deprivation Index Downloaded from https://www.neighborhoodatlas.medicine.wisc.edu/ Accessed Feb 21,2024
- 10.Powell, W. R., & Sheehy, A. M. Kind, Kind J.H. (2023) "The Area Deprivation Index Is The Most Scientifically Validated Social Exposome Tool Available For Policies Advancing Health Equity", Health Affairs Forefront. DOI: 10.1377/forefront.20230714.676093 [DOI]
- 11.Agency for Toxic Substances and Disease Registry. (2020). CDC/ATSDR Social vulnerability index (SVI). Retrieved from https://www.atsdr.cdc.gov/placeandhealth/svi/interactive_map.html
- 12.Rollings, K. A., Noppert, G. A., Griggs, J. J., Melendez, R. A., & Clarke, P. J. (2023, October 5). Comparison of two area-level socioeconomic deprivation indices: Implications for public health research, practice, and policy. PLoS One, 18(10), e0292281. 10.1371/journal.pone.0292281 [DOI] [PMC free article] [PubMed] [Google Scholar]
- 13.Advisory Board Staff. (2023). Exploring the impact of CMS’ ADI tool on underserved communities., http://www.advisory.com/daily-briefing/2023/06/29/adi-payment-models Accessed Feb, 22, 2024
- 14.U.S. Census Bureau. (2022). American Community Survey 5-year estimates. Retrieved from Census Reporter Profile page for 19720 http://censusreporter.org/profiles/86000US19720-19720/
- 15.Baker-Smith, C. M., Yang, W., McDuffie, M. J., Nescott, E. P., Wolf, B. J., Wu, C. H., et al. Akins, R. E. (2023, March 1). Association of area deprivation with primary hypertension diagnosis among youth Medicaid recipients in Delaware. JAMA Network Open, 6(3), e233012. 10.1001/jamanetworkopen.2023.3012 [DOI] [PMC free article] [PubMed] [Google Scholar]