

Abstract
Glycolysis is a universal metabolic process that breaks down glucose to produce ATP and biomass precursors. The Entner-Doudoroff (ED) pathway is a glycolytic pathway that parallels the textbook glycolysis but yields half as much ATP. Accordingly, in organisms that possess both glycolytic pathways (e.g., Escherichia coli), its raison d’être remains a mystery. Here we find that the ED pathway provides a selective advantage during growth acceleration. Upon carbon and nitrogen upshifts, E. coli accelerates growth faster with than without the ED pathway. Concurrent isotope tracing reveals that the ED pathway flux increases faster than that of the textbook glycolysis. We attribute the fast response time of the ED pathway to its strong thermodynamic driving force and streamlining of glucose import. Intermittent nutrient supply manifests the evolutionary advantage of the parallel glycolysis. Thus, the dynamic nature of an ostensibly redundant pathway’s role in promoting rapid adaptation constitutes a metabolic design principle.
Introduction
By survival of the fittest, modern organisms efficiently utilize available nutrients and rapidly adapt growth to changing environments1. Organisms across the domains of life use glycolysis, or the Embden-Meyerhof-Parnas (EMP) pathway, for efficient generation of energy and biomass precursors2,3. Glycolysis is regulated to respond to environmental perturbations and changing cellular demands by rapidly modulating its flux while maintaining metabolic homeostasis4.
Most organisms possess alternative glycolytic routes, such as the phosphoketolase pathway5, the pentose phosphate pathway, and, common to microorganisms and plants, the Enter-Doudoroff (ED) pathway6 (Fig. 1a). The EMP textbook glycolysis and the ED glycolysis are parallel from a carbon-centric perspective as both pathways convert one glucose into two pyruvate molecules. The difference is that compared to the textbook glycolysis, which yields two ATP and two NADH, the ED pathway yields one ATP, one NADH, and one NADPH (Fig. 1b). Despite the less efficient ATP generation, some microorganisms exclusively use the ED pathway due to its lower protein burden (i.e., fewer reaction steps) and higher exergonicity (i.e., greater thermodynamic driving force; Fig. 1b) compared to the textbook glycolysis7–9.
Fig. 1: The ED pathway is a parallel glycolytic pathway that does not affect cell growth rate.

a, The EMP glycolysis (red) and the ED glycolysis (blue) are parallel, and they share the steps of lower glycolysis (purple). Essential genes are marked with ‡. b, The EMP and ED pathways are parallel carbon-wise with a bioenergetic difference. The ED pathway is thermodynamically more forward-driven (i.e., ΔG is more negative). c, The impact of single non-essential gene knockouts on growth rate was predicted via flux balance analysis (FBA). d, WT and ED-pathway-deficient (i.e., Δedd and Δeda) strains were grown in minimal media with glucose or acetate as the sole carbon source and ammonia or arginine as the sole nitrogen source. Their exponential growth rates were measured. * represents P<0.05, ** represents P<0.01, and *** represents P<0.001 by a two-tailed t-test. P values from left to right, top to bottom: 0.003, 0.0014, 0.0009, 0.003, 0.015, 0.012. e, The absolute concentrations of the ED pathway intermediate 2-keto-3-deoxy-6-phosphogluconate (KDPG) were measured in WT, Δedd, and Δeda strains on the different carbon and nitrogen sources using LC-MS and an authenticated standard. Error bars represent the standard error of the mean (s.e.m.) with n=3 biological replicates. G6P stands for glucose-6-phosphate; F6P, fructose-6-phosphate; FBP, fructose-1,6-bisphosphate; DHAP, dihydroxyacetone phosphate; GAP, glyceraldehyde-3-phosphate; 6PGL, 6-phosphogluconolactone; 6PG, 6-phosphogluconate; BPG, 1,3-bisphosphoglycerate; 3PG, 3-phosphoglycerate; 2PG, 2-phosphoglycerate; PEP, phosphoenolpyruvate; and PYR, pyruvate. pts represents the gene(s) for phosphotransferase system; hk, hexokinase; pgi, phosphoglucoisomerase; pfk, phosphofructokinase; fba, fructose bisphosphate aldolase; tpi triose phosphate isomerase; zwf, glucose-6-phosphate dehydrogenase; pgl, 6-phosphogluconolactonase; edd, phosphogluconate dehydratase; eda, 2-dehydro-3-deoxy-phosphogluconate aldolase; gapdh, glyceraldehyde-3-phosphate dehydrogenase; pgk, phosphoglycerate kinase; pgm, phosphoglycerate mutase; eno, enolase; and pyk, pyruvate kinase.
Interestingly, many organisms including 14% of genome-annotated prokaryotes possess both the EMP and the ED pathways7. Despite the apparent redundancy, the ED pathway facilitates sugar acid (including gluconate) catabolism10 and genetic resilience11–13. The two glycolytic pathways also have different transcriptional regulation mechanisms14. In E. coli, the unique intermediate of the ED pathway 2-keto-3-deoxy-6-phosphogluconate (KDPG) deactivates transcriptional repressor YebK, which is implicated in determining the duration of the lag phase during nutrient downshift15. However, our understanding of the ED pathway is still limited compared to that of the EMP pathway16. Furthermore, there is no clear experimental support for an evolutionary advantage of concurrent utilization of the parallel glycolytic pathways.
We were curious why an organism would retain and operate the ED pathway when it already has the EMP pathway that generates ATP more efficiently. We sought to identify conditions in which the ED pathway’s contribution to cells becomes meaningful. In stable nutrient environments, knocking out the ED pathway in E. coli had a negligible effect on cell growth. When we subjected the cells to nutrient upshift, however, the initial acceleration of growth of the ED-pathway-capable strain was significantly faster than that of the knockout strain. We found this difference to occur on a fast timescale (<10 mins.) during which cells would exhibit a metabolic response without substantial proteome reallocation.
To gain a mechanistic insight into the observed growth dynamics, we developed a strategy for discerning the fluxes through the two glycolytic pathways. Using stable isotope tracers and liquid chromatography-mass spectrometry (LC-MS), we observed that the ratio of ED to EMP pathway fluxes rapidly increased to 20% upon nitrogen upshift and 130% upon carbon upshift. Thus, the ED pathway aided cells in meeting the rapidly increasing energetic and carbon demand. This transitory metabolic benefit underlay the selective advantage of parallel glycolysis under intermittent nutrient availability. We surmise that organisms may employ parallel pathways elsewhere in metabolism to promote rapid adaptation in dynamic environments.
Results
The ED pathway does not affect growth rates
To assess the contribution of the EMP and ED glycolytic enzymes on growth rates, we performed flux balance analysis (FBA) on the genome-scale metabolic model of E. coli (iAF1260)17. We simulated knocking out individual nonessential genes of the EMP and ED glycolysis and determined the maximum growth rates within the feasible flux space (Fig. 1c). Unlike the EMP pathway genes, which slowed growth upon knockout, the ED pathway genes had no effect on growth rates. We validated FBA predictions experimentally by comparing the growth rates of E. coli with and without the ED pathway genes (i.e., WT vs. Δedd vs. Δeda) under various nutrient conditions (Fig. 1d). The WT and Δedd strains had indistinguishable growth rates, corroborating our FBA simulations. We observed a 17% slowdown of growth in the Δeda strain. This difference was attributable to a 100-fold buildup of the ED pathway intermediate KDPG to as much as 34 mM in the Δeda mutant (Fig. 1e), whose accumulation is correlated with bacteriostasis18. Nonetheless, clean elimination of the ED pathway in the Δedd strain showed that the ED pathway itself exerted a negligible direct effect on exponential growth rates.
Parallel glycolysis promotes rapid growth acceleration
A key trait of modern organisms is their ability to quickly detect and utilize scarce nutrient resources once they become available19,20. Since WT and Δedd strains showed no differences in stable environments, we investigated the role of the ED pathway during dynamic adaptation. We subjected these two strains to carbon or nitrogen upshift, a transition from a nutrient-limited to a replete state. Carbon limitation was achieved by using minimal media with a less favorable carbon source acetate in lieu of glucose. Acetate forces cells to use the glyoxylate shunt and gluconeogenesis to produce larger carbon backbones and supports slow growth21,22. Nitrogen limitation was introduced by culturing cells in a low initial NH4Cl concentration (2 mM), which gets depleted and stalls cell growth, or replacing NH4Cl with arginine, a less favorable nitrogen source23. We induced upshift by spiking in glucose and NH4Cl to carbon- and nitrogen-limited cultures, respectively.
Upon upshift, both WT and Δedd strains immediately increased growth rates (Fig. 2). However, the transition paths from slow to fast growth differed between the two strains. Upon carbon upshift, WT cells increased growth faster than Δedd cells and maintained faster growth for 15 minutes until they both reached stable growth (Fig. 2a and Extended Data Fig. 1a). This trend was similar in the arginine-to-NH4Cl nitrogen upshift, in which WT cells accelerated growth and maintained faster growth than Δedd cells for an hour until the two strains reached the same stable growth rate (Fig. 2b and Extended Data Fig. 1b). For NH4Cl depletion to repletion, WT displayed a higher initial acceleration of growth in the first six minutes, but the Δedd strain outpaced WT in the subsequent 10 minutes (Fig. 2c). While the nitrogen upshifts brought both strains to the stable growth rate of ~0.8 hr−1 as in the nutrient-replete state, the carbon upshift did not. The incomplete recovery of the growth rate was due to the presence of high external acetate, which depletes intracellular metabolic intermediates that contribute to biomass synthesis24 (Extended Data Fig. 1c). These observations suggested that the ED pathway contributes to the faster growth acceleration during nutrient upshift.
Fig. 2: The ED glycolysis promotes rapid growth acceleration upon nutrient upshift.

a, WT and Δedd strains had been grown in minimal media with acetate as the sole carbon source, and at t=0 min glucose was spiked in at 0.2% (w/v). Growth rates were measured continuously during the carbon upshift. b, Similarly, growth rates of WT and Δedd cells in glucose minimal media were measured during nitrogen upshift from arginine as the sole nitrogen source to 10 mM NH4Cl. c WT and Δedd strains had been grown in limited ammonia media until nitrogen was depleted and growth stagnated, and at t=0 min NH4Cl was spiked in at 10 mM. d, The maximum acceleration of growth was quantified by taking the time derivative of growth rates in the first six to ten minutes of each nutrient upshift. Error bars represent the s.e.m. (n=3 biological replicates). P values are obtained by two-tailed t-tests.
To quantify this difference in growth dynamics, we computed growth acceleration, which is the time derivative of the specific growth rate (μ), which is the time derivative of log culture density. The maximal growth acceleration occurred in the first few (six to ten) minutes of all upshifts, and WT consistently outpaced Δedd during this period (Fig. 2d). Carbon upshifts from glycerol and succinate, which are lower glycolytic and TCA-cycle intermediates, to glucose showed similar trends of higher maximum acceleration in WT cells than in Δedd cells (Extended Data Fig. 2a). Unlike other upshifts, carbon upshift from mannose to glucose resulted in a muted initial (first eight minutes) growth acceleration in both WT and Δedd cells, followed by Δedd cells accelerating growth faster than WT cells in subsequent eight minutes (Extended Data Fig. 2b). The delayed and reversed growth acceleration hinted at a bottleneck in glucose uptake during upshift due to competition between glucose and mannose for the phosphotransferase system (PTS)25. When carbon upshift obviated the need for glycolysis (e.g., acetate to succinate), growth acceleration was comparable between the two strains (Extended Data Fig. 2c). This rapid growth acceleration (except for the case of upshift from one PTS sugar to another) reflected metabolic rewiring that is driven by changes in metabolite levels rather than enzyme levels.
Both glycolytic pathways activate upon nutrient upshift
We sought to gain mechanistic insights into the disparate growth acceleration with and without the ED pathway during nutrient upshift. Using LC-MS, we measured the levels of glycolytic intermediates and cofactors before and shortly after upshift (Fig. 3a). All three nutrient upshifts resulted in rapid changes in metabolite levels with the carbon upshift inducing the greatest overall change.
Fig. 3: Both EMP and ED glycolytic pathways are activated upon nutrient upshift.

a, The levels of glycolytic intermediates and cofactors were measured in WT and Δedd strains before and after carbon and nitrogen upshifts using LC-MS. Yellow and blue colors represent higher and lower levels relative to the pre-upshift levels of metabolites at t=0 min. b, c, Cumulative Gibbs free energies of reactions (ΔG) across the EMP pathway, the ED pathway, and gluconeogenesis (GNG) were obtained using the overall net reactions of the pathways and the concentrations of their initial substrates and final products (Supplementary Note 1) during upshift in (b) WT and (c) Δedd. Since the ED pathway was inactive in Δedd, its ΔG is shown in light red. The dotted lines represent the ΔG at the previous time points. Filled boxes indicate an increase in ΔG from the previous state and empty boxes indicate a decrease. Whiskers represent the s.e.m. (n=3–6 biological replicates).
In both WT and Δedd, carbon upshift increased the upper EMP glycolytic intermediates and 6-phosphogluconate (6PG) while lowering phosphoenolpyruvate (PEP), which had accumulated in the absence of glucose (Fig. 3a). The decrease in PEP levels reflected the unblocking of the PTS, which phosphorylates glucose using PEP while transporting glucose into the cell, upon glucose addition26. In the WT strain, Gibbs free energy change (ΔG) across the EMP and the ED glycolysis became more forward-driven (i.e., ΔΔG<0) to −54.8 kJ/mol and −87.9 kJ/mol, respectively, while ΔG of gluconeogenesis increased to 8.6 kJ/mol (ΔΔG=+10.8 kJ/mol) in three minutes of carbon upshift (Fig. 3b and Supplementary Note 1). Thus, the rapid metabolic shifts rendered glycolysis thermodynamically more favorable and gluconeogenesis unfavorable in WT. On the other hand, thermodynamic shifts in Δedd were less pronounced (Fig. 3c).
Nitrogen upshift increases glycolytic flux through a combination of upregulation of glucose transport by decreasing α-ketoglutarate (αKG), which inhibits Enzyme I (EI) of the PTS, and decreasing the reversibility of glycolytic steps27. Upon nitrogen upshift, the intermediates of glycolysis changed to a smaller extent in WT compared to carbon upshift (Fig. 3a), and as a result, we observed smaller ΔΔG in both the EMP and the ED glycolysis (Fig. 3b). ΔΔG of glycolytic pathways for Δedd in nitrogen upshift was larger than carbon upshift but otherwise comparable to nitrogen upshift in WT (Fig. 3c). While the initial values of overall ΔG of the EMP and ED pathways were substantially different, their ΔG changed similarly upon carbon and nitrogen upshift due to the similarity in the initial substrates and final products of the parallel pathways. However, the intermediate metabolites unique to each pathway (e.g., fructose-1,6-bisphosphate and KDPG), which do not contribute to overall pathway thermodynamics, displayed disparate dynamics (Fig. 3a), suggesting different mechanisms at play in modulating the two glycolytic pathways.
Asymmetric 13C-glucose reveals glycolytic fluxes
To quantify fluxes through the parallel glycolytic pathways, we needed a glucose tracer that differentially labels lower glycolytic metabolites depending on the pathway taken. Unlike the EMP glycolysis, in which each glucose produces a pair of triose phosphates (glyceraldehyde-3-phosphate, GAP) by cleaving fructose bisphosphate down the middle, the ED glycolysis shunts only the fourth, fifth, and sixth carbons of glucose to the shared lower glycolysis as a triose phosphate (Fig. 4a). With [1,2-13C2]glucose, the EMP pathway generates unlabeled (M+0) and doubly labeled (M+2) triose phosphate at a one-to-one ratio, whereas the ED pathway generates only M+0 triose phosphate. The EMP and ED glycolysis also result in unique positional isotope labeling of pyruvate (Fig. 4a) that can be distinguished by MS/MS fragmentation of valine (Fig. 4b). Furthermore, tracing [1,2-13C2]glucose informs us of the oxidative pentose phosphate pathway (OxPPP) flux, which uniquely generates singly labeled (M+1) triose phosphate (Extended Data Fig. 3a). In E. coli exponentially growing in a minimal medium replete with glucose and NH4Cl, 3-phosphoglycerate (3PG) and valine labeling measurement indicated a slow ED pathway flux relative to the EMP glycolysis (Fig. 4a,b).
Fig. 4: Asymmetrically 13C-labeled glucose tracers reveal parallel glycolytic fluxes.

a, With [1,2-13C2]glucose, only the EMP glycolysis generates labeled lower glycolytic intermediates. Both the EMP and the ED pathways produced labeled pyruvate but at different positions. The labeling fractions of 3PG in cells without nutrient limitation were measured using LC-MS and used to calculate the ED pathway activity (Supplementary Notes 2 and 3). b, Positional labeling of pyruvate was distinguished using LC-MS/MS. Isotopologues of valine, which is synthesized from two pyruvate molecules, were fragmented. The MS2 spectra revealed the positional labeling indicative of the ED pathway activity (Supplementary Note 3). c, The unlabeled fraction of 6PG from [5,6-13C2]glucose tracing indicates recursive pentose phosphate pathway (PPP) usage. Unlabeled 6PG is generated only from S7P and unlabeled GAP through the reactions in light red arrows. The labeling fractions of 6PG were measured using LC-MS and used to refine the quantification of glycolytic fluxes. Error bars represent the s.e.m. (n=3 biological replicates). RU5P stands for ribulose-5-phosphate; X5P, xylulose-5-phosphate; R5P, ribose-5-phosphate; E4P, erythrose-4-phosphate; S7P, sedoheptulose-7-phosphate; PGI, phosphoglucoisomerase; PFK, phosphofructokinase; FBA, fructose-1,6-bisphosphate aldolase; TPI, triose phosphate isomerase; G6PDH, glucose-6-phosphate dehydrogenase; PGL, phosphogluconolactonase; 6PGD, 6-phoshogluconate dehydrogenase; RPE, ribulose phosphate epimerase; RPI, ribose phosphate isomerase; TKT1 and TKT2, transketolase; and TAL, transaldolase.
The non-oxidative pentose phosphate pathway (non-OxPPP) and the reversibility of phosphoglucoisomerase (PGI) potentially obscures our flux quantitation by opening the door for carbons to recursively go through the PPP and produce various isotopomers of triose phosphate28,29. To disambiguate the central carbon metabolism fluxes, we also traced [5,6-13C2]glucose (Fig. 4c). Similar to [1,2-13C2]glucose, [5,6-13C2]glucose indicates the relative glycolytic fluxes based on the skewed labeling ratios but with the ED pathway flux contributing to M+2 triose phosphate (Extended Data Fig. 3b). Nonetheless, [5,6-13C2]glucose had two unique advantages: 1) it revealed that the extent of the PPP recycling, which generates unlabeled 6PG, was small (Fig. 4c); and 2) it solved central carbon metabolism fluxes by a simple orthogonal mass balance, which is attributed to these 13C not being shuffled in the PPP (Extended Data Fig. 3c). Using [1,2-13C2]- and [5,6-13C2]-glucose, we measured the labeling of 3PG, 6PG, and valine and solved the fluxes through the EMP pathway, the ED pathway, and the PPP (Supplementary Notes 2–4). These approaches revealed the ED pathway flux to be small compared to the EMP pathway flux (ED-to-EMP flux ratio was between 0.06 and 0.12) under the nutrient-replete condition.
The ED glycolysis accelerates faster than the EMP glycolysis
We hypothesized that the adaptive growth advantage of the WT over Δedd was due to the ED pathway enabling higher glycolytic flux in transitional periods. The total glycolytic flux increases during the carbon and nitrogen upshifts. In carbon-limited conditions (i.e., acetate but no glucose), glycolytic flux is zero because there is no carbon source available for glycolysis. Thus, carbon upshift to glucose necessarily accelerates glycolytic fluxes. On arginine, the glucose uptake rate of WT cells is 7.29 mmol gCDW−1 hr−1, and upon nitrogen upshift it increases to 11.7 mmol gCDW−1 hr−1 (ref. 27). However, how each glycolytic pathway contributes to the flux acceleration is unknown. Using [1,2-13C2] and [5,6-13C2]glucose, we investigated how the use of the parallel glycolytic pathways changed during carbon and nitrogen upshift. Glycolytic intermediates reach a stable labeling within a minute (Extended Data Fig. 4a) due their fast turnover (~1 s−1) (Extended Data Fig. 4b). Thus, their isotopic labeling can be approximated as a series of minute-scale pseudo-steady states. We measured the isotope labeling of 3PG and 6PG from [1,2-13C2]- and [5,6-13C2]-glucose tracers before and 3, 5, 10, and 30 minutes after upshift (Fig. 5a,b and Extended Data Fig. 5a,b).
Fig. 5: The ED pathway flux accelerates faster than the EMP glycolytic flux.

a, The ED-to-EMP flux ratios were obtained using the 3PG labeling from [1,2-13C2]glucose (green) upon carbon upshift. Due to some residual gluconeogenic activity, the 3PG labeling fractions were corrected using the mirror-image tracer [5,6-13C2]glucose (blue) (Supplementary Note 4). b, The ED-to-EMP flux ratios were measured during nitrogen upshift from arginine (red) and no nitrogen (yellow). c, Instantaneous glucose uptake rates (i.e., total glycolytic fluxes) were measured by the extent of accumulation of a G6P analogue 2-deoxyglucose-6-phosphate in WT and Δedd cells that were incubated with 2-deoxyglucose for five seconds at different time points of nutrient upshift. Statistical significance between the two strains was obtained by two-way ANOVA using strain and time as two variables. d, The EMP and the ED pathways have complementary roles. The EMP pathway maintains high homeostatic glycolytic flux while the ED pathway rapidly bolsters glycolytic flux upon increased biomass and energy demand. Error bars represent the s.e.m. (n=3 biological replicates).
The ED pathway’s contribution to overall glycolysis rapidly increased upon carbon and nitrogen upshifts. Upon carbon upshift, the ED pathway carried the major glycolytic flux, and after 10 minutes the ED-to-EMP flux ratio returned to the stable value observed in the nutrient-replete condition (Fig. 5a). Although we could not quantify the ED pathway flux at 0 minutes (i.e., in the carbon-limited condition) due to the absence of 13C glucose tracers, we found that even on acetate E. coli expressed the ED pathway enzymes (Extended Data Fig. 5c). Since any unlabeled glycolytic intermediates that had been derived from unlabeled acetate affect our ability to compute glycolytic fluxes accurately, we took extra caution by performing acetate-to-[U-13C6]glucose upshift to account for residual acetate-derived intermediates (Extended Data Fig. 5d and Supplementary Note 4). Both nitrogen upshifts from arginine and low NH4Cl rapidly increased the relative ED pathway flux (Fig. 5b). The extent of the ED pathway utilization during nitrogen upshift was smaller than that of carbon upshift, testifying to the need for a reliable glycolytic route even in thermodynamically less favorable times of early carbon upshift.
Contemporaneous with the increasing relative importance of the ED pathway, the absolute glucose uptake rates (i.e., total glycolytic fluxes) shot up upon nutrient upshifts (Fig. 5c). Within five minutes of glucose and NH4Cl addition to carbon- and nitrogen-limited cells, respectively, glucose uptake rates increased by as much as 40 mmol gCDW−1 hr−1 and as little as 2 mmol gCDW−1 hr−1 with WT cells displaying greater acceleration than Δedd cells. Taken together, our flux quantitation revealed that while the EMP pathway is the main stable glycolytic route, the ED pathway responds faster to upshift glycolysis (Fig. 5d). This faster acceleration of the ED pathway flux was consistent with our earlier observation that the ED pathway-capable WT accelerated growth faster than the Δedd ED pathway knockout strain even though they grew equally well under stable nutrient conditions.
Intermittent feeding favors parallel glycolysis
What is the evolutionary benefit of the parallel ED glycolysis? In nature, access to favorable nutrients is often limited because their supply is intermittent and subject to competition within microecosystems30. To answer this question, we cultured WT and Δedd strains on low glucose or low ammonia until the limiting nutrient was depleted and spiked in a low dose of the nutrient repeatedly after nutrient depletion. Under these intermittent nutrient feeding conditions, cells possessing both glycolytic pathways achieved increasingly denser cultures than Δedd cells (Fig. 6a). In three cycles of glucose upshift, WT achieved a cell density of 15% higher than Δedd. Similarly, four cycles of ammonia upshift widened the growth gap between the two strains to 5%. To test the competitiveness of the cells with parallel glycolysis in the community context, we repeated the intermittent feeding experiments with co-cultures of WT and Δedd cells that expressed a green and a red fluorescent protein, respectively, and counted them using flow cytometry. Regardless of the initial ratio of WT to Δedd cells, the proportion of ED-pathway-capable WT cells became increasingly higher over upshifts (Fig. 6b and Extended Data Fig. 6).
Fig. 6: The evolutionary benefit of the ED pathway emerges in intermittent nutrient feeding.

a, WT and Δedd strains were grown under intermittent supply of glucose or ammonia. Cultures were periodically spiked with low concentrations of glucose or ammonia shortly after growth halted. Error bars represent the s.e.m. (n=3 biological replicates). b, Co-cultures of WT and Δedd strains at varying initial WT-to-Δedd ratios were subjected to intermittent feeding of glucose or nitrogen. WT and Δedd cells, which were tagged with green and red fluorescent proteins respectively, were counted via flow cytometry. Shaded areas represent the s.e.m. (n=3 biological replicates). Reported statistics were calculated by linear regression with fixed intercepts for individual biological replicates of the WT-to-Δedd ratio over time. Maximum P values and minimum R2 values of biological replicates are shown. c, In the long-term evolution experiment (LTEE), twelve cultures of E. coli were transferred to fresh low-glucose media daily, inducing carbon upshift. From each culture, two clones were periodically sequenced. d, Development of nonsynonymous mutations and indels in the EMP and the ED pathways over 50,000 generations was compared to that of randomly sampled gene groups. e, The mutation history of the EMP and the ED pathways was monitored in all 24 sequenced strains over 50,000 generations. f, The ancestral strain and Ara+3, Ara+5, and Ara-2 strains isolated in the 5,000th generation were subjected to upshift from carbon starvation to glucose, and their growth acceleration was measured. Each box shows the three quartiles, and whiskers extend to the minimum and maximum values within 1.5-fold of the interquartile range (n=20 biological replicates). Statistical significance between strains was obtained by one-way ANOVA with Tukey’s HSD test for multiple comparison.
We further investigated the evolutionary relevance of the ED pathway using the E. coli long-term evolution experiment (LTEE)31. In the LTEE, twelve initial populations derived from REL606 and REL607 strains have been intermittently fed limiting amounts (25 mg/L) of glucose over 70,000 generations. The low glucose concentration led to glucose depletion, and daily subculturing into fresh media introduced carbon upshift every 6.6 generations (Fig. 6c).
We analyzed the genome sequences of the twelve populations over 50,000 generations. The accumulation of random and independent mutations would lead to mutation counts in individual genes approximating a Poisson distribution. Instead, we observed more than expected genes with two or more mutations (Extended Data Fig. 7a,b). Some genes even accumulated as many as 50 mutations across the 24 evolved strains (Extended Data Fig. 7c,d). Thus, the mutation history was suggestive of increasing adaptability to intermittent glucose supply.
We compared the mutation history of the EMP and the ED glycolytic pathways relative to other pathways. The ED pathway was highly mutated early on, reaching the 96th percentile of pathway mutations by 5,000 generations, while the EMP pathway was at the 67th percentile (Fig. 6d and Extended Data Fig. 8a). At 5,000 generations, none of the mutations in these pathways were silent (Extended Data Fig. 8b). In subsequent generations, the percentile ranks of both glycolytic pathways decreased, but the fractions of nonsynonymous and indel mutations remained above 50%. With mutations in earlier generations generally leading to a greater increase in the fitness of an organism32,33, the early mutations in the ED pathway manifested its importance under intermittent glucose supply. We probed the evolutionary interactions between the EMP and the ED pathways. Up to 30,000 generations, mutations occurred in either of the two glycolytic pathways (Fig. 6e). Furthermore, by 50,000 generations, 82% of those strains that carried mutations in glycolysis had only one of the two glycolytic pathways mutated (Extended Data Fig. 8c). These observations hint at the distinct utility of the EMP and the ED glycolysis in stable and transitional periods.
To experimentally validate the competitiveness of evolved strains in dynamic environments, we subjected the LTEE strains to carbon upshifts and measured their growth acceleration. We selected three of the twelve populations (Ara+3, which had the most mutations in the ED pathway genes, Ara+5, which had the lowest overall mutations, and Ara-2, which had the most mutations outside of the ED pathway genes) at 5,000th and 50,000th generations (Extended Data Fig. 8d). Upon upshift from carbon starvation, acetate, glycerol, and mannose to glucose, we found the general tendency of faster growth acceleration in strains evolved over 50,000 generations compared to the ancestral strain (Extended Data Fig. 8e). The strain from Ara+3 displayed the fastest mean growth acceleration during no-carbon-to-glucose and acetate-to-glucose upshifts. Based on these results and power analysis, we obtained sample sizes that would provide sufficient statistical power for testing the growth acceleration of the Ara+3 strain versus the ancestral and other strains at 5,000th generation. Upon glucose addition to acetate-fed and carbon-starved cultures, the Ara+3 and Ara-2 strains accelerated growth significantly (α=0.05) faster than the ancestral strain (Extended Data Fig. 9f), with the Ara+3 strain showing the highest improvement in growth acceleration (Fig. 6f). Taken together, short- and long-term intermittent feeding of glucose pointed to the adaptive and evolutionary importance of parallel glycolysis.
Discussion
Parallel reactions and pathways are prevalent in metabolism, yet the evolutionary advantage of their concurrent utilization remains incompletely understood. In bacteria, the phosphotransferase system (PTS) carries out the same function as the glucose transporter, hexokinase, and pyruvate kinase34. In eukaryotes, parallel pathways are commonly found in different organelles (e.g., one-carbon metabolism and partially the TCA cycle in the cytosol and mitochondria)35–37. Genetic redundancy is commonplace in diploids13. In all organisms, multiple isoforms of various enzymes exist.
The EMP and the ED pathways are parallel glycolytic pathways that perform perhaps the most foundational task in metabolism. In an organism with both glycolytic pathways, it is expected that they both play important roles lest one of them be deprecated. Interestingly, in stable environments, the ED pathway flux in E. coli is a small fraction of the EMP glycolysis, and when we knocked out the ED pathway, we did not find any growth defects.
Instead, we found the benefit of the ED pathway to emerge during transitional periods following nutrient upshift. In the first few minutes of carbon and nitrogen upshifts, cells with the ED pathway accelerated growth faster than those without. The quantitation of the EMP and the ED glycolytic fluxes revealed the disproportionately fast increase of the ED pathway flux concurrently with the fast growth acceleration. Thus, the ED glycolysis is designed to jump once scarce nutrients become available, whereas the EMP glycolysis, although slower to respond to nutrient upshift, is designed to efficiently generate ATP under stable environments. The parallel glycolytic pathways are complementary and ensure that organisms are evolutionarily competitive in both stable and dynamic environments.
How does the ED pathway facilitate faster acceleration of growth? At least three factors are at work: thermodynamic driving force, small-molecule-mediated regulation dictating rapid glucose import, and NADPH generation. In the carbon upshift experiment, the absence of glucose forces cells to halt glycolysis and use gluconeogenesis. The addition of glucose initiates a switch from gluconeogenesis to glycolysis, which requires flipping the sign of ΔG of every EMP glycolysis reaction step that participates in gluconeogenesis4,38. On the other hand, the ED pathway steps do not participate in gluconeogenesis due to highly negative ΔG°’ and thus can more readily increase its flux upon glucose addition. The ED pathway also generates NADPH like the OxPPP but without decarboxylation. Thus, in addition to facilitating rapid glycolytic response and ATP production, another role of the ED pathway is rapid carbon-efficient NADPH production (Extended Data Fig. 9a). By feeding [1-2H]- and [3-2H]-glucose to cells, we observed NADPH labeling through glucose-6-phosphate dehydrogenase (shared between the ED pathway and the OxPPP) that is three times as high as NADPH labeling through the OxPPP-exclusive step 6-phosphogluconate dehydrogenase (Extended Data Fig. 9b). This deuterated glucose tracing experiment revealed that the contributions of the ED pathway and the OxPPP to NADPH production are comparable.
The mechanism behind increasing glycolytic flux upon nitrogen upshift differs from that of carbon upshift. In nitrogen limitation, cells voluntarily limit their glucose import via competitive inhibition of the PTS EI by αKG. The PTS is the main glucose transporter that requires PEP as the initial substrate. In glucose limitation, PEP accumulates and acts as a reserve pool ready to increase the PTS flux as soon as glucose becomes available26. This is not the case for nitrogen limitation and upshift. Instead, the rapid increase of the ED pathway flux helps cells procure PEP on demand. The ED pathway converts glucose to pyruvate in five reaction steps, and pyruvate can be converted to PEP via phosphoenolpyruvate synthase (PpsA). Along with the PTS, PpsA is regulated by nitrogen availability with αKG acting as its inhibitor that blocks phosphotransfer39. Although PpsA reaction sacrifices ATP, which is not a concern for nitrogen-limited cells, the concerted regulation of PpsA and PTS facilitates streamlined glucose transport that supports a rapid increase of carbon supply, energy generation, and growth during nitrogen upshift. The ED pathway plays a crucial role in bridging the PTS and PpsA steps via a productive shortcut (Extended Data Fig. 9c).
In nature, rapid nutrient upshift is a common occurrence and nutrients are gradually depleted by organisms. Bacteria readily adapt to these nutrient fluctuations40 and have evolved to cope with short-term changes41. Our intermittent feeding experiments corroborated the adaptive advantage of the parallel ED glycolysis. Our analysis of Lenski et al.’s long-term evolution experiment demonstrated the evolutionary importance of the ED pathway. Had it not played an influential role in repeated glucose upshifts, its mutation history would be unlikely to see such high activities in early generations.
Conventional wisdom has it that parallel pathways afford flexibility. By employing different cofactors and substrate binding affinities attuned to different environments, parallel reaction steps contribute to metabolic homeostasis under various conditions and stresses42. Redundancy could mitigate the negative impacts of one of parallel pathways being misregulated43. Enzymes catalyzing the same reactions could also possess different regulatory mechanisms as in the case of self-resistance enzymes that protect cells from natural product inhibitors that they themselves produce44,45. Our finding of the dynamic role of the parallel ED glycolysis in promoting rapid adaptation augments our knowledge base for comprehending parallel metabolic pathways.
Glycolysis is often the highest flux-carrying metabolic pathway in heterotrophic organisms. The co-existence of the EMP and the ED glycolytic pathways acts as structural support for rapid glycolytic flux control. Such “hardwired” flux control mechanisms add to the arsenal of rapid adaptation strategies that include small-molecule-based regulation, thermodynamic shift, and post-translational modification46,47. Alternative glycolytic pathways are not unique to prokaryotes6,48, and parallel pathways are commonly found in metabolic networks. Thus, we postulate that parallel metabolic pathways’ raisons d’être underlie a metabolic design principle in dynamic environments.
Methods
Strains and culture conditions
E. coli K-12 strain NCM3722 was the wild type (WT) in this study. The ED pathway knockout strains Δedd and Δeda with the NCM3722 background were produced by P1 phage transduction49 of a deletion allele from the Keio collection50. E. coli were grown in Gutnick minimal (Gmin) media51 at 37 °C. Media contained either 0.2% (w/v) glucose, 0.274% (w/v) sodium acetate, 0.2% (w/v) mannose, 0.162% (v/v) glycerol, or 0.45% (w/v) sodium succinate dibasic hexahydrate as the carbon source such that the same molar availability of elemental carbon was achieved. For the nitrogen source, media contained 10 mM NH4Cl for the nitrogen-replete condition and either 2 mM NH4Cl or 2.5 mM of arginine for the nitrogen-limited conditions. Culture density (OD600) was monitored by spectrophotometer or plate reader.
For carbon upshift, cells were initially grown on acetate, mannose, succinate, or glycerol. When cultures reached the mid-log phase of growth (OD600 ≈ 0.3), carbon upshift was performed by spiking in a concentrated glucose or succinate stock solution into the culture to a final glucose concentration of 0.2% (w/v) or 0.45% (w/v) sodium succinate dibasic hexahydrate. For nitrogen upshift, cells were initially cultured in media containing 2 mM NH4Cl or 2.5 mM arginine until mid-log phase. At OD600 ≈ 0.3, cells consumed most of the nitrogen from NH4Cl, slowing down cell growth, and arginine cultures were in the mid-log phase. To induce upshift, NH4Cl was spiked into cultures to a final concentration of 10 mM. Metabolism was quenched and metabolites were extracted immediately prior to upshift (0 minutes) as well as 3, 5, 10, and 30 minutes after upshift. For isotope labeling experiments, unlabeled glucose was replaced with [1,2-13C2]-, [5,6-13C2]-, or [U-13C6]-glucose.
LTEE strains REL606 (Ancestral), REL2175A (Ara+3, 5000 generations), REL2177A (Ara+5, 5000 generations), REL2180A (Ara-2, 5000 generations), REL11345 (Ara+3, 50000 generations), REL11367 (Ara+5, 50000 generations), and REL11333 (Ara-2, 50000 generations) were used for this study. Cultures were grown in Davis Minimal (DM) broth as in the original LTEE, with the same carbon sources and upshifts described above. For no carbon to glucose upshift, cells were inoculated into 0.02% (w/v) glucose limited media and allowed to reach the stationary phase for >4 hours before upshifting by the addition of glucose. This time span was chosen to reflect the LTEE conditions, in which cells starve for hours before their next dilution with glucose upshift.
Flux balance analysis of single gene glycolysis knockouts
Flux balance analysis was performed using the COnstraint-Based Reconstruction and Analysis Toolbox (COBRA) on MATLAB with the E. coli genome-scale reconstruction iAF126052. The objective function was set to maximize biomass production while satisfying the mass balance constraints and carbon uptake rates specified by:
is the stoichiometric matrix and is the vector corresponding to reaction fluxes. and are the lower and upper bounds of based on biochemical and thermodynamic considerations. Individual genes of the EMP or ED glycolysis were silenced by constraining the respective reaction’s flux bounds to 0 mmol/h/gDCW. For simulations of growth on glucose, the glucose uptake rate was set to 8 mmol/h/gDCW to reflect typical substrate uptake rates52.
Nutrient upshift growth assays
To measure growth rates and accelerations during nutrient upshift, cells were grown in 96-well plates in a plate reader (BioTek) with shaking at 37 °C. Culture density (OD600) measured every two minutes. Growth acceleration was computed as the time derivative of the specific growth rate (μ), which is the time derivative of log culture density (ln(C)):
The maximum growth acceleration was quantified for acetate-to-glucose carbon upshift and ammonia depletion-to-repletion nitrogen upshift in the first six minutes and for arginine-to-ammonia nitrogen upshift and acetate-to-succinate, succinate-to-glucose, and glycerol-to-glucose carbon upshifts in the first ten minutes.
Intermittent nutrient upshift growth curves were performed by culturing cells in a 96-well plate in the plate reader. Cultures were first inoculated into plates with either glucose- or NH4Cl-depleted media before 0.02% (w/v) glucose or 0.5 mM NH4Cl was added at t = 0 minutes. Upshift was monitored until the limiting nutrient was depleted and cell growth ceased for no longer than 15 minutes. For nutrient upshift, the plate was taken out from the plate reader for spiking in 0.02% (w/v) glucose or 0.5 mM NH4Cl. These nutrient spike-in and growth monitoring steps were repeated a few times. All growth assays involving NCM3722 strains were performed in biological triplicates originating from three different colonies and, for each biological replicate, 12 technical replicates. Standard error of the mean using n=3 biological replicates, in which each biological replicate was represented by the median of the technical replicates, was used to infer the population mean from the sample mean. The growth assays for the LTEE strains were initially carried out the same as the ones for the NCM3722 strains. In subsequent growth assays, the number of biological replicates needed for a desired power of 0.8 (β=0.2) and significance level (α=0.05) was determined through a power analysis with the measured means and variances from the initial assays (Extended Data Fig. 9e). For the LTEE-strain growth assays with large numbers of biological replicates, no technical replicates were used. In all cases, each colony begot one biological replicate and one data point.
Metabolite extraction and measurement
Metabolite extraction was conducted as quickly as possible to minimize perturbations in metabolism. To quickly quench metabolism, remove extracellular metabolites, and extract intracellular metabolites, 1 mL of cultures was vacuum-filtered onto nylon membrane filters (0.45 μm; Millipore) and flipped cell-side down into 400 μL of 40:40:20 HPLC-grade acetonitrile/methanol/water that was pre-cooled to −20 °C in a 6-well plate. Extraction continued at −20 °C for 20 minutes before the filter was flipped cell-side up and washed with the extraction solvent in the well. The extract was collected in an Eppendorf tube and centrifuged at 4 °C. The supernatant was dried under nitrogen flow and reconstituted in HPLC-grade water for LC-MS analysis.
The metabolite extract samples were analyzed by high performance liquid chromatography (Vanquish Duo UHPLC, Thermo) coupled to a high-resolution orbitrap mass spectrometer (Q Exactive Plus, Thermo). The LC separation was achieved using a hydrophilic interaction chromatography column (XBridge BEH Amide XP Column, 130 Å, 2.5 μm, 2.1 mm X 150 mm, Waters). Mass spectrometry was performed in both positive and negative mode using a mass resolution of 140,000 at 200 m/z. The resulting LC-MS data was processed using the Metabolomic Analysis and Visualization Engine (MAVEN)53 with peaks identified by both the known retention times and mass-to-charge ratios (m/z)54.
For LC-MS/MS analysis of valine, the same LC method was used with a modified MS protocol with a full MS/data-dependent MS2 scan using a normalized collision energy (NCE) of 35. The positive parent ions of all valine isotopologues were inputted for MS2 fragmentation. The resulting LC-MS/MS data was analyzed on MAVEN by first identifying the parent m/z for each valine isotopologue and then extracting its fragment spectra53. The use of valine for determination of the EMP pathway, the ED pathway, and the PPP fluxes assumes the source of measured valine being mainly de novo synthesis. Extracellular valine, if it is in high concentrations, and valine from protein degradation, if protein degradation flux is high, may affect our intracellular flux ratio measurement. The combination of rapid culture filtration method and an orthogonal approach (e.g., 3PG labeling measurement) mitigates the risk of the misattribution of metabolic fluxes.
Quantitation of Gibbs free energy of reaction
Absolute metabolite concentrations in different conditions and time points were obtained by comparing peak areas to the known reference points in which the absolute concentrations of central carbon metabolites of E. coli had been measured55,56. The KDPG concentration was measured using an isotope-ratio-based approach57. Cellular metabolites were labeled by culturing E. coli on [U-13C6]glucose for multiple generations and extracted using the extraction solvent containing known concentrations of the unlabeled KDPG internal standard.
Using absolute metabolite concentrations (Supplementary Table 1), Gibbs free energy of reaction (ΔG) was computed using the following equation.
is at standard biochemical conditions, is the universal gas constant, is the temperature in kelvins, is the reaction quotient (i.e., the ratio of product-to-substrate activities, which are effective concentrations in a non-ideal solution). and changes in from one state to another (ΔΔG) were computed for the EMP pathway, the ED pathway, and gluconeogenesis (Supplementary Note 1).
Cell lysate assay
Measurement of the ED pathway activity in acetate cultures was conducted by monitoring KDPG production from cell lysates upon adding 6PG. Cells were grown on acetate until cultures reached ~0.4 OD600. Cells were pelleted, washed twice in cold phosphate-buffered saline (PBS), and resuspended in PBS. Cells were lysed by addition of 20 mg/mL lysozyme and sonication before subsequent centrifugation for 10 minutes. All lysis steps were conducted at 4 °C. The supernatant was moved to an Eppendorf tube and heated to 37 °C. 5 mM 6PG was added to the cell lysate and the reaction mixture incubated at 37°C with continuous shaking. Small aliquots of the reaction mixture were sampled over time. The reaction in those aliquots was quenched by the addition of cold 40:40:20 methanol:acetonitrile:water at a 1:4 ratio of the aliquot to the quenching solution. The mixture was centrifuged, and the supernatant was taken for the measurement of KDPG by LC-MS.
Glycolytic pathway flux quantitation via labeling in lower glycolysis metabolites
Glycolytic fluxes were obtained using the intracellular metabolite labeling from [1,2-13C2]-, [5,6-13C2]-, or [U-13C6]-glucose tracers (Supplementary Tables 2–10). [1,2-13C2]- and [5,6-13C2]-glucose tracers provided the necessary metabolite labeling (e.g., 3PG, 6PG, and Val) for determination of central carbon metabolism fluxes (Supplementary Notes 2 and 3). For the carbon upshift case, [U-13C6]-glucose tracer provided information necessary to correct for incomplete turnover of 3PG in early time points (Supplementary Note 4). Briefly, since the isotope labeling of 3PG from [1,2-13C2]glucose depends on which route glucose took (the EMP pathway, ED pathway, or pentose phosphate pathway), the following relationships between pathway fluxes and 3PG isotopologues were derived with the model shown in Supplementary Note 3.
is the normalization factor that ensures the sum of mass isotopomer fractions is 1. These equations were rearranged to solve for the ED-to-EMP flux ratios in Fig. 5:
Measurement of instantaneous glucose uptake rates
To measure glucose uptake rates (i.e., total glycolytic fluxes) in dynamic states, the instantaneous accumulation of a glucose-6-phosphate (G6P) analogue 2-deoxyglucose-6-phosphate (2DGP) was quantified using LC-MS upon feeding 2-deoxyglucose (2DG) for five seconds. At five seconds prior to each collection time point in nutrient upshift experiments, a 1-mL aliquot of the culture was rapidly mixed with 10 μL of 2DG solution in a pre-warmed 1.5-mL tube before subsequent metabolite extraction. The concentration of 2DG was chosen to achieve a final glucose-to-2DG ratio between one and five and an intracellular 2DGP concentration of 10mM or less. The absolute glucose uptake rates were obtained by comparing the 2DGP peak areas in samples to those of steady-state conditions with previously measured rates:
denotes the glucose uptake rate (mmol/gCDW/hr), denotes the 2DGP peak area normalized to the culture density, and denotes the fraction of 2DG over the sum of glucose and 2DG. and are the values from the 2DG spike-in experiments using the cells in reference steady-state conditions with known ).
Flow cytometry of WT-Δedd co-cultures
WT and Δedd strains were transformed with plasmids modified from pZE27GFP (Addgene Catalog# 75452)to carry an ampicillin selection marker and either GFP or mCherry, respectively. To generate co-cultures, the overnight cultures of WT and Δedd strains were resuspended in ratios of 1:1, 2:1, and 1:2 to a final OD600 of ~0.06 in 12-well plates in media containing low glucose (0.02%, w/v) or low ammonia (0.5 mM NH4Cl) and 50 μg/mL of ampicillin. Nutrient upshifts were performed as described above and at the end of each upshift cycle, 200 μl of the culture was collected and resuspended in cold Gmin buffer without any carbon or nitrogen to an OD of ~0.1. Samples were run (BD LSRII Flow Cytometer, BD Biosciences) with WT+GFP and Δedd+mCherry as well as WT–GFP and Δedd–mCherry controls used for compensation. Data were analyzed on FlowJo 10.8.2 with the gating strategy illustrated in Extended Data Fig. 7.
Analysis of long-term evolution experiment
The long-term evolution experiment (LTEE) encompassed six cultures from each of the ancestral strains REL606 and REL607 (12 cultures total) in a DM medium with 25 mg/L glucose (citrate was also included in this medium as a chelating agent, which the ancestral strain does not grow on). Cultures were diluted 1:100 into the fresh medium daily, and two clones from each culture were sampled periodically for sequencing. The mutation history of the 12 populations was downloaded from https://barricklab.org/shiny/LTEE-Ecoli/ and analyzed using MATLAB and Python programs. Nonsynonymous (missense and nonsense) mutations and indels were considered for all analyses, and synonymous mutations were also included where stated (e.g., Extended Data Figs. 8 and 9b).
The mutation history of the ED and the EMP pathways were compared to other pathways. Since the assignment of genes to metabolic pathways is not always one-to-one or clear-cut, pseudo pathways were formed from randomly generated groups of genes. Each pseudo pathway was generated by randomly selecting 10 genes from the E. coli genome. Mutations in the pathway genes were counted and normalized by the number of genes in the pathway at each generation. This process was repeated for 1,000 pathways as well as the EMP and the ED pathways, and the percentile ranks of the EMP and the ED pathways’ per-gene mutations were obtained. The EMP and the ED pathways included the following mutually exclusive sets of glycolytic genes: pgi, pfka, pfkb, fbaa, fbab, and tpia were included in the EMP pathway; and zwf, pgl, edd, and eda were included in the ED pathway. These gene sets were also used to track the number of strains with mutations in the EMP and the ED pathways.
To assess the randomness of the mutation history, mutation data from generation 50,000 were compared to the Poisson distribution. Without considering their identity, individual genes’ mutations were counted for all 24 clones. Since each of the populations begot two clones, which are thus not independent of each other, 212 sets of 12 independent clones were generated using only one of the two sequenced clones from each population. Each set generated a distribution of frequencies of mutations in a gene. The mean and the standard deviation of these distributions over the 212 sets were obtained. The resulting distribution was fit to a Poisson distribution using the MATLAB curve fitting toolbox (Extended Data Fig. 8a,b).
Extended Data
Extended Data Fig. 1.

a, WT and Δedd strains had been cultured on acetate as the sole carbon source and, at t=0 min, were spiked with glucose. Growth rates were monitored until a steady growth rate of ~0.7 hr−1 was achieved 80 minutes after upshift. b, WT and Δedd strains were cultured on arginine as the sole nitrogen source before ammonia was spiked in at t=0 min. Growth rates were monitored until a stable growth rate of ~0.75 hr−1 was achieved. c, The growth rates of WT and Δedd were measured in glucose minimal media with and without high acetate and compared to the stable growth rates of E. coli cultures following carbon upshift from acetate to glucose spiked in. Error bars represent the s.e.m. (n=3 biological replicates).
Extended Data Fig. 2.

a, WT and Δedd cultures had been grown on succinate or glycerol as the sole carbon source and, at t=0 min, were spiked with glucose. Growth rates and growth acceleration, which is the time derivative of growth rate, were quantified. b, Cells had been grown on a PTS sugar mannose as the sole carbon source and, at t=0 min, were spiked with glucose. Growth rates as well as growth acceleration over two time periods were quantified. c, Cells were subjected to carbon upshift from acetate to succinate, both gluconeogenic substrates at t=0 min. Growth rates and growth acceleration were quantified. Error bars represent the s.e.m. (n=3 biological replicates). P values are obtained by two-tailed t-tests.
Extended Data Fig. 3.

a, [1,2-13C2]glucose uniquely generates M+1 labeled triose phosphates through the oxidative pentose phosphate pathway (OxPPP). For every three glucose molecules going through the PPP, three molecules of M+0, one molecule of M+1, and one molecule of M+2 triose phosphate are generated. b, [5,6-13C2]glucose introduces unlabeled lower glycolytic intermediates only through the EMP pathway. Unlike in the case of [1,2-13C2]glucose, the EMP and the ED pathways produce the same positionally labeled pyruvate. The major fraction of M+2 3PG indicated the ED pathway activity in the nutrient replete condition. c, Using the carbon balance model of central carbon metabolism with [5,6-13C2]glucose, 3PG and pyruvate (PYR) labeling measurements are sufficient to solve for central carbon metabolism fluxes. This elegant solution is attributable to the fact that [5,6-13C2]glucose tracing is not convoluted by carbon shuffling in the PPP. Mass balance of carbons over the EMP pathway, the ED pathway, and the PPP (the inner control volume) as well as lower glycolysis (the outer control volumes) revealed the relationship between 3PG and PYR labeling and the central carbon metabolism fluxes.
Extended Data Fig. 4.

a, E. coli grown on an unlabeled medium were rapidly switched to the same medium containing [U-13C6]glucose. The labeled fractions of glycolytic intermediates were measured using LC-MS and normalized to the labeled fraction of glucose. Error bars represent the s.e.m. (n=3 biological replicates). b, The turnover of individual metabolites was calculated as the flux through that metabolite divided by the metabolite pool size using previously reported fluxes and concentrations56.
Extended Data Fig. 5.

a,b, Nutrient upshift experiments analogous to those conducted with [1,2-13C2]glucose were replicated using [5,6-13C2]glucose and the resulting labeling of (a) 6PG and (b) 3PG was measured via LC-MS. The labeling of M+0 and M+2 isotopomers revealed both the ED pathway flux and recursive PPP usage (Supplementary Note 2). c, Cell lysates from E. coli cultures grown on acetate were collected for an enzyme activity assay and incubated with 6PG, the direct precursor to KDPG (m/z = 257.0066) in the ED pathway. The increase in KDPG over time indicated the presence of the ED pathway enzymes in cells operating gluconeogenesis. Error bars represent the s.e.m. (n=2 biological replicates). d, E. coli in the carbon-limited acetate medium underwent carbon upshift by [U-13C6]glucose addition. The labeling of glycolytic intermediates following the upshift informed us of the fractions of 3PG pool coming from the labeled glucose and from the pre-upshift unlabeled acetate. This information was used to accurately compute glycolytic fluxes from [1,2-13C2]- and [5,6-13C2]-glucose tracing. Error bars represent the s.e.m. (n=3 biological replicates).
Extended Data Fig. 6.
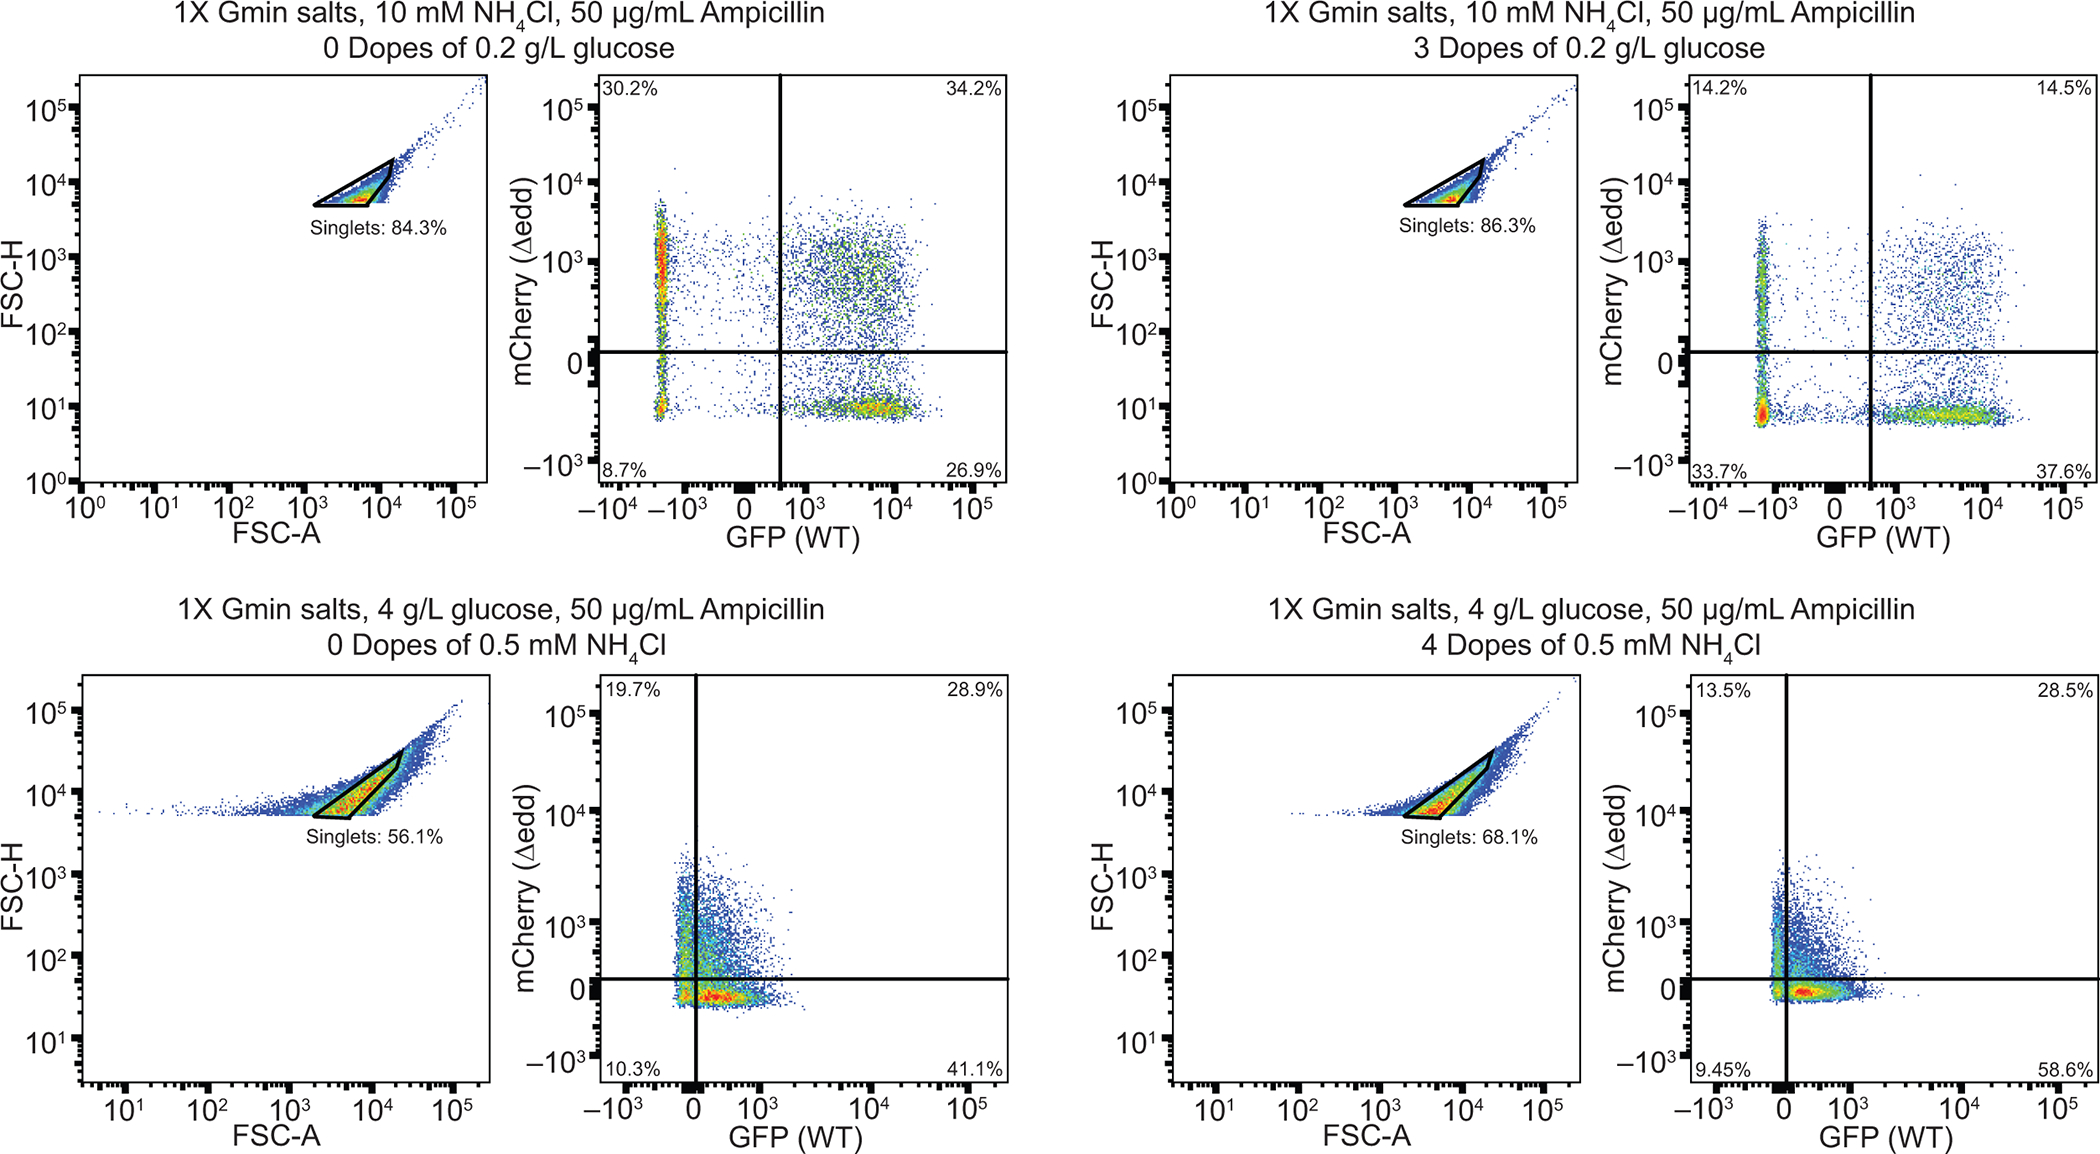
At least 10,000 events were recorded per sample. Singlets were gated based on FSC-A (forward scattered area) and FSC-H (forward scatted height) intensities in a way to minimize the frequency of aggregates observed. Non-fluorescent (WT), GFP expressing (WT+GFP) and mCherry expressing (Δedd+mCherry) cells were used as controls and analyzed on the day of experiments to determine the compensation of spectral overlap between fluorophores and gating quadrants for the glucose upshift (top) and ammonia upshift (bottom) experiments. Samples at the beginning (left) and end (right) of co-culture intermittent nutrient supply experiments are shown as examples.
Extended Data Fig. 7.

a,b, Mutation frequencies in genes deviated from the Poisson distribution. Genes with the same number of mutations were counted, and the normalized counts were fit to a Poisson distribution. Poor fitting for genes with 2 or more mutations suggested a driving force toward improved fitness. Error bars represent the standard deviation (n=212 all possible sets of twelve independent clones). c,d, The total number of mutations in individual genes across all 24 strains at the 50,000th generation. For each gene, we counted the number of mutations in all 24 strains. A few genes were consistently and heavily mutated: malT is a regulator for the maltose regulon that is also involved in λ phage infection; yeeJ is an autotransporter protein; metH is the gene for methionine synthase; pykF is pyruvate kinase, the last step of glycolysis; thrA is a bifunctional aspartokinase and homoserine dehydrogenase; nadR is a regulator for NAD biosynthesis; hsIU is a putative ATP dependent protease; and iclR is a regulator for isocitrate lyase of the glyoxylate cycle.
Extended Data Fig. 8.

a, Development of nonsynonymous mutations and indels in randomly sampled gene groups were compared to the mutation history of the parallel glycolytic pathways over 50,000 generations of the E. coli long-term evolution experiment (LTEE). b, The proportions of nonsynonymous mutations and indels were monitored over the LTEE. c, List of mutations in the ED and the EMP pathways. The 24 genome sequences from 12 populations were analyzed at generation 50,000 for mutations in the two glycolytic pathways. SNP denotes a single nucleotide polymorphism (only nonsynonymous mutations are shown) and FS denotes a frameshift indel. d, Seven strains from the LTEE with different numbers of overall and ED-pathway mutations were chosen for growth assays. e, The LTEE strains underwent carbon upshifts from no carbon source, acetate, mannose, or glycerol by spiking in glucose, and their growth acceleration was measured. Error bars represent the s.e.m. (n=3 biological replicates). P values are obtained by two-tailed t-tests between the designated and ancestral strain. f, After power analysis, the ancestral strain and Ara+3 A, Ara+5 A, and Ara-2 A strains isolated in the 5,000th generation were subjected to acetate-to-glucose upshift, and their growth acceleration was measured. Each box shows the three quartiles, and whiskers extend to the minimum and maximum values within 1.5-fold of the interquartile range (n=6 biological replicates). Statistical significance between strains was obtained by one-way ANOVA with Tukey’s HSD test for multiple comparison.
Extended Data Fig. 9.

a, The OxPPP produces two NADPH, but a carbon is lost as CO2 as 6PG enters the non-oxidative pentose phosphate pathway. On the other hand, the ED pathway produces NADPH without decarboxylation. b, Exponentially growing E. coli in unlabeled glucose minimal medium were rapidly switched to either [1-2H1] or [3-2H2]glucose. Labeling of the hydride of NADPH from [1-2H1]glucose indicated flux through G6PDH, whereas labeling from [3-2H1]glucose indicated flux through 6PGD. The ~3-fold labeling of NADPH from G6PDH compared to 6PGD indicated comparable contributions of the ED pathway and the OxPPP to NADPH generation. c, Concerted action of the phosphotransferase system (PTS), phosphoenolpyruvate synthase (PpsA), and ED pathway streamlines glucose import upon nitrogen upshift. While the EMP pathway takes 8 steps to generate PEP for glucose import, the concerted regulation and action of the ED pathway and PpsA supply PEP in 5 steps.
Supplementary Material
Acknowledgements
The authors would like to thank the members of the Park lab, the UCLA Metabolomics Center, and the UCLA Molecular Instrumentation Center for helpful discussion and J. E. Barrick, R. E. Lenski, and colleagues for the E. coli strains from the long-term evolution experiment. This work was supported by the National Institute of General Medical Sciences of the National Institutes of Health under Award Number R35GM143127 (J.O.P.), the National Institutes of Health Instrumentation Grant Number 1S10OD016387–01, the BioPACIFIC Materials Innovation Platform of the National Science Foundation under Award Number DMR-1933487 (R.C.L., G.N., and J.O.P.), the National Science Foundation Research Traineeship in Integrated Urban Solutions for Food, Energy, and Water Management (NSF-INFEWS) under Award Number DGE-1735325 (G.N.), the Hellman Fellowship (J.O.P.), and the Center for Clean Technology Fellowship (R.C.L.). The content is solely the responsibility of the authors and does not necessarily represent the official views of the National Institutes of Health or the National Science Foundation.
Footnotes
Competing Interests
The authors declare no competing financial or non-financial interests.
Code Availability
The code for the analysis of metabolic fluxes and LTEE is available on the GitHub public repository: https://github.com/richardlaw517/Parallel_Glycolysis
Data Availability
Source data for Figures 1–6 are provided in Supplementary Tables 1–17 and the GitHub public repository: https://github.com/richardlaw517/Parallel_Glycolysis
LTEE source data is available on: https://barricklab.org/shiny/LTEE-Ecoli/
References
- 1.Basan M et al. A universal trade-off between growth and lag in fluctuating environments. Nature 2020 584:7821 584, 470–474 (2020). [DOI] [PMC free article] [PubMed] [Google Scholar]
- 2.Romano AH & Conway T Evolution of carbohydrate metabolic pathways. Res Microbiol 147, 448–455 (1996). [DOI] [PubMed] [Google Scholar]
- 3.Bar-Even A, Flamholz A, Noor E & Milo R Rethinking glycolysis: on the biochemical logic of metabolic pathways. Nature Chemical Biology 2012 8:6 8, 509–517 (2012). [DOI] [PubMed] [Google Scholar]
- 4.Park JO et al. Near-equilibrium glycolysis supports metabolic homeostasis and energy yield. Nat Chem Biol 15, (2019). [DOI] [PMC free article] [PubMed] [Google Scholar]
- 5.Xiong W et al. Phosphoketolase pathway contributes to carbon metabolism in cyanobacteria. Nature Plants 2015 2:1 2, 1–8 (2015). [DOI] [PubMed] [Google Scholar]
- 6.Chen X et al. The Entner-Doudoroff pathway is an overlooked glycolytic route in cyanobacteria and plants. Proc Natl Acad Sci U S A 113, 5441–5446 (2016). [DOI] [PMC free article] [PubMed] [Google Scholar]
- 7.Flamholz A, Noor E, Bar-Even A, Liebermeister W & Milo R Glycolytic strategy as a tradeoff between energy yield and protein cost. Proceedings of the National Academy of Sciences 110, 10039–10044 (2013). [DOI] [PMC free article] [PubMed] [Google Scholar]
- 8.Basan M et al. Overflow metabolism in Escherichia coli results from efficient proteome allocation. Nature 2015 528:7580 528, 99–104 (2015). [DOI] [PMC free article] [PubMed] [Google Scholar]
- 9.Noor E et al. The Protein Cost of Metabolic Fluxes: Prediction from Enzymatic Rate Laws and Cost Minimization. PLoS Comput Biol 12, e1005167 (2016). [DOI] [PMC free article] [PubMed] [Google Scholar]
- 10.Peekhaus N & Conway T What’s for dinner?: Entner-Doudoroff metabolism in Escherichia coli. J Bacteriol 180, 3495–3502 (1998). [DOI] [PMC free article] [PubMed] [Google Scholar]
- 11.Mahadevan R & Lovley DR The Degree of Redundancy in Metabolic Genes Is Linked to Mode of Metabolism. Biophys J 94, 1216–1220 (2008). [DOI] [PMC free article] [PubMed] [Google Scholar]
- 12.Güell O, Sagués F & Serrano MÁ Essential Plasticity and Redundancy of Metabolism Unveiled by Synthetic Lethality Analysis. PLoS Comput Biol 10, e1003637 (2014). [DOI] [PMC free article] [PubMed] [Google Scholar]
- 13.Nowak MA, Boerlijst MC, Cooke J & Smith JM Evolution of genetic redundancy. Nature 1997 388:6638 388, 167–171 (1997). [DOI] [PubMed] [Google Scholar]
- 14.Murray EL & Conway T Multiple regulators control expression of the Entner-Doudoroff aldolase (Eda) of Escherichia coli. J Bacteriol 187, 991–1000 (2005). [DOI] [PMC free article] [PubMed] [Google Scholar]
- 15.Parisutham V & Lee SK Novel Functions and Regulation of Cryptic Cellobiose Operons in Escherichia coli. PLoS One 10, e0131928 (2015). [DOI] [PMC free article] [PubMed] [Google Scholar]
- 16.Grüning NM & Ralser M Glycolysis: How a 300yr long research journey that started with the desire to improve alcoholic beverages kept revolutionizing biochemistry. Curr Opin Syst Biol 28, 100380 (2021). [Google Scholar]
- 17.Feist AM et al. A genome-scale metabolic reconstruction for Escherichia coli K-12 MG1655 that accounts for 1260 ORFs and thermodynamic information. Mol Syst Biol 3, (2007). [DOI] [PMC free article] [PubMed] [Google Scholar]
- 18.Fuhrman LK, Wanken A, Nickerson KW & Conway T Rapid accumulation of intracellular 2-keto-3-deoxy-6-phosphogluconate in an Entner-Doudoroff aldolase mutant results in bacteriostasis. doi: 10.1111/j.1574-6968.1998.tb12870.x. [DOI] [PubMed] [Google Scholar]
- 19.Chantranupong L, Wolfson RL & Sabatini DM Nutrient-Sensing Mechanisms across Evolution. Cell 161, 67–83 (2015). [DOI] [PMC free article] [PubMed] [Google Scholar]
- 20.Korem Kohanim Y et al. A Bacterial Growth Law out of Steady State. Cell Rep 23, 2891–2900 (2018). [DOI] [PubMed] [Google Scholar]
- 21.Towbin BD et al. Optimality and sub-optimality in a bacterial growth law. Nature Communications 2017 8:1 8, 1–8 (2017). [DOI] [PMC free article] [PubMed] [Google Scholar]
- 22.Fischer E & Sauer U A Novel Metabolic Cycle Catalyzes Glucose Oxidation and Anaplerosis in Hungry Escherichia coli*. Journal of Biological Chemistry 278, 46446–46451 (2003). [DOI] [PubMed] [Google Scholar]
- 23.Bren A et al. Glucose becomes one of the worst carbon sources for E.coli on poor nitrogen sources due to suboptimal levels of cAMP. Scientific Reports 2016 6:1 6, 1–10 (2016). [DOI] [PMC free article] [PubMed] [Google Scholar]
- 24.Taylor BR et al. A metabolic sum rule dictates bacterial response to short-chain fatty acid stress. bioRxiv 2022.08.31.506075 (2022) doi: 10.1101/2022.08.31.506075. [DOI] [Google Scholar]
- 25.Hermsen R, Okano H, You C, Werner N & Hwa T A growth-rate composition formula for the growth of E. coli on co-utilized carbon substrates. Mol Syst Biol 11, 801 (2015). [DOI] [PMC free article] [PubMed] [Google Scholar]
- 26.Xu YF, Amador-Noguez D, Reaves ML, Feng XJ & Rabinowitz JD Ultrasensitive regulation of anapleurosis via allosteric activation of PEP carboxylase. Nature Chemical Biology 2012 8:6 8, 562–568 (2012). [DOI] [PMC free article] [PubMed] [Google Scholar]
- 27.Doucette CD, Schwab DJ, Wingreen NS & Rabinowitz JD α-ketoglutarate coordinates carbon and nitrogen utilization via enzyme I inhibition. Nature Chemical Biology 2011 7:12 7, 894–901 (2011). [DOI] [PMC free article] [PubMed] [Google Scholar]
- 28.Kleijn RJ, Van Winden WA, Van Gulik WM & Heijnen JJ Revisiting the 13C-label distribution of the non-oxidative branch of the pentose phosphate pathway based upon kinetic and genetic evidence. FEBS J 272, 4970–4982 (2005). [DOI] [PubMed] [Google Scholar]
- 29.Stincone A et al. The return of metabolism: biochemistry and physiology of the pentose phosphate pathway. Biological Reviews 90, 927–963 (2015). [DOI] [PMC free article] [PubMed] [Google Scholar]
- 30.Pereira FC & Berry D Microbial nutrient niches in the gut. Environ Microbiol 19, 1366–1378 (2017). [DOI] [PMC free article] [PubMed] [Google Scholar]
- 31.Lenski RE, Rose MR, Simpson SC & Tadler SC Long-Term Experimental Evolution in Escherichia coli. I. Adaptation and Divergence During 2,000 Generations. 10.1086/285289 138, 1315–1341 (2015). [DOI] [Google Scholar]
- 32.Wünsche A et al. Diminishing-returns epistasis decreases adaptability along an evolutionary trajectory. Nature Ecology & Evolution 2017 1:4 1, 1–6 (2017). [DOI] [PubMed] [Google Scholar]
- 33.Lenski RE Experimental evolution and the dynamics of adaptation and genome evolution in microbial populations. The ISME Journal 2017 11:10 11, 2181–2194 (2017). [DOI] [PMC free article] [PubMed] [Google Scholar]
- 34.Emmerling M et al. Metabolic flux responses to pyruvate kinase knockout in Escherichia coli. J Bacteriol 184, 152–164 (2002). [DOI] [PMC free article] [PubMed] [Google Scholar]
- 35.Burgos-Barragan G et al. Mammals divert endogenous genotoxic formaldehyde into one-carbon metabolism. Nature 2017 548:7669 548, 549–554 (2017). [DOI] [PMC free article] [PubMed] [Google Scholar]
- 36.Tibbetts AS & Appling DR Compartmentalization of Mammalian Folate-Mediated One-Carbon Metabolism. 10.1146/annurev.nutr.012809.104810 30, 57–81 (2010). [DOI] [PubMed] [Google Scholar]
- 37.Corbet C & Feron O Cancer cell metabolism and mitochondria: Nutrient plasticity for TCA cycle fueling. Biochimica et Biophysica Acta (BBA) - Reviews on Cancer 1868, 7–15 (2017). [DOI] [PubMed] [Google Scholar]
- 38.Kiparissides A & Hatzimanikatis V Thermodynamics-based Metabolite Sensitivity Analysis in metabolic networks. Metab Eng 39, 117–127 (2017). [DOI] [PubMed] [Google Scholar]
- 39.Kee JM, Oslund RC, Perlman DH & Muir TW A pan-specific antibody for direct detection of protein histidine phosphorylation. Nature Chemical Biology 2013 9:7 9, 416–421 (2013). [DOI] [PMC free article] [PubMed] [Google Scholar]
- 40.Nguyen J et al. A distinct growth physiology enhances bacterial growth under rapid nutrient fluctuations. Nature Communications 2021 12:1 12, 1–12 (2021). [DOI] [PMC free article] [PubMed] [Google Scholar]
- 41.Sekar K et al. Bacterial glycogen provides short-term benefits in changing environments. Appl Environ Microbiol 86, (2020). [DOI] [PMC free article] [PubMed] [Google Scholar]
- 42.Jenior ML, Moutinho TJ, Dougherty BV & Papin JA Transcriptome-guided parsimonious flux analysis improves predictions with metabolic networks in complex environments. PLoS Comput Biol 16, e1007099 (2020). [DOI] [PMC free article] [PubMed] [Google Scholar]
- 43.Wang CY et al. Metabolome and proteome analyses reveal transcriptional misregulation in glycolysis of engineered E. coli. Nature Communications 2021 12:1 12, 1–12 (2021). [DOI] [PMC free article] [PubMed] [Google Scholar]
- 44.Yan Y, Liu N & Tang Y Recent developments in self-resistance gene directed natural product discovery. Nat Prod Rep 37, 879–892 (2020). [DOI] [PMC free article] [PubMed] [Google Scholar]
- 45.Almabruk KH, Dinh LK & Philmus B Self-Resistance of Natural Product Producers: Past, Present, and Future Focusing on Self-Resistant Protein Variants. ACS Chem Biol 13, 1426–1437 (2018). [DOI] [PubMed] [Google Scholar]
- 46.Hofmeyr JHS & Cornish-Bowden A Quantitative assessment of regulation in metabolic systems. Eur J Biochem 200, 223–236 (1991). [DOI] [PubMed] [Google Scholar]
- 47.Kochanowski K et al. Global coordination of metabolic pathways in Escherichia coli by active and passive regulation. Mol Syst Biol 17, e10064 (2021). [DOI] [PMC free article] [PubMed] [Google Scholar]
- 48.Vander Heiden MG et al. Evidence for an alternative glycolytic pathway in rapidly proliferating cells. Science (1979) 329, 1492–1499 (2010). [DOI] [PMC free article] [PubMed] [Google Scholar]
- 49.Saragliadis A, Trunk T & Leo JC Producing Gene Deletions in Escherichia coli by P1 Transduction with Excisable Antibiotic Resistance Cassettes. J Vis Exp 2018, 58267 (2018). [DOI] [PMC free article] [PubMed] [Google Scholar]
- 50.Baba T et al. Construction of Escherichia coli K-12 in-frame, single-gene knockout mutants: the Keio collection. Mol Syst Biol 2, 2006.0008 (2006). [DOI] [PMC free article] [PubMed] [Google Scholar]
- 51.Gutnick D, Calvo JM, Klopotowski T & Ames BN Compounds which serve as the sole source of carbon or nitrogen for Salmonella typhimurium LT-2. J Bacteriol 100, 215–219 (1969). [DOI] [PMC free article] [PubMed] [Google Scholar]
- 52.Orth JD et al. A comprehensive genome-scale reconstruction of Escherichia coli metabolism—2011. Mol Syst Biol 7, 535 (2011). [DOI] [PMC free article] [PubMed] [Google Scholar]
- 53.Seitzer P, Bennett B & Melamud E MAVEN2: An Updated Open-Source Mass Spectrometry Exploration Platform. Metabolites 2022, Vol. 12, Page 684 12, 684 (2022). [DOI] [PMC free article] [PubMed] [Google Scholar]
- 54.Wang L et al. Peak Annotation and Verification Engine for Untargeted LC-MS Metabolomics. Anal Chem 91, 1838–1846 (2019). [DOI] [PMC free article] [PubMed] [Google Scholar]
- 55.Yuan J et al. Metabolomics-driven quantitative analysis of ammonia assimilation in E. coli. Mol Syst Biol 5, 302 (2009). [DOI] [PMC free article] [PubMed] [Google Scholar]
- 56.Park JO et al. Metabolite concentrations, fluxes and free energies imply efficient enzyme usage. Nature Chemical Biology 2016 12:7 12, 482–489 (2016). [DOI] [PMC free article] [PubMed] [Google Scholar]
- 57.Bennett BD, Yuan J, Kimball EH & Rabinowitz JD Absolute quantitation of intracellular metabolite concentrations by an isotope ratio-based approach. Nature Protocols 2008 3:8 3, 1299–1311 (2008). [DOI] [PMC free article] [PubMed] [Google Scholar]
Associated Data
This section collects any data citations, data availability statements, or supplementary materials included in this article.
Supplementary Materials
Data Availability Statement
Source data for Figures 1–6 are provided in Supplementary Tables 1–17 and the GitHub public repository: https://github.com/richardlaw517/Parallel_Glycolysis
LTEE source data is available on: https://barricklab.org/shiny/LTEE-Ecoli/