

Abstract
Calcium homeostasis is critical for cell proliferation, and emerging evidence shows that cancer cells exhibit altered calcium signals to fulfill their need for proliferation. However, it remains unclear whether there are oncogene-specific calcium homeostasis regulations that can expose novel therapeutic targets. Here, from RNAi screen, we report that adenosylhomocysteinase like protein 1 (AHCYL1), a suppressor of the endoplasmic reticulum (ER) calcium channel protein inositol trisphosphate receptor (IP3R), is selectively upregulated and critical for cell proliferation and tumor growth potential of human NRAS-mutated melanoma, but not for melanoma expressing BRAF V600E. Mechanistically, AHCYL1 deficiency results in decreased ER calcium levels, activates the unfolded protein response (UPR), and triggers downstream apoptosis. In addition, we show that AHCYL1 transcription is regulated by activating transcription factor 2 (ATF2) in NRAS-mutated melanoma. Our work provides evidence for oncogene-specific calcium regulations and suggests AHCYL1 as a novel therapeutic target for RAS mutant-expressing human cancers, including melanoma.
Keywords: calcium homeostasis, unfolded protein response, melanoma, oncogene-dependent metabolic regulation, AHCYL1
Introduction
For a long time, calcium signaling in malignancy has not gained much attention as it was once viewed as uniform across all non-excitable cells, including both the normal and the cancer cells. However, over the past decade, accumulating evidence has shown that cancer cells apply altered requirement for calcium homeostasis to fulfill their need for proliferation and survival (1). Since then, calcium signaling has become attractive targets for developing novel cancer therapies, especially ones targeting the ER. The ER is the major intracellular site for calcium storage and release that modulates cellular calcium homeostasis, and it coordinates with mitochondria and lysosomes. The ER is mostly composed of calcium-dependent molecular chaperones that are responsible for protein folding. Thus, disrupting ER calcium homeostasis causes the accumulation of unfolded or misfolded proteins and subsequently leads to ER stress that attenuates cell proliferation or triggers apoptosis (2–9).
To fulfill their need for proliferation and survival, cancer cells apply differentially expressed calcium pumps, channels, or exchangers, such as the upregulation of IP3R3 (1,8,10–12). The differential expression of cancer calcium regulating proteins have been reported to be driven by oncogenes and tumor suppressors (1,13). Yet, detailed characterization of how calcium signals are remodeled to achieve homeostasis in cancer cells is still needed, and whether different cancer oncogenic background maintains oncogene-specific calcium homeostasis status remains elusive. Particularly, the effect of oncogene NRAS on cellular calcium homeostasis has not been studied.
Human cutaneous melanoma is the most dangerous type of skin cancer, with nearly fifty percent of patients exhibiting BRAF mutations and twenty percent expressing mutated NRAS. Notably, these mutations are mutually exclusive in melanoma patients. Therefore, we use human melanoma as a model to investigate oncogene-dependent calcium homeostasis regulations and focus on identifying mutant NRAS specific requirements. This is because NRAS-mutated melanoma is typically more aggressive than BRAF-mutated and wild-type melanomas (14–17), and while clinical treatments for BRAF-mutated melanoma involve the combination of BRAF and MEK inhibitors (18,19), there is currently no specific treatment available for NRAS-mutated melanoma. Previously in our research group, we conducted a comprehensive RNAi-based screen targeting a subset of genes related to cell metabolism (20) in human melanoma cells expressing mutant NRAS or BRAF. Reanalysis of the screen results reveals that the ER protein AHCYL1, that governs ER calcium homeostasis, is selectively critical for human melanoma expressing NRAS mutation.
AHCYL1 has been reported to bind to and suppress the IP3R (21). Although AHCYL1 shares a similar protein structure with adenosylhomocysteinase (AHCY), it does not have enzymatic activity due to two site mutations and a coiled-coil region that is not present in AHCY (22). IP3R is activated by the binding of IP3. With an additional IRBIT domain, AHCYL1 inhibits IP3 binding and prevents calcium efflux from the ER induced by IP3, thereby suppresses IP3R activity (23,24). Previous study has correlated AHCYL1 expression with colorectal cancer patient survival (25). However, the exact mechanism by which AHCYL1 affects cancer cell proliferation and survival as well as the role of AHCYL1 in human melanoma remain unclear.
Here, we report that, AHCYL1 is selectively critical for human melanoma expressing NRAS mutation, but not for those expressing BRAF mutation. Specifically, we identify AHCYL1 as an oncogene-dependent key regulator of ER calcium homeostasis, with its deficiency leading to decreased ER calcium levels, activating the UPR and ultimately causing cell apoptosis. Our findings suggest that targeting the AHCYL1-IP3R axis presents a novel therapeutic approach for NRAS-mutated melanomas, with potential applicability to all cancers harboring RAS mutations, such as KRAS-mutated human colorectal cancers.
Materials and Methods
Cell culture
Human HEK293T (RRID: CVCL_0063), HMCB (RRID: CVCL_3317), A375 (RRID: CVCL_0132), VMM39 (RRID: CVCL_A739), SK-MEL-5 (RRID: CVCL_0527), A2058 (RRID: CVCL_1059), VM1985 (RRID: N/A), VM164 (RRID: N/A), SK-MEL-2 (RRID: CVCL_0069), HT29 (RRID: CVCL_0320), HCT116 (RRID: CVCL_0291), Hs 936.T (C1) (RRID: CVCL_1033) were obtained from the American Type Culture Collection (ATCC), Human SK-MEL-147 was from Sigma SCC440 (RRID: CVCL_3876). Human Mel-ST cells were obtained from 2015 MC paper (Kang et, al.) (RRID: N/A). VMM39 was cultured in RPMI 1640 (Gibco, 11875–093) with 10% Fetal Bovine Serum (FBS) (Sigma, F2442) supplemented with 1% penicillin/streptomycin (P/S) (Gibco, 15070–063). HCT116 and HT29 were cultured in McCoy’s 5a medium (Cytiva, SH30200.01) with 10% FBS and 1% P/S. All the rest of the cells were cultured in Dulbecco Modified Eagle Medium (DMEM) (Gibco, 11965–092) with 10% FBS and 1% P/S. All the cells were cultured at 37 °C and 5% CO2. After thawing, cells were used for up to 10 passages and their authenticities were checked by short tandem repeat analysis. Mycoplasma testing was not done. Cell experiments were conducted and designed according to protocols approved by Institutional Biosafety Committee (IBC) of the University of Chicago.
Animal study
Mouse study was approved by the Institutional Animal Care and Use Committee (IACUC) at the University of Chicago. Nude mice (athymic nu/nu, 4–6 weeks old, female, Harlan Laboratories, RRID: IMSR_JAX:002019) were subcutaneously injected with 1×10⁶ melanoma cells in 30% Matrigel (Corning, 354234) in PBS on the flanks. Tumor growth was measured starting from 8 days after inoculation by measurement of two perpendicular diameters with calipers. Tumor volume was calculated using formula 4π/3 × (width/2)2 × (length/2), and tumors were harvested from euthanized mice and weighed at experimental endpoints. Freshly excised mouse tumor tissues were minced into small pieces by scissors in HBSS, digested by Collagenase IV (1 mg/mL) and DNase I (200 U/mL) (EMD Millipore, 260913–10MU) in 5 ml HBSS (Gibco, 14025–092) at 37°C for 30 minutes with gentle rocking. The digestion reaction was quenched by 100 μl of 0.5M EDTA pH 8.0. The digested tumor tissues were then filtered into new tube through 70 μm nylon mesh strainer and centrifuged at 300×g for 10 minutes at room temperature, supernatant was discarded. Then, 10 ml Ammonium Chloride Solution (STEMCELL, 07850) was added, and tumor tissues were incubated at room temperature for 5 minutes to remove red blood cells. Reaction was quenched by FBS-containing media and washed 3 times. Next, isolated tumor cells were processed for protein collection, immunoblotting, and Ki-67 (BioLegend, 151208) flow cytometry.
TCGA analysis
mRNA expression data from human skin cutaneous melanoma patient samples (TCGA, PanCancer Atlas) and human colorectal adenocarcinoma patient samples (TCGA, PanCancer Altas) were obtained from TCGA cBioPortal (https://www.cbioportal.org/), mRNA expression z-scores relative to all samples (log RNA Seq V2 RSEM) was compared. Wild type melanoma refers to melanoma samples expressing both wildtype NRAS and wildtype BRAF.
Transient expression in human immortalized Mel-ST melanocytes
Mel-ST cells were seeded the day before transfection to around 70% confluence. 2.5 μg of WT NRAS, NRAS Q61K, BRAF V600E expression vectors, or an empty expression vector were transiently introduced into Mel-ST cells by Lipofectamine 3000 reagent (Life Technologies, L3000015) following manufacturer’s instructions. 3–5 days after transfection, transfected cells were collected for RNA or protein analysis.
RNA extraction and RT-PCR
Total RNA was purified from cultured cells using TRIzol reagent (Ambion, 15596026) following manufacturer’s instructions. 1 μg of cDNA was synthesized from total isolated RNA using iScript cDNA Synthesis Kit (Bio-Rad, 1708891) per manufacturer’s instructions. qPCR was performed using iTaq Universal SYBR Green Supermix (Bio-Rad, 1725121) with following primers.
DDIT3 primers: R-CTTGTGACCTCTGCTGGTTCTG; F-GGTATGAGGACCTGCAAGAGGT.
AHCYL1 primers: F-GAAGCAGGCCAAGGAGATCG; R-GAGGACTGTGAGATCGAGCG.
GAPDH primers: F-GTCTCCTCTGACTTCAACAGCG; R-ACCACCCTGTTGCTGTAGCCAA.
ATF2 primers: F-GGTAGCGGATTGGTTAGGACTC; R-TGCTCTTCTCCGACGACCACTT.
ITPR3 primers: F-CTGTGAACTGCAACACCAGC; R-ACTCGTCACACGTCAGGAAC.
AHCYL2 primers: F-AGTCAAGAAGCAGATCCAGTTT; R- TATATGAAGCCGCTGAGCTGTA.
MAPK14 primers: F-CCAGCTTCAGCAGATTATGCG; R-CGCAAAGTTCATCTTCGGCA.
ATF4 primers: F-TTCTCCAGCGACAAGGCTAAGG; R-CTCCAACATCCAATCTGTCCCG.
ATF6 primers: F-CAGACAGTACCAACGCTTATGCC; R-GCAGAACTCCAGGTGCTTGAAG.
XBP1 primers: F-CTGCCAGAGATCGAAAGAAGGC; R-CTCCTGGTTCTCAACTACAAGGC.
PHGDH primers: F-CTGCGGAAAGTGCTCATCAGT; R-TGGCAGAGCGAACAATAAGGC.
SCD primers: F-TCTAGCTCCTATACCACCACCA; R-TCGTCTCCAACTTATCTCCTCC.
HMGCS1 primers: F-GATGTGGGAATTGTTGCCCTT; R-ATTGTCTCTGTTCCAACTTCCAG.
RIT1 primers: F-TTCATCAGCCACCGATTCCC R-GCAGGCTCATCATCAATACGGA.
BTG2 primers: F-GCAGAGGCTTAAGGTCTTCAGC; R-TGGTTGATGCGAATGCAGCGGT.
RRM2 primers: F-CACGGAGCCGAAAACTAAAGC; R-TCTGCCTTCTTATACATCTGCCA.
PFKL primers: F-AAGAAGTAGGCTGGCACGACGT; R-GCGGATGTTCTCCACAATGGAC.
TRIB3 primers: F-GCTTTGTCTTCGCTGACCGTGA; R-CTGAGTATCTCAGGTCCCACGT.
P4HA1 primers: F-GCCAAAGCTCTGTTACGTCTCC; R-CAAAGCAGTCCTCAGCCGTTAG.
GNL3 primers: F-GCCAGGTGAAGGTTCCAAGG; R-CAGCCTCTCGATTGGCATGAT.
HSP90AB1 primers: F-AGAAATTGCCCAACTCATGTCC; R-ATCAACTCCCGAAGGAAAATCTC
CCT7 primers: F-GCTGGTGTTGCATTCAAGAAG; R-TTGCCTGATAATCCTCAACTGTG.
DUT primers: F- GAAGCCGCGGTACTCTCC; R-TGAAATGGCGGGTGTCTCC.
TYMS primers: F- GGTGTTTTGGAGGAGTTGCTGTG; R-GGAGAATCCCAGGCTGTCCAAA.
PCNA primers: F- CAAGTAATGTCGATAAAGAGGAGG; R-GTGTCACCGTTGAAGAGAGTGG.
CDC45 primers: F- GGAGAACACACTCTCCGTGG; R- GGGAAGACCCATGTCTGCAA.
NOLC1 primers: F- GTAGCAGTGATGACTCAGAGGAG; R-CTGGAGGAATCCTCACTGCTAG.
NME1 primers: F-AAGGAGATCGGCTTGTGGTTT; R- CTGAGCACAGCTCGTGTAATC.
RRP9 primers: F- TGAGGCCCGTGCATTTGAG; R-CCCCGTAAAACGCGAATGTC.
WDR43 primers: F-CCTACTTCGCTTTGGCCTCTA; R-GAAGGCACGTACTCCTGGTG.
NPM1 primers: F- ACGGTCAGTTTAGGGGCTG; R-CTGTGGAACCTTGCTACCACC.
GRWD1 primers: F-AGTCCGGCGACACAAGTTC; R-CTCGGTGGTAGAGCACATAGG.
IPO4 primers: F-GCTCCAGATCGTTCTTCGGG; R-CCGTCAGGATCAGGGACTTG.
AIMP2 primers: F-GCCACGTGCAGGAAGAGT; R-CCAGCGCATTGGTGGTTAAA.
TCOF1 primers: F-AAGTCAGCCCACACGCTG; R-GCTTGCCATCTGGGTCATCT.
RABEPK primers: F-AGCTTCATTCCCTCCTGCAC; R-CAATGGCTGCCGATGATGTG.
Immunoblotting and antibodies
For all western blot experiments, protein lysates were prepared using RIPA cell lysis buffer (Millipore Sigma, 20–188) supplemented with protease inhibitors (Millipore Sigma, 59813300) and incubated on ice for 30 minutes. Protein lysate was quantified using Pierce Rapid Gold BCA Protein Assay Kit (Thermo Fisher Scientific, A53225) and denatured with Laemmli SDS sample buffer (Thermo Fisher Scientific, J61337). 20–30 μg of protein was loaded into wells of homemade SDS-PAGE gel along with molecular weight marker(s) (Thermo Fisher Scientific, 26616). Gel was run at 110V for 1–2 h. Resolved proteins were then transferred onto a nitrocellulose membrane by wet transfer. After transfer, membrane was blocked in TBST with 5% skimmed milk for 1h and probed with relevant primary and secondary antibodies in TBST with 5% skimmed milk. Quantification of western blot bands was carried out by subtracting background from the band intensity using software ImageJ. The following primary antibodies were used: Rabbit monoclonal anti-GAPDH antibody (1:15000 dilution, Cell Signaling Technology, 2118S, RRID: AB_561053), Mouse monoclonal anti-β-actin antibody (1:5000 dilution, Sigma-Aldrich, A1978, RRID: AB_476692), AHCYL1/SAHH-3 (D-7) antibody (1:1000 dilution, SANTA CRUZ BIOTECHNOLOGY, sc-271581, RRID: AB_10649944), ATF-2 Antibody (F2BR-1) (1:250 dilution, SANTA CRUZ BIOTECHNOLOGY, sc-242, RRID: AB_626708), Rabbit monoclonal anti-BRAF antibody (1:2000 dilution, Cell Signaling Technology, 14814S, RRID: AB_2750887), NRAS Polyclonal antibody (1:2000 dilution, Proteintech, 10724–1-AP, RRID: AB_2154209), ATF-4 (D4B8) Rabbit mAb (1:500 dilution, Cell Signaling Technology, 11815, RRID: AB_2616025), ATF-6 (D4Z8V) Rabbit mAb (1:500 dilution, Cell Signaling Technology, 65880, RRID: AB_2799696), CREB (48H2) Rabbit mAb (1:500 dilution, Cell Signaling Technology, 9197S, RRID: AB_331277), Phospho-CREB (Ser133) (87G3) Rabbit mAb (1:500 dilution, Cell Signaling Technology, 9198S, RRID: AB_2561044), Calnexin (C5C9) Rabbit mAb (Cell Signaling Technology, 2679S, RRID: AB_2228381), IP3 Receptor 1 (D53A5) Rabbit mAb (Cell Signaling Technology, 8568S, RRID: AB_10890699), CHOP (L63F7) Mouse mAb (1:500 dilution, Cell signaling Technology, 2895, RRID: AB_2089254). The following secondary antibody was used: Goat anti-Mouse IgG (H+L) Secondary Antibody, HRP (1:5000 dilution, Thermo Fisher Scientific, 31430, RRID: AB_228307), Goat anti-Rabbit IgG (H+L) Secondary Antibody, HRP (1:5000 dilution, Thermo Fisher Scientific, 31460, RRID: AB_228341). HRP was detected by chemiluminescence by Clarity Western ECL Substrate (BIO-RAD, 1705061) by film developer.
RNA interference
For RNA interference experiments, cells were seeded the day before to around 70% confluence and were transfected with 30 pmol targeting siRNAs or control siRNAs using Lipofectamine RNAiMAX Transfection Reagent (Life Technologies, 13778030) following manufacturer’s instructions. For siAHCYL1 cell proliferation assay, 24h after transfection, 50,000 cells were re-seeded in 6-well plate. Cell number was recorded daily on automated cell counter (Bio-Rad, TC20) after mixing cell suspension with trypan blue (Sigma-Aldrich, T8154–100ML). Proteins and RNAs were collected for further analysis on day 4 or day 5. For siATF4 and siATF6 assay, 15 pmol of each siRNA was combined for transfection; for siXBP1 assay, 15 pmol of siXBP1 was transfected. 24h after transfection, transduction for AHCYL1 knockout was performed (detailed transduction procedure can be found in the transduction method section). After puromycin selection, 50,000 cells were re-seeded, and endpoint cell number was recorded.
Hs_AHCYL1_2 FlexiTube siRNA (called “siAHCYL1 #1” in the manuscript) (Qiagen, SI00090335).
Hs_AHCYL1_3 FlexiTube siRNA (called “siAHCYL1 #2” in the manuscript) (Qiagen, SI00090342).
Hs_ATF4_5 FlexiTube siRNA (Qiagen, SI03019345).
Hs_ATF6_5 FlexiTube siRNA (Qiagen, SI03019205).
XBP-1 siRNA (h): sc-38627 (SANTA CRUZ BIOTECHNOLOGY).
Control siRNA (Qiagen, 1022076).
Construction of shRNA knockdown plasmids
All shRNAs were from Human pLKO.1 the RNAi consortium (TRC) Library (BROAD Institute/ Open Biosystems (https://www.broadinstitute.org/rnai-consortium/rnai-consortium-shrna-library).
shRNA-mediated stable cell lines were generated following “Lentivirus production and transduction” as stated below. For shAHCYL1 and shAHCYL2 proliferation assay, 50,000 cells were seeded in 6-well plate and cell number was recorded daily. For shITPR3 assay, cells were seeded to around 70% confluence, transfected with siAHCYL1 for 24h and re-seeded and endpoint cell number was recorded.
Human shAHCYL1 #1: GCACTGATAGAACTCTATAAT.
Human shITPR3 #1: CGTGAAGAACAAGACCGACTA.
Human shAHCYL2 #1: GCTCTAGCAGAAAGTGGATTT.
Human shAHCYL2 #2: GCAGAGTTTGGACGAAGAGAA.
Construction of CRISPR-Cas9 knockout plasmids
All sgRNAs were designed by CRISPick (Broad Institute) and ordered from IDT. Guide RNAs were cloned into pLentiCRISPRv2 following Zhang Lab CRISPR cloning protocol (26,27), and transformed and amplified using Stable Competent E. coli (High Efficiency) (NEB, C3040H). Successful cloning was confirmed by low throughput Sanger sequencing at UChicago DNA Sequencing Core.
Human sgAHCYL1 sg1: GATGTTTGGTGGGAAACAAG.
Human sgAHCYL1 sg2: AGATGTTACAAGCAGACCAG.
Human sgATF2 sg1: GCTCGTTCGACCAGTCACCA.
Human sgATF2 sg2: GGACGAACAATAGCTGATGT.
NTC (28) (non-targeting control) oligo: GTAGGCGCGCCGCTCTCTAC.
LentiCRISPR v2 plasmid was a gift from Feng Zhang (Addgene plasmid # 52961; http://n2t.net/addgene: 52961; RRID: Addgene_52961) (27).
Construction of CRISPR/Cas9-resistant wildtype AHCYL1 expression plasmid
CRISPR-Cas9-resistant WT AHCYL1 was generated by mutating Human sgAHCYL1 sg1 targeting sequence from GATGTTTGGTGGGAAACAAG into GATGTTcGGcGGcAAgCAgG. After Sanger sequencing validation, expression plasmid was cloned into pENTR-TOPO backbone using pENTER/D-TOPO Cloning Kit (Invitrogen, 45-021-8) following manufacturer’s instructions. pENTR-WT-AHCYL1 was cloned into pLenti CMV Blast DEST backbone by Gateway LR Clonase II Enzyme Mix (Invitrogen, 11791020), and amplified using 5-alpha Competent E. coli (High Efficiency) (NEB, C2987H).
pLenti CMV Blast DEST (706–1) was a gift from Eric Campeau & Paul Kaufman (Addgene plasmid # 17451; http://n2t.net/addgene:17451; RRID:Addgene_17451)
Complete DNA sequence of CRISPR-resistant human AHCYL1:
ATGTCGATGCCTGACGCGATGCCGCTGCCCGGGGTCGGGGAGGAGCTGAAGCAGGCCAAGGAGATCGAGGACGCCGAGAAGTACTCCTTCATGGCCACCGTCACCAAGGCGCCCAAGAAGCAAATCCAGTTTGCTGATGACATGCAGGAGTTCACCAAATTCCCCACCAAAACTGGCCGAAGATCTTTGTCTCGCTCGATCTCACAGTCCTCCACTGACAGCTACAGTTCAGCTGCATCCTACACAGATAGCTCTGATGATGAGGTTTCTCCCCGAGAGAAGCAGCAAACCAACTCCAAGGGCAGCAGCAATTTCTGTGTGAAGAACATCAAGCAGGCAGAATTTGGACGCCGGGAGATTGAGATTGCAGAGCAAGACATGTCTGCTCTGATTTCACTCAGGAAACGTGCTCAGGGGGAGAAGCCCTTGGCTGGTGCTAAAATAGTGGGCTGTACACACATCACAGCCCAGACAGCGGTGTTGATTGAGACACTCTGTGCCCTGGGGGCTCAGTGCCGCTGGTCTGCTTGTAACATCTACTCAACTCAGAATGAAGTAGCTGCAGCACTGGCTGAGGCTGGAGTTGCAGTGTTCGCTTGGAAGGGCGAGTCAGAAGATGACTTCTGGTGGTGTATTGACCGCTGTGTGAACATGGATGGGTGGCAGGCCAACATGATCCTGGATGATGGGGGAGACTTAACCCACTGGGTTTATAAGAAGTATCCAAACGTGTTTAAGAAGATCCGAGGCATTGTGGAAGAGAGCGTGACTGGTGTTCACAGGCTGTATCAGCTCTCCAAAGCTGGGAAGCTCTGTGTTCCGGCCATGAACGTCAATGATTCTGTTACCAAACAGAAGTTTGATAACTTGTACTGCTGCCGAGAATCCATTTTGGATGGCCTGAAGAGGACCACAGATGTGATGTTcGGcGGcAAgCAgGTGGTGGTGTGTGGCTATGGTGAGGTAGGCAAGGGCTGCTGTGCTGCTCTCAAAGCTCTTGGAGCAATTGTCTACATTACCGAAATCGACCCCATCTGTGCTCTGCAGGCCTGCATGGATGGGTTCAGGGTGGTAAAGCTAAATGAAGTCATCCGGCAAGTCGATGTCGTAATAACTTGCACAGGAAATAAGAATGTAGTGACACGGGAGCACTTGGATCGCATGAAAAACAGTTGTATCGTATGCAATATGGGCCACTCCAACACAGAAATCGATGTGACCAGCCTCCGCACTCCGGAGCTGACGTGGGAGCGAGTACGTTCTCAGGTGGACCATGTCATCTGGCCAGATGGCAAACGAGTTGTCCTCCTGGCAGAGGGTCGTCTACTCAATTTGAGCTGCTCCACAGTTCCCACCTTTGTTCTGTCCATCACAGCCACAACACAGGCTTTGGCACTGATAGAACTCTATAATGCACCCGAGGGGCGATACAAGCAGGATGTGTACTTGCTTCCTAAGAAAATGGATGAATACGTTGCCAGCTTGCATCTGCCATCATTTGATGCCCACCTTACAGAGCTGACAGATGACCAAGCAAAATATCTGGGACTCAACAAAAATGGGCCATTCAAACCTAATTATTACAGATACTAA
Lentivirus production, transduction, and cell proliferation assay
293T cells were seeded the day before virus production and reach 70% confluency for transfection. Lentiviruses were packaged by co-transfecting psPAX2, pMD2.G, and expression plasmids into HEK293T cells using TransIT-LT1 Transfection Reagent (Mirus, MIR 2305). After 18 hours, culture media was changed with virus harvesting media (DMEM with 10% FBS plus 1% BSA), and viruses were collected after 48 hours of transfection. Harvested viruses were filtered through 0.45 μm filter and used for cell transduction. HMCB cells were transduced with 4 μg/ml polybrene (American Bioanalytical, AB01643–00001), and all other cell lines were transduced with 8 μg/ml polybrene. Transduced cells were selected with 2 μg/ml puromycin (Sigma-Aldrich, P8833) for 48 hours for stable cell lines. Single cell clones were obtained by serial dilution method from HMCB sgAHCYL1 #1. After resistance selection, 50,000 cells were re-seeded in 6-well plate for cell proliferation assay as day 0. Meanwhile, chemicals were added: ISRIB (a generous gift from the Elf Lab), 4-Phenylbutyric acid (Sigma-Aldrich, P21005), TUDCA (Millipore, 580549). Cell number was recorded daily on automated cell counter (Bio-Rad, TC20) after mixing cell suspension with trypan blue (Sigma-Aldrich, T8154–100ML). Proteins or RNAs were collected for further analysis on day 4 or day 5.
psPAX2 was a gift from Didier Trono (Addgene plasmid # 12260; http://n2t.net/addgene:12260; RRID:Addgene_12260)
pMD2.G was a gift from Didier Trono (Addgene plasmid # 12259; http://n2t.net/addgene:12259; RRID:Addgene_12259)
ER isolation
ER and PMF fraction were isolated using Endoplasmic Reticulum Isolation Kit (Sigma-Aldrich, ER0100) following manufacturer’s instructions. PMF refers to the cytosol after removing the ER, mitochondria, and nucleus. Isolated fractions were lysed by RIPA cell lysis buffer (Millipore Sigma, 20–188) supplemented with protease inhibitors (Millipore Sigma, 59813300) and followed protein extraction steps as stated in “Immunoblotting and antibodies” section. Successful ER isolation was confirmed by calnexin expression, and successful PMF isolation was confirmed by β-actin expression.
ER calcium detection
Cells were seeded 24 hours in advance to around 70% confluence in 35 mm imaging dishes (Cellvis, D35-20-1.5-N) and transfected with 0.8 μg of pCMV R-CEPIA1er plasmid using Lipofectamine 3000 reagent (Life Technologies, L3000015) and Opti-MEM (Gibco, 31985–070) the next day. 24 hours later, media was changed, and cells were proceeded for analysis by either imaging or flow cytometry. For imaging, fluorescence was imaged under 562nm/641nm using Olympus “live cell” DSU Spinning Disk Confocal at UChicago Integrated Light Microscopy Core. Images and fluorescence intensity were analyzed using ImageJ. For flow cytometry, fluorescence was analyzed on LSR-Fortessa 4–15 flow cytometer or LSRII 4–12 at the UChicago Cytometry and Antibody Technology Core Facility and data was analyzed using FlowJo v10.4.
pCMV R-CEPIA1er was a gift from Masamitsu Iino (Addgene plasmid # 58216; http://n2t.net/addgene:58216 ; RRID: Addgene_58216) (29).
XBP1 splicing assay
Total RNA was extracted from samples and reverse transcribed as described above. XBP1 cDNA was PCR amplified with primers: F-AGGAAACTGAAAAACAGAGTAGCAGC; R-TCCTTCTGGGTAGACCTCTGG. Amplified cDNA was split into half: half was kept for “Uncut XBP1” control, half was digested using Pst1-HF (BioLabs, R3140L) enzyme. Samples were loaded with Gel loading dye (BioLabs, B7025S) and run on a DNA gel along with DNA ladder (BioLabs, N3232S). Spliced XBP1 ratio was calculated by dividing spliced XBP1 (1S) by total XBP1 band intensity. XBP1 band intensity was quantified using ImageJ using “Gels” function.
Apoptosis assay
Cell apoptosis was analyzed using Annexin V (BD, 556547) and PI staining (ThermoFisher, BMS500PI) following manufacturer’s instructions. Data was collected on LSR-Fortessa 4–15 flow cytometer or LSRII 4–12 at the UChicago Cytometry and Antibody Technology Core Facility and analyzed using FlowJo v10.4.
Cell cycle analysis
One million cells were collected for each group, washed with PBS, and fixed dropwise with 70% cold ethanol with gentle vortexing. Cells were fixed on ice for 1 hour and washed with cold PBS. 0.5 mg/ml Rnase A was added and incubated at 37 degrees for 1 hour. Cells were stained with 10 μg/ml PI solution (ThermoFisher, BMS500PI) and analyzed by flow cytometry at 488 nm.
RNA-sequencing and analysis
Sample triplicates were collected and followed by RNA extraction using the PureLink RNA Mini Kit (12183018A, Invitrogen) per manufacturer’s instructions. At least 500 ng extracted RNA per sample was sent to Novogene for sequencing and bioinformatics analysis. RNA sequencing was performed via Illumina Next Generation Sequencing. Fragments were aligned with HISAT2 to reference gene, and differential gene expression analysis was performed by DESeq.
Transcription factor scan
Transcription factor scan was performed using “gene-regulation.com” (http://gene-regulation.com/pub/programs.html), with program “Match - 1.0 Public”. Potential transcription factors that recognize AHCYL1 promoter region were identified.
Statistical analysis
Statistical analysis for all experimental data is included in the figure legends, with sample size and type of analysis indicated. p-values less than or equal to 0.05 is considered as significant: ns, not significant; *, p≤0.05; **, p≤0.01; ***, p≤0.001.
Data Availability Statement:
The data generated in this study will be publicly available in Gene Expression Omnibus (GEO) upon publication. For RNA-seq deposit, accession number is: GSE253246. The data generated in this study are available within the article and its supplementary data files. The data generated in this study are available upon request from the corresponding author Jing Chen (jingchen@bsd.uchicago.edu).
Results
AHCYL1 is selectively highly expressed in mutant NRAS but not mutant BRAF expressing human melanoma.
We previously conducted loss-of-function RNAi screens to identify oncogene-specific metabolic requirements (20,30), which reveals that AHCYL1 is among the top candidates that are critical for cell proliferation of mutant NRAS expressing human melanoma cells, but not for mutant BRAF or WT expressing human melanoma cells (Supplementary Fig. S1A). Intriguingly, we found that AHCYL1 mRNA level correlates with NRAS mutational status in human skin cutaneous melanoma from the cancer genome atlas (TCGA) analysis (Fig. 1A), and we confirmed the selective upregulation of AHCYL1 mRNA levels (Fig. 1B) and protein expression (Fig. 1C) in diverse human melanoma cells harboring mutated NRAS compared to cells harboring mutated BRAF. To further explore the causative connection between NRAS mutational status and AHCYL1 expression, we transiently introduced WT NRAS, NRAS Q61K, BRAF V600E, or an empty expression vector into human immortalized Mel-ST melanocytes. We found that, only introducing NRAS Q61K results in increased protein and mRNA levels of AHCYL1 in Mel-ST cells (Fig. 1D), suggesting NRAS dependent AHCYL1 regulation. Collectively, these results demonstrate that AHCYL1 is selectively upregulated in mutant NRAS but not mutant BRAF expressing human melanoma, implying AHCYL1 selective criticalness.
Fig. 1. AHCYL1 is selectively highly expressed in NRAS-mutant but not BRAF-mutant expressing human melanoma.

(A) TCGA database analysis of AHCYL1 mRNA levels in human skin cutaneous melanoma samples expressing mutated NRAS, mutated BRAF, or WT. Highlighted lines indicate dataset median. (B) AHCYL1 relative mRNA expression in human melanoma cell lines expressing mutated NRAS or mutated BRAF by RT-qPCR. (C) AHCYL1 protein expression in human melanoma cell lines expressing mutated NRAS or mutated BRAF by immunoblotting. (D) AHCYL1 protein expression by immunoblotting (left) and relative AHCYL1 mRNA expression by RT-qPCR (right) in human immortal melanocytes Mel-ST, exogenously expressed with mutated NRAS, mutated BRAF, WT, or empty vector. Error bars indicate means ± SD (n ≥ 3). p-values were calculated using two-tailed, unpaired Student’s t-test (ns, not significant; *, p≤0.05; **, p≤0.01; ***, p≤0.001).
AHCYL1 is selectively critical for cell proliferation and tumor growth of NRAS-mutated human melanoma.
Next, we sought to investigate whether AHCYL1 selective upregulation in NRAS-mutated human melanoma (Fig. 1) corresponds with selective requirement of AHCYL1. First, we knocked down AHCYL1 using siRNA, and AHCYL1 deficiency results in selective proliferation attenuation in HMCB cells expressing mutant NRAS but not A375 cells expressing mutant BRAF (Fig. 2A, 2B; knockdown efficiency shown in Fig. 2C). In addition, we examined three other human melanoma cell lines, VMM39 and SK-MEL-2 that express mutant NRAS, and SK5 that expresses mutant BRAF. Consistent with these results, AHCYL1 knockdown by siRNA selectively attenuates the cell proliferation of VMM39 and SK-MEL-2 but not SK5 (Supplementary Fig. S1B–S1E).
Fig. 2. AHCYL1 is selectively critical for cell proliferation and tumor growth of NRAS-mutated human melanoma, but not for human melanoma expressing mutant BRAF.

Cell proliferation of human melanoma cells expressing (A) NRAS mutation or (B) BRAF mutation after siRNA mediated AHCYL1 knockdown. (C) AHCYL1 protein expression after knockdown checked by immunoblotting. Cell proliferation of human melanoma cells expressing (D) mutant NRAS or (E) mutant BRAF after shRNA mediated AHCYL1 knockdown. (F) AHCYL1 protein expression after knockdown checked by immunoblotting. Tumor volume and tumor weight of nude mice xenograft-implanted with human melanoma cells expressing mutated NRAS (G) or mutated BRAF (H) after shRNA-mediated AHCYL1 knockdown. Cell proliferation of human melanoma cells harboring (I) NRAS mutation or (J) BRAF mutation after CRISPR-Cas9-mediated AHCYL1 knockout. NTC, non-targeting control. (K) AHCYL1 protein expression after knockout checked by immunoblotting. (L) Cell proliferation of AHCYL1 knocked out NRAS-mutated human melanoma cells after putting back WT AHCYL1 or control vector. “KO” is the single cell clone developed from HMCB sgAHCYL1 #1 (Fig 2I), “rescue” is putting back CRISPR-Cas9-resistant WT AHCYL1 into “KO” cells. (Supplementary Fig. S1G). (M) AHCYL1 protein expression checked by immunoblotting. Error bars indicate means ± SD (n ≥ 3). p-values were calculated using two-tailed, unpaired Student’s t-test (ns, not significant; *, p≤0.05; **, p≤0.01; ***, p≤0.001).
In addition, shRNA mediated AHCYL1 knockdown results in attenuated cell proliferation in HMCB (NRAS Q61K, Fig. 2D), but not in A375 cells (BRAF V600E, Fig. 2E, 2F), confirming selective AHCYL1 requirement in NRAS-mutated melanoma cells. Then, we inoculated the HMCB and A375 shAHCYL1 cells into nude mice for xenograft implantation. Consistent with our in vitro findings, AHCYL1 knockdown significantly decreases the tumor growth potential in HMCB shAHCYL1 cells implanted mice (Fig. 2G), while no significant changes were observed in A375 shAHCYL1 cells implanted mice (Fig. 2H). All these show that AHCYL1 is selectively critical for both the cell proliferation and tumor growth potential of NRAS-mutated human melanoma.
To further validate, we conducted CRISPR-Cas9 mediated AHCYL1 knockout. Consistent with previous findings, HMCB cells (NRAS Q61K) show decreased cell proliferation, whereas no significant differences of cell proliferation in A375 cells (BRAF V600E) (Fig. 2I–2K). In addition, we obtained single cell clones from HMCB AHCYL1 knockout polyclonal cells (Supplementary Fig. S1F), and introduced either WT AHCYL1 expression vector or control vector back into the single cell clone to a comparable AHCYL1 protein level as in parental HMCB cells (Fig. 2L, 2M). Introducing AHCYL1 back rescues the growth defect caused by AHCYL1 deficiency, further demonstrating that the growth defect is from AHCYL1 deficiency itself and suggesting no off-target effects from AHCYL1 sgRNAs (Fig. 2L). Then, we injected the HMCB AHCYL1 knockout and rescue cell line into nude mice, and both the tumor growth potential and Ki-67 expression decrease with AHCYL1 knockout cells implantation comparing to rescue or control HMCB cell implanted mice (Supplementary Fig. S1G). Moreover, we injected A375 AHCYL1 knockout cells into nude mice, and there are no significant differences in tumor growth potential or Ki-67 expression comparing to control A375 cells (Supplementary Fig. S1H). We also analyzed the cell cycle before and after AHCYL1 knockout. Results show that, after AHCYL1 knockout, HMCB cells exhibit cell cycle arrest at G0/G1 phase (Supplementary Fig. S2A), while no significant change in A375 cells (Supplementary Fig. S2B). These results together suggest that AHCYL1 is selectively critical for both the cell proliferation and the tumor growth potential of NRAS-mutated human melanoma.
Both AHCYL1 and AHCYL2 are AHCY-like proteins that share similar protein sequence (22). Thus, we investigated the role of AHCYL2 in oncogene-specific metabolic regulations. Based on TCGA analysis, AHCYL2 mRNA is not upregulated in human NRAS-mutated skin cutaneous melanoma (Supplementary Fig. S3A). Additionally, AHCYL2 mRNA levels are significantly lower than AHCYL1 mRNA levels in both HMCB cells (Supplementary Fig. S3B) and A375 cells (Supplementary Fig. S3C), with around 50 and 30 times less expression, respectively. This implies much less AHCYL2 expression in human melanoma cells compared to AHCYL1. To examine AHCYL2 requirement, we conducted shRNA-mediated knockdown of AHCYL2, and the results show that AHCYL2 it’s not critical for HMCB cell proliferation (Supplementary Fig. S3D). Mechanistically, even though sharing similar protein sequences, AHCYL2 cannot bind to IP3R as AHCYL1, due to its extra non-structural proline/alanine tail (31,32). In conclusion, AHCYL2 is expressed at much lower levels than AHCYL1 in human melanoma cells, and not required for cell proliferation in NRAS-mutated melanoma.
AHCYL1 is selectively critical for cell proliferation of KRAS-mutated human colorectal cancer cells, but not for human colorectal cancer cells expressing mutant BRAF.
To explore whether AHCYL1 is critical for other RAS mutated cancers, we examined two human colorectal cancer cell lines, HCT116 expressing mutant KRAS G13D and HT29 expressing mutant BRAF V600E. First, we knocked down AHCYL1 using shRNA, and AHCYL1 deficiency results in selective growth attenuation in HCT116 cells (KRAS G13D) but not HT29 cells (BRAF V600E) (Supplementary Fig. S4A–S4C). Consistent with the shRNA results, siRNA mediated AHCYL1 knockdown also causes selective growth attenuation in HCT116 cells but not in HT29 cells (Supplementary Fig. S4D–S4F). Thus, these results together suggest that AHCYL1 is selectively critical for KRAS-mutated human colorectal cancer cell HCT116 proliferation. However, TCGA data analysis reveals that KRAS mutational status does not correlate with AHCYL1 (Supplementary Fig. S4G) mRNA levels in human colorectal adenocarcinoma patient samples, suggesting that KRAS mutants might achieve AHCYL1 reliance through different mechanisms compared to cancer cells expressing NRAS mutants.
AHCYL1 deficiency causes ER calcium decrease in NRAS mutant-expressing melanoma cells.
AHCYL1 has been reported to bind to and suppress the IP3R, an ER calcium channel protein, and such binding prevents IP3 induced ER calcium release (23,24). Thus, we examined the calcium levels in the ER before and after AHCYL1 deficiency. First, we generated HMCB (NRAS Q61K) and A375 (BRAF V600E) cells with stable IP3R knockdown, isolated the ER proportion and the post-mitochondria fraction (PMF) (the cytosol after removing the nucleus, mitochondria, and the ER), and measured AHCYL1 protein level. Results show that AHCYL1 recruitment and localization on the ER decrease after IP3R (ITPR3) knockdown (Fig. 3A, S5A). We validated that IP3R deficiency doesn’t change AHCYL1 protein level in the whole cell lysates from HMCB and A375 cells (Fig S5B). Interestingly, the proportion of AHCYL1 localizing on the ER comparing to in the cytosol is also higher in HMCB (NRAS Q61K) than in A375 (BRAF V600E) (Fig. 3B), suggesting higher binding affinity of AHCYL1 to the ER in HMCB cells. Next, we examined ER calcium levels using an ER specific calcium sensor, and found that in HMCB cells expressing mutated NRAS, stable knockdown of AHCYL1 leads to a significant decrease in ER calcium levels, while no significant change was observed in A375 cells expressing mutated BRAF (Fig. 3C, 3D). To further confirm, we measured ER calcium levels in AHCYL1 knockout HMCB cells, where we put back either WT AHCYL1 expression vector (“Rescue”) or control vector (“AHCYL1 KO”) (Fig. 2L, 2M) and found that putting back WT AHCYL1 rescues the ER calcium decrease resulting from AHCYL1 deficiency (Fig. 3E). These results show that, AHCYL1 deficiency selectively leads to ER calcium decrease in HMCB cells expressing mutant NRAS. Moreover, we found that in HMCB cells with stable IP3R knockdown, AHCYL1 deficiency by siRNA no longer affects the endpoint cell number (Fig. 3F). The knockdown efficiency of AHCYL1 (Fig. 3G) and IP3R (Fig. 3H) mRNA and protein (Fig. 3I) are confirmed. This demonstrates that the cell growth attenuation caused by AHCYL1 deficiency is through the IP3R.
Fig. 3. AHCYL1 deficiency causes decrease in ER calcium.

(A) IP3R and AHCYL1 protein level in isolated ER or in post mitochondria fraction (PMF) of HMCB cells before and after shRNA mediated IP3R knockdown. PMF is the cytosol after removing the nucleus, the ER, and the mitochondria. (B) AHCYL1 protein localization in human melanoma cells expressing mutant NRAS or mutant BRAF by immunoblotting. (C) Mean fluorescence intensity (MFI) of ER calcium sensor in human melanoma cells expressing mutant NRAS or mutant BRAF after shRNA mediated AHCYL1 knockdown; (D) Representative images of ER calcium sensor, scale bar is 10 μm. (E) MFI of ER calcium sensor relative to nucleus in AHCYL1-ablated NRAS-mutated HMCB human melanoma cells after putting back WT AHCYL1 expression vector or control vector. (F) Endpoint cell number of ITPR3-ablated NRAS-mutated HMCB human melanoma cells after siRNA-mediated AHCYL1 knockdown. Relative (G) AHCYL1 and (H) ITPR3 mRNA expression checked by RT-qPCR. (I) AHCYL1 and IP3R protein expression checked by immunoblotting. Error bars indicate means ± SD (n ≥ 3). p-values were calculated using two-tailed, unpaired Student’s t-test (ns, not significant; *, p≤0.05; **, p≤0.01; ***, p≤0.001).
Taken together, our results reveal that AHCYL1 deficiency selectively causes a decrease in ER calcium levels in NRAS-mutated human melanoma cells.
AHCYL1 deficiency in NRAS mutant-expressing melanoma cells activates the UPR and triggers subsequent cell apoptosis.
Since ER calcium homeostasis is critical for calcium-dependent chaperons function as well as for protein folding, we investigated whether the observed ER calcium decrease from AHCYL1 deficiency (Fig. 3) causes ER stress (33). Cells sense and respond to ER stress by activating the UPR (2–7), so we examined all three branches of the UPR after AHCYL1 deficiency in both HMCB and A375 cells, including ATF6 cleavage (Fig. 4A, 4B), ATF4 expression (Fig. 4C, 4D), and XBP1 splicing (Fig. 4E). All three branches of the UPR are selectively upregulated after AHCYL1 deficiency mediated by sgRNA (Fig. 4A, 4D) and by shRNA (Fig. 4B, 4C and 4E) in HMCB cells (NRAS Q61K) but not in A375 cells (BRAF V600E). This demonstrates the presence of the ER stress. We further confirmed the critical role of the UPR by knocking down ATF4, ATF6, or XBP1. Results show that, knocking down ATF4, ATF6, or XBP1 by siRNA abolishes the AHCYL1 dependency on HMCB cell proliferation (Fig. 4F–4K), indicating that the requirement of AHCYL1 is dependent on the UPR. These data together demonstrate that, AHCYL1 knockdown causes ER stress and activates the UPR.
Fig. 4. AHCYL1 deficiency activates the unfolded protein response (UPR).

ATF6 protein cleavage in human melanoma cells expressing mutant NRAS or mutant BRAF after (A) CRISPR-Cas9-mediated AHCYL1 knockout or (B) shRNA mediated AHCYL1 knockdown by immunoblotting. ATF4 protein expression in human melanoma cells expressing mutant NRAS or mutant BRAF after (C) shRNA mediated AHCYL1 knockdown (two minutes exposure time for ATF4) or (D) CRISPR-Cas9-mediated AHCYL1 knockout (two minutes exposure time for ATF4) by immunoblotting. (E) XBP1 splicing assay for human melanoma cells expressing mutant NRAS or mutant BRAF after shRNA mediated AHCYL1 knockdown by gel electrophoresis. Endpoint cell number of HMCB cells with or without (F) ATF4 and ATF6, or (G) XBP1 knockdown before and after AHCYL1 knockout; knockdown efficiency of (H) ATF4, (I) ATF6, (J) AHCYL1, and (K) XBP1. Error bars indicate means ± SD (n ≥ 3). p-values were calculated using two-tailed, unpaired Student’s t-test (ns, not significant; *, p≤0.05; **, p≤0.01; ***, p≤0.001).
Sustained UPR activation can trigger cell apoptosis (34). Indeed, we found that CHOP (DDIT3), the transcription factor that plays an important role in UPR-induced apoptosis (34), is significantly upregulated after AHCYL1 knockout in HMCB cells (Fig. 5A, 5B, S6A, S6B). This is consistent with Annexin V and PI cell apoptosis analysis (Fig. 5C–5E, S6C) which shows that the level of apoptosis significantly increases after AHCYL1 deficiency in HMCB cells expressing mutant NRAS. The activation of apoptosis in HMCB cells is also confirmed by the increase of cytochrome C in the cytosol and decrease in the mitochondria after AHCYL1 knockdown (Supplementary Fig. S6D).
Fig. 5. AHCYL1 deficiency triggers apoptosis resulted from the UPR activation.

Relative (A) DDIT3 (CHOP) and (B) AHCYL1 mRNA expression after CRISPR-Cas9-mediated AHCYL1 knockout in HMCB and A375 human melanoma cells. (C) Percentage apoptotic cells after AHCYL1 knockout in HMCB and A375 cells by Annexin V and PI staining. Representative cell apoptosis flow cytometry images by Annexin V and PI staining in human melanoma cells expressing (D) NRAS mutant or (E) BRAF mutant after AHCYL1 knockout. Representative cell apoptosis flow cytometry images in HMCB cells treated with 200 nM ISRIB (F) in control cells or (G) after AHCYL1 knockout; (H) Summary of percentage apoptotic cells. Endpoint cell number of AHCYL1-ablated or control NRAS-mutated HMCB human melanoma cells treated with (I) 200 nM ISRIB, (J) 0.8 mM TUDCA, or (K) 0.3 mM 4PBA. Error bars indicate means ± SD (n ≥ 3). p-values were calculated using two-tailed, unpaired Student’s t-test (ns, not significant; *, p≤0.05; **, p≤0.01; ***, p≤0.001).
Next, we asked whether apoptosis can be alleviated by reducing the ER stress. To this end, we used ISRIB, a potent integrated stress response (ISR) inhibitor that reverses the effect from eIF2a phosphorylation (35–38), and found that both the cell apoptosis level (Fig. 5F–5H) and the endpoint cell number (Fig. 5I) are significantly alleviated in HMCB cells (NRAS Q61K) with AHCYL1 deficiency. We further validated these findings using two other chemical chaperons, Tauroursodeoxycholic acid (TUDCA) (39) and 4-Phenylbutyric acid (4-PBA) (39,40), both of which have been previously reported to reduce the ER stress. We show that both TUDCA (Fig. 5J) and 4-PBA (Fig. 5K) chaperons significantly relieve the endpoint cell number in AHCYL1-deficient HMCB cells. These results demonstrate that apoptosis caused by AHCYL1 deficiency is from the ER stress.
Furthermore, we validated our key findings in three more human NRAS mutation harboring melanoma cell lines, VMM39 (NRAS Q61K, Q61R), Hs 936.T (NRAS Q61K), and SK-MEL-147 (NRAS Q61K). Results show that, shRNA mediated AHCYL1 knockdown results in reduced cell proliferation and ER calcium levels with elevated ATF4 and CHOP protein levels (Supplementary Fig. S7).
Collectively, these results demonstrate that, AHCYL1 deficiency causes ER stress that activates the UPR and triggers downstream apoptosis.
AHCYL1 deficiency causes cell growth attenuation, ER calcium decrease, and apoptosis in NRAS-Q61K overexpressed Mel-ST cells.
To further confirm, we overexpressed NRAS Q61K in human immortalized melanocytes Mel-ST (Fig. 1C), and checked cell proliferation, ER calcium, and cell death before and after siRNA mediated AHCYL1 knockdown (Supplementary Fig. S8). Results show that, AHCYL1 deficiency reduces cell proliferation (Supplementary Fig. S8A, S8B), ER calcium level (Supplementary Fig. S8C), while increases cell death and DDIT3 (CHOP) levels (Supplementary Fig. S8D–F), in NRAS Q61K overexpressed Mel-ST cells, but not in Mel-ST cells with control vector overexpression. This indicates that AHCYL1 selective requirement for cell proliferation, ER calcium level, and cell death is NRAS mutation dependent.
RNA-Seq analysis shows downregulation of gene sets related to cell proliferation in NRAS-mutated human melanoma cells HMCB after AHCYL1 knockdown.
We next performed RNA-Seq analysis on HMCB human melanoma cells expressing mutated NRAS, before and after siRNA-mediated AHCYL1 knockdown. Principal component analysis (PCA) shows that AHCYL1 knockdown samples separated from control samples (Fig. 6A). Volcano plot analysis summarizes genes that are downregulated or upregulated after AHCYL1 knockdown (Fig. 6B) with confirmed AHCYL1 knockdown efficiency (Fig. 6C). To gain further insight, we performed gene set enrichment analysis (GSEA) on hallmark gene sets and summarized the gene sets that are significantly downregulated in AHCYL1 knockdown samples (Fig. 6D). Data reveals that AHCYL1 knockdown downregulates gene sets related to cell proliferation, and detailed GSEA plots are presented, including Hallmark_MYC_Targets_V1, Hallmark_MYC_Targets_V2, Hallmark_MTORC1_Signaling (Fig. 6E–6G). There were no significantly upregulated gene sets. To validate our RNA-Seq results, we performed RT-qPCR and tested representative genes that have been reported to be critical for cell proliferation and survival regulation in HMCB cells in the Hallmark_MYC_Targets_V1 (Supplementary Fig. S9A), Hallmark_MYC_Targets_V2 (Supplementary Fig. S9B), and Hallmark_MTORC1_Signaling gene sets (Supplementary Fig. S9C). We have also tested these genes in A375 cells (Supplementary Fig. S9D–S9F). Our results show that knockdown of AHCYL1 downregulates gene sets related to cell proliferation in NRAS-mutated human melanoma cells HMCB.
Fig. 6. RNA-Seq analysis shows downregulation of gene sets related to cell proliferation in NRAS-mutated human melanoma cells HMCB after AHCYL1 knockdown.

(A) Principal component analysis (PCA) of RNA-Seq samples from NRAS-mutated human melanoma cells after siRNA-mediated AHCYL1 knockdown. (B) RNA-Seq volcano plot summary, fold change indicates gene expression of AHCYL1 knockdown samples subtracted by gene expression of control samples. (C) Relative AHCYL1 mRNA levels after siRNA-mediated AHCYL1 knockdown from RNA-Seq analysis. (D) Downregulated hallmark gene sets by gene set enrichment analysis (GSEA). GSEA of hallmark gene set (E) MYC targets V1, (F) MYC targets V2, and (G) MTORC1 signaling after siRNA-mediated AHCYL1 knockdown in NRAS-mutated human melanoma cells. NES, normalized enrichment score. Error bars indicate means ± SD (n ≥ 3). p-values were calculated using two-tailed, unpaired Student’s t-test (ns, not significant; *, p≤0.05; **, p≤0.01; ***, p≤0.001).
AHCYL1 transcription in NRAS-mutated melanoma cells is regulated by transcription factor ATF2.
Next, we sought to explore the selective AHCYL1 upregulation in NRAS-mutated human melanoma (Fig. 1). To answer this question, we investigated AHCYL1 transcription factors (TFs). We used an online tool (gene-regulation.com) that screens for TFs based on their reported binding response elements that can match AHCYL1 promoter region sequence (Supplemental Table 1). From core and matrix match score, CREB and CRE-BP1 (ATF2) were identified and further validated. We found that treatment with a small molecule CREB inhibitor, 666–15 (41), resulted in dose-dependent increase in AHCYL1 mRNA levels in HMCB cells but not in A375 cells (Supplementary Fig. S10A, S10B), indicating CREB doesn’t positively regulate AHCYL1 transcription. Moreover, we checked CREB phosphorylation and found that CREB is more phosphorylated in A375 than HMCB cells (Supplementary Fig. S10C), indicating higher CREB activity in A375 cells, which also implies that AHCYL1 is not positively regulated by CREB. Thus, these results together suggest that CREB is not a positive regulator of AHCYL1 transcription.
Next, we examined activating transcription factor 2 (ATF2), and found that based on TCGA analysis, ATF2 mRNA level is significantly higher in NRAS-mutant expressing human melanoma comparing to WT expressing human melanoma (Fig. 7A). In addition, both the ATF2 mRNA level (Fig. 7B) and protein level (Fig. 7C) are significantly upregulated in NRAS-mutated HMCB cells than in BRAF-mutated A375 cells, which is consistent with AHCYL1 selective upregulation (Fig. 1). To further validate, we found that exogenous over expression of NRAS Q61K, but not BRAF V600E, increases ATF2 mRNA levels in immortalized skin melanocytes Mel-ST (Fig. 7D), suggesting NRAS mutant dependent ATF2 transcription. Then, to check whether ATF2 regulates AHCYL1 transcription, we knocked out ATF2 by CRISPR-Cas9 in both HMCB and A375 cells and found that only in HMCB cells (NRAS Q61K), ATF2 deficiency downregulates AHCYL1 transcription (Fig. 7E, 7F), indicating AHCYL1 is selectively regulated by ATF2 in HMCB cells. Whereas in both A375 and HMCB, ATF2 deficiency causes cell growth attenuation (Fig. 7E, 7F), consistent with previous report that ATF2 is required for mouse skin tumor growth and progression (42). Together, we show that ATF2 selectively positively regulates AHCYL1 transcription in NRAS mutant expressing human melanoma cells (Fig. 7G). We also found there is positive correlation between ATF2 and AHCYL1 mRNA levels in both NRAS or BRAF mutation harboring human cutaneous melanoma patients based on TCGA analysis, while ATF2 and AHCYL1 levels are in general lower in BRAF mutant expressing patients (Supplementary Fig. S11). Since we showed that ATF2 only regulates AHCYL1 mRNA in HMCB cells expressing mutant NRAS (Fig 7), these observations suggest that ATF2 might also be commonly crucial for cell proliferation of BRAF mutant-expressing melanoma cells, which, however, is mediated through different mechanisms other than the regulation of AHCYL1.
Fig. 7. AHCYL1 transcription in NRAS-mutated melanoma cells is regulated by transcription factor ATF2.
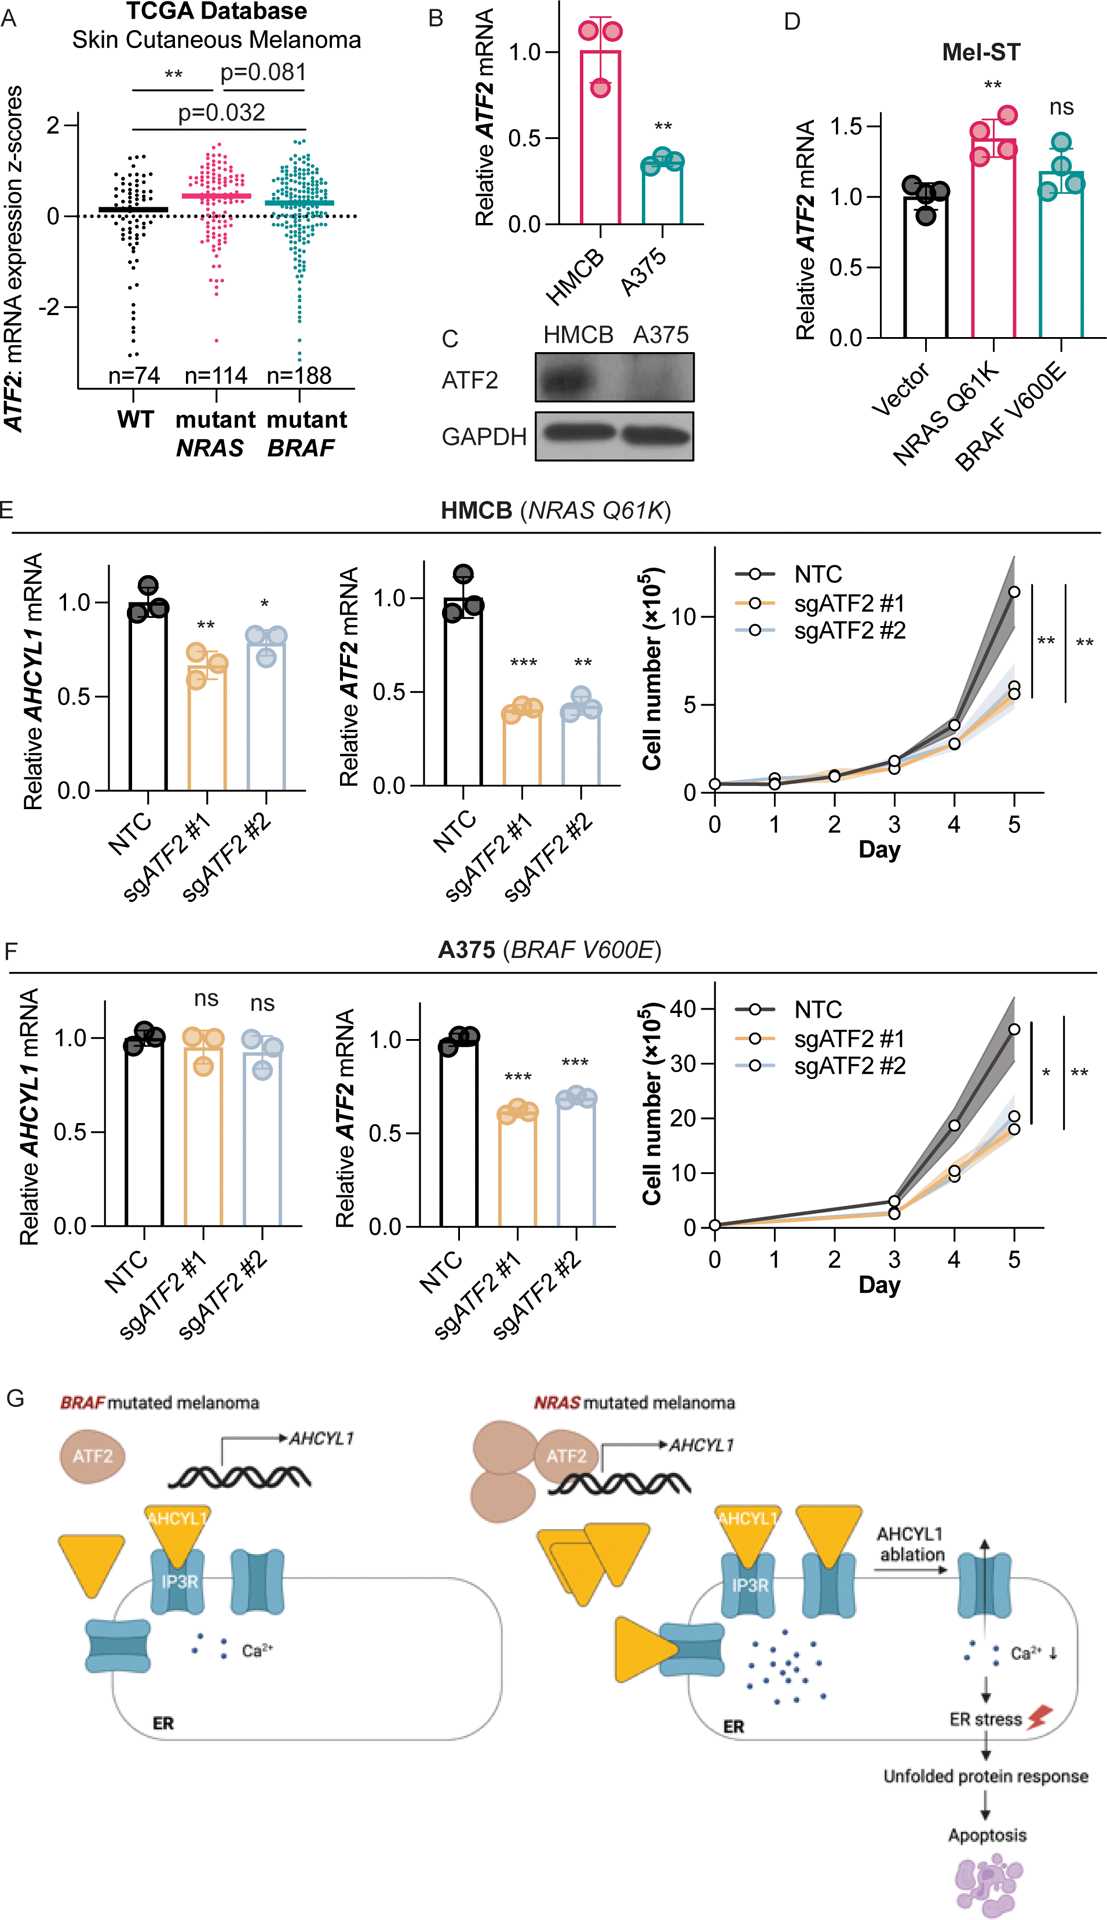
(A) TCGA database analysis of ATF2 mRNA levels in human skin cutaneous melanoma samples expressing NRAS mutant, BRAF mutant, or WT. Highlighted lines indicate dataset median. (B) ATF2 relative mRNA expression in human melanoma cell lines expressing mutated NRAS or mutated BRAF by RT-qPCR. (C) ATF2 protein expression in human melanoma cell lines expressing mutated NRAS or mutated BRAF by immunoblotting. (D) Relative ATF2 mRNA levels in human immortal melanocytes Mel-ST, exogenously expressed with mutated NRAS, mutated BRAF, or vector by RT-qPCR. (E) Relative AHCYL1 (left) and ATF2 (middle) mRNA levels after ATF2 knockout by RT-qPCR. Cell proliferation (right) of human melanoma cells expressing NRAS mutant. (F) Relative AHCYL1 (left) and ATF2 (middle) mRNA levels after ATF2 knockout by RT-qPCR. Cell proliferation (right) of human melanoma cells expressing BRAF mutant. (G) Proposed working model. Error bars indicate means ± SD (n ≥ 3). p-values were calculated using two-tailed, unpaired Student’s t-test (ns, not significant; *, p≤0.05; **, p≤0.01; ***, p≤0.001).
We next sought to explore the upstream of ATF2 and the mechanism of the selective ATF2 upregulation in HMCB cells. Previous studies have shown that ATF2 can be activated by stress kinases JNK and p38 (43–46), and that ATF2 is a reported downstream target of MAPK14 (44,46) (p38α). To explore this, we knocked down MAPK14 in HMCB and A375 cells and found that AHCYL1 transcription significantly decreases in HMCB cells, while no significant changes of AHCYL1 levels were observed in A375 cells (Supplementary Fig. S12A, S12B). Knockdown of MAPK14 affects cell proliferation in both HMCB and A375 cells (Supplementary Fig. S12C, S12D). These results together suggest that AHCYL1 transcription is selectively regulated by MAPK14 in HMCB cells.
These data together suggest that ATF2 and MAPK14 contribute to AHCYL1 transcription in NRAS mutant expressing human melanoma cells, but not in human melanoma cells expressing BRAF V600E.
Discussion
Our study for the first time demonstrates the critical role of AHCYL1 in regulating ER calcium homeostasis in human melanoma and highlights the therapeutic potential of targeting AHCYL1 in NRAS-mutated melanoma. This is of clinical significance given the lack of effective treatments specific to NRAS mutations and the ever-present challenges of targeting mutated NRAS itself (47). Our study reinforces the strategy of targeting synthetic lethal partners in addition to targeting hard-to-target oncogenes directly, which can be worth for therapeutic exploration (48,49). Additionally, we also showed that the critical role of AHCYL1 may apply to broader RAS mutation harboring cancers, such as KRAS-mutated human colorectal cancer (Supplementary Fig. S4). Thus, AHCYL1 can be a promising target for RAS mutated human cancers.
Conceptually, our finding highlights the critical role of ER calcium homeostasis for cancer cell proliferation and survival (2–7), and that the sustained UPR can trigger cell apoptosis (34). Moreover, we not only observed changes in ER calcium before and after AHCYL1 deficiency but also there are differences in cellular basal ER calcium levels: in NRAS-mutated human melanoma cell HMCB, the basal ER calcium is significantly higher than BRAF-mutated melanoma cell A375 (Fig. 3C). This observation raises the question of whether basal ER calcium levels vary across cell types and whether such variation is oncogenic background dependent. Particularly, NRAS-mutated melanoma has been reported to be more sensitive to intracellular calcium alterations than BRAF-mutated melanoma (50). Intriguingly, we also noted that HMCB cells were larger in size than A375, suggesting greater cell growth and more extensive protein synthesis and folding in NRAS-mutated HMCB cells. Future studies will explore whether cell growth and size can be oncogene-dependent and whether they correlate with basal ER calcium levels and protein folding requirements. To summarize, NRAS and BRAF mutant expressing human melanoma cells respond differently to AHCYL1 deficiency, this can be attributed to the following reasons: we have found that AHCYL1 is selectively highly expressed in mutant NRAS but not mutant BRAF expressing human melanoma (Fig 1), which leads to selectively higher calcium level in the ER (Fig 3C) as well as basal UPR activation (Fig 4A–4E) only in NRAS mutant-expressing HMCB cells but not in A375 cells expressing BRAF V600E. In addition, we found that there is more ER AHCYL1 protein in the NRAS-mutated than BRAF-mutated human melanoma cells (Fig 3B). Thus, AHCYL1 deficiency in NRAS-mutated human melanoma cells causes calcium leakage from the ER and introduces additional ER stress signals, which ultimately causes cell apoptosis (Fig 7G).
Moreover, our study expands the current understanding of the function and regulation of AHCYL1 protein itself. First, our work is consistent with previous literatures on the binding and suppression of IP3R by AHCYL1 (21,23,24), and we further show that AHCYL1 deficiency disrupts downstream ER calcium homeostasis, activates the UPR and triggers apoptosis in cancer cells. In addition to the downstream of AHCYL1, our work also reveals that AHCYL1 upstream transcription is controlled by ATF2 (Fig. 7) and may relate to p38α (MAPK14) (Supplementary Fig. S12). Consistent with AHCYL1 selective upregulation, we show that its transcription factor ATF2 is also selectively upregulated in NRAS-mutated melanoma cell HMCB (Fig. 7A–7C). Previous studies indicate that ATF2 is activated by stress kinases JNK and p38 (43–46), and that ATF2 is a reported downstream target of MAPK14 (44,46). Interestingly, JNK and p38 pathways are known to be activated by mutated RAS, which may explain why AHCYL1 upregulation is specific to NRAS-mutated melanoma but not observed in BRAF-mutated melanoma that belongs to the ERK pathway (51). In future studies, it would be valuable to investigate the detailed signaling regulation, especially phosphorylation status and the protein activities.
Over the past decade, our research group and others elucidated multiple oncogene-specific metabolic regulations (20,30,52–56). We have found that the ketogenic enzyme HMG-CoA lyase (HMGCL) is selectively essential in melanoma cells expressing BRAF V600E, where its product acetoacetate promotes BRAF V600E-dependent MEK1 activation (20,52,53). Moreover, we demonstrated that chondroitin-4-sulfate (CHSA), a circulating dietary supplement, exhibits intracellular signaling function by enhancing casein kinase II (CKII)-PTEN binding, leading to PTEN inhibition and subsequent AKT activation, which are crucial for cancers expressing BRAF V600E (54). We also reported that Phospholipase A2, group VII (PLA2G7) and Lyso-PAF act as key elements of RAS-RAF1 signaling and exhibit intracellular signaling functions (30). Our study on AHCYL1 further adds to this knowledge and demonstrates the concept of oncogene-specific calcium regulations in cancer cells, and sheds light on oncogene-mediated metabolic rewiring in cancer cells compare to normal cells, providing new insights in development of novel precision medicine for cancer treatment (57).
Supplementary Material
Implications:
Our findings suggest that targeting the AHCYL1-IP3R axis presents a novel therapeutic approach for NRAS-mutated melanomas, with potential applicability to all cancers harboring RAS mutations, such as KRAS-mutated human colorectal cancers.
Acknowledgments
This work was supported in part by: NIH grants including CA140515, CA174786, CA276568 (J.C.), UChicago Biological Sciences Division Pilot Project Award (J.C.), Sigal Fellowship in Immuno-oncology (H.F.), Cancer Center Support Grant (P30CA014599) (Integrated Light Microscopy Core at UChicago). We thank the Integrated Light Microscopy Core at UChicago for help with calcium imaging. We thank the UChicago Cytometry and Antibody Technology Core Facility for help with flow cytometry.
Footnotes
Competing interests: Authors declare that they have no competing interests.
References
- 1.Zheng S, Wang X, Zhao D, Liu H, Hu Y. Calcium homeostasis and cancer: insights from endoplasmic reticulum-centered organelle communications. Trends Cell Biol [Internet]. 2022; Available from: 10.1016/j.tcb.2022.07.004 [DOI] [PubMed] [Google Scholar]
- 2.Sehgal P, Szalai P, Olesen C, Praetorius HA, Nissen P, Christensen SB, et al. Inhibition of the sarco/endoplasmic reticulum (ER) Ca2+-ATPase by thapsigargin analogs induces cell death via ER Ca2+ depletion and the unfolded protein response. J Biol Chem. 2017;292:19656–73. [DOI] [PMC free article] [PubMed] [Google Scholar]
- 3.Preissler S, Rato C, Yan Y, Perera LA, Czako A, Ron D. Calcium depletion challenges endoplasmic reticulum proteostasis by destabilising BiP-substrate complexes. Elife [Internet]. 2020;9. Available from: 10.7554/eLife.62601 [DOI] [PMC free article] [PubMed] [Google Scholar]
- 4.Ibarra J, Elbanna YA, Kurylowicz K, Ciboddo M, Greenbaum HS, Arellano NS, et al. Type 1 but not type 2 calreticulin mutations activate the IRE1a/XBP1 pathway of the unfolded protein response to drive myeloproliferative neoplasms. Blood Cancer Discov [Internet]. 2022; Available from: 10.1158/2643-3230.BCD-21-0144 [DOI] [PMC free article] [PubMed] [Google Scholar]
- 5.Krebs J, Agellon LB, Michalak M. Ca(2+) homeostasis and endoplasmic reticulum (ER) stress: An integrated view of calcium signaling. Biochem Biophys Res Commun. 2015;460:114–21. [DOI] [PubMed] [Google Scholar]
- 6.Luo B, Lee AS. The critical roles of endoplasmic reticulum chaperones and unfolded protein response in tumorigenesis and anticancer therapies. Oncogene. 2013;32:805–18. [DOI] [PMC free article] [PubMed] [Google Scholar]
- 7.Bahar E, Kim H, Yoon H. ER Stress-Mediated Signaling: Action Potential and Ca(2+) as Key Players. Int J Mol Sci [Internet]. 2016;17. Available from: 10.3390/ijms17091558 [DOI] [PMC free article] [PubMed] [Google Scholar]
- 8.Monteith GR, Prevarskaya N, Roberts-Thomson SJ. The calcium-cancer signalling nexus. Nat Rev Cancer. 2017;17:367–80. [DOI] [PubMed] [Google Scholar]
- 9.Krebs J, Groenendyk J, Michalak M. Ca2+-signaling, alternative splicing and endoplasmic reticulum stress responses. Neurochem Res. 2011;36:1198–211. [DOI] [PubMed] [Google Scholar]
- 10.Marchi S, Giorgi C, Galluzzi L, Pinton P. Ca2+ Fluxes and Cancer. Mol Cell. 2020;78:1055–69. [DOI] [PubMed] [Google Scholar]
- 11.Marchi S, Pinton P. Alterations of calcium homeostasis in cancer cells. Curr Opin Pharmacol. 2016;29:1–6. [DOI] [PubMed] [Google Scholar]
- 12.Cui C, Merritt R, Fu L, Pan Z. Targeting calcium signaling in cancer therapy. Acta Pharm Sin B. 2017;7:3–17. [DOI] [PMC free article] [PubMed] [Google Scholar]
- 13.Bittremieux M, Parys JB, Pinton P, Bultynck G. ER functions of oncogenes and tumor suppressors: Modulators of intracellular Ca2+ signaling. Biochimica et Biophysica Acta (BBA) - Molecular Cell Research. 2016;1863:1364–78. [DOI] [PubMed] [Google Scholar]
- 14.Thomas NE, Edmiston SN, Alexander A, Groben PA, Parrish E, Kricker A, et al. Association Between NRAS and BRAF Mutational Status and Melanoma-Specific Survival Among Patients With Higher-Risk Primary Melanoma. JAMA Oncol. 2015;1:359–68. [DOI] [PMC free article] [PubMed] [Google Scholar]
- 15.Jakob JA, Bassett RL Jr, Ng CS, Curry JL, Joseph RW, Alvarado GC, et al. NRAS mutation status is an independent prognostic factor in metastatic melanoma. Cancer. 2012;118:4014–23. [DOI] [PMC free article] [PubMed] [Google Scholar]
- 16.Liszkay G, Mátrai Z, Czirbesz K, Jani N, Bencze E, Kenessey I. Predictive and Prognostic Value of BRAF and NRAS Mutation of 159 Sentinel Lymph Node Cases in Melanoma-A Retrospective Single-Institute Study. Cancers [Internet]. 2021;13. Available from: 10.3390/cancers13133302 [DOI] [PMC free article] [PubMed] [Google Scholar]
- 17.Devitt B, Liu W, Salemi R, Wolfe R, Kelly J, Tzen C-Y, et al. Clinical outcome and pathological features associated with NRAS mutation in cutaneous melanoma. Pigment Cell Melanoma Res. 2011;24:666–72. [DOI] [PubMed] [Google Scholar]
- 18.Bollag G, Tsai J, Zhang J, Zhang C, Ibrahim P, Nolop K, et al. Vemurafenib: the first drug approved for BRAF-mutant cancer. Nat Rev Drug Discov. 2012;11:873–86. [DOI] [PubMed] [Google Scholar]
- 19.Johnson DB, Sosman JA. Update on the targeted therapy of melanoma. Curr Treat Options Oncol. 2013;14:280–92. [DOI] [PMC free article] [PubMed] [Google Scholar]
- 20.Kang H-B, Fan J, Lin R, Elf S, Ji Q, Zhao L, et al. Metabolic Rewiring by Oncogenic BRAF V600E Links Ketogenesis Pathway to BRAF-MEK1 Signaling. Mol Cell. 2015;59:345–58. [DOI] [PMC free article] [PubMed] [Google Scholar]
- 21.Ando H, Mizutani A, Matsu-ura T, Mikoshiba K. IRBIT, a novel inositol 1,4,5-trisphosphate (IP3) receptor-binding protein, is released from the IP3 receptor upon IP3 binding to the receptor. J Biol Chem. 2003;278:10602–12. [DOI] [PubMed] [Google Scholar]
- 22.Devogelaere B, Sammels E, De Smedt H. The IRBIT domain adds new functions to the AHCY family. Bioessays. 2008;30:642–52. [DOI] [PubMed] [Google Scholar]
- 23.Ando H, Mizutani A, Kiefer H, Tsuzurugi D, Michikawa T, Mikoshiba K. IRBIT suppresses IP3 receptor activity by competing with IP3 for the common binding site on the IP3 receptor. Mol Cell. 2006;22:795–806. [DOI] [PubMed] [Google Scholar]
- 24.Devogelaere B, Nadif Kasri N, Derua R, Waelkens E, Callewaert G, Missiaen L, et al. Binding of IRBIT to the IP3 receptor: determinants and functional effects. Biochem Biophys Res Commun. 2006;343:49–56. [DOI] [PubMed] [Google Scholar]
- 25.Li X, Zhang M, Yu X, Xue M, Li X, Ma C, et al. AHCYL1 Is a Novel Biomarker for Predicting Prognosis and Immunotherapy Response in Colorectal Cancer. J Oncol. 2022;2022:5054324. [DOI] [PMC free article] [PubMed] [Google Scholar]
- 26.Shalem O, Sanjana NE, Hartenian E, Shi X, Scott DA, Mikkelson T, et al. Genome-scale CRISPR-Cas9 knockout screening in human cells. Science. 2014;343:84–7. [DOI] [PMC free article] [PubMed] [Google Scholar]
- 27.Sanjana NE, Shalem O, Zhang F. Improved vectors and genome-wide libraries for CRISPR screening. Nat Methods. 2014;11:783–4. [DOI] [PMC free article] [PubMed] [Google Scholar]
- 28.Doench JG, Fusi N, Sullender M, Hegde M, Vaimberg EW, Donovan KF, et al. Optimized sgRNA design to maximize activity and minimize off-target effects of CRISPR-Cas9. Nat Biotechnol. 2016;34:184–91. [DOI] [PMC free article] [PubMed] [Google Scholar]
- 29.Suzuki J, Kanemaru K, Ishii K, Ohkura M, Okubo Y, Iino M. Imaging intraorganellar Ca2+ at subcellular resolution using CEPIA. Nat Commun. 2014;5:4153. [DOI] [PMC free article] [PubMed] [Google Scholar]
- 30.Gao X, Liu Y, Li Y, Fan H, Wu R, Zhang R, et al. Lyso-PAF, a biologically inactive phospholipid, contributes to RAF1 activation. Mol Cell [Internet]. 2022. [cited 2022 May 8]; Available from: 10.1016/j.molcel.2022.03.026 [DOI] [PMC free article] [PubMed] [Google Scholar]
- 31.Ando H, Kawaai K, Mikoshiba K. IRBIT: a regulator of ion channels and ion transporters. Biochim Biophys Acta. 2014;1843:2195–204. [DOI] [PubMed] [Google Scholar]
- 32.Ando H, Mizutani A, Mikoshiba K. An IRBIT homologue lacks binding activity to inositol 1,4,5-trisphosphate receptor due to the unique N-terminal appendage. J Neurochem. 2009;109:539–50. [DOI] [PubMed] [Google Scholar]
- 33.Hetz C, Zhang K, Kaufman RJ. Mechanisms, regulation and functions of the unfolded protein response. Nat Rev Mol Cell Biol. 2020;21:421–38. [DOI] [PMC free article] [PubMed] [Google Scholar]
- 34.Sano R, Reed JC. ER stress-induced cell death mechanisms. Biochim Biophys Acta. 2013;1833:3460–70. [DOI] [PMC free article] [PubMed] [Google Scholar]
- 35.Zyryanova AF, Weis F, Faille A, Alard AA, Crespillo-Casado A, Sekine Y, et al. Binding of ISRIB reveals a regulatory site in the nucleotide exchange factor eIF2B. Science. 2018;359:1533–6. [DOI] [PMC free article] [PubMed] [Google Scholar]
- 36.Sidrauski C, McGeachy AM, Ingolia NT, Walter P. The small molecule ISRIB reverses the effects of eIF2α phosphorylation on translation and stress granule assembly. Elife [Internet]. 2015;4. Available from: 10.7554/eLife.05033 [DOI] [PMC free article] [PubMed] [Google Scholar]
- 37.Sidrauski C, Acosta-Alvear D, Khoutorsky A, Vedantham P, Hearn BR, Li H, et al. Pharmacological brake-release of mRNA translation enhances cognitive memory. Elife. 2013;2:e00498. [DOI] [PMC free article] [PubMed] [Google Scholar]
- 38.Costa-Mattioli M, Walter P. The integrated stress response: From mechanism to disease. Science [Internet]. 2020;368. Available from: 10.1126/science.aat5314 [DOI] [PMC free article] [PubMed] [Google Scholar]
- 39.Grandjean JMD, Wiseman RL. Small molecule strategies to harness the unfolded protein response: where do we go from here? J Biol Chem. 2020;295:15692–711. [DOI] [PMC free article] [PubMed] [Google Scholar]
- 40.Zeng M, Sang W, Chen S, Chen R, Zhang H, Xue F, et al. 4-PBA inhibits LPS-induced inflammation through regulating ER stress and autophagy in acute lung injury models. Toxicol Lett. 2017;271:26–37. [DOI] [PubMed] [Google Scholar]
- 41.Xie F, Li BX, Kassenbrock A, Xue C, Wang X, Qian DZ, et al. Identification of a Potent Inhibitor of CREB-Mediated Gene Transcription with Efficacious in Vivo Anticancer Activity. J Med Chem. 2015;58:5075–87. [DOI] [PMC free article] [PubMed] [Google Scholar]
- 42.Papassava P, Gorgoulis VG, Papaevangeliou D, Vlahopoulos S, van Dam H, Zoumpourlis V. Overexpression of activating transcription factor-2 is required for tumor growth and progression in mouse skin tumors. Cancer Res. 2004;64:8573–84. [DOI] [PubMed] [Google Scholar]
- 43.Lopez-Bergami P, Lau E, Ronai Z. Emerging roles of ATF2 and the dynamic AP1 network in cancer. Nat Rev Cancer. 2010;10:65–76. [DOI] [PMC free article] [PubMed] [Google Scholar]
- 44.Fritz V, Malek L, Gaza A, Wormser L, Appel M, Kremer AE, et al. Combined De-Repression of Chemoresistance Associated Mitogen-Activated Protein Kinase 14 and Activating Transcription Factor 2 by Loss of microRNA-622 in Hepatocellular Carcinoma. Cancers [Internet]. 2021;13. Available from: 10.3390/cancers13051183 [DOI] [PMC free article] [PubMed] [Google Scholar]
- 45.Lau E, Ronai ZA. ATF2 - at the crossroad of nuclear and cytosolic functions. J Cell Sci. 2012;125:2815–24. [DOI] [PMC free article] [PubMed] [Google Scholar]
- 46.Wan Z, Liu T, Wang L, Wang R, Zhang H. MicroRNA-216a-3p promotes sorafenib sensitivity in hepatocellular carcinoma by downregulating MAPK14 expression. Aging . 2020;12:18192–208. [DOI] [PMC free article] [PubMed] [Google Scholar]
- 47.Moore AR, Rosenberg SC, McCormick F, Malek S. RAS-targeted therapies: is the undruggable drugged? Nat Rev Drug Discov. 2020;19:533–52. [DOI] [PMC free article] [PubMed] [Google Scholar]
- 48.Ryan CJ, Mehta I, Kebabci N, Adams DJ. Targeting synthetic lethal paralogs in cancer. Trends Cancer Res. 2023;9:397–409. [DOI] [PubMed] [Google Scholar]
- 49.Huang A, Garraway LA, Ashworth A, Weber B. Synthetic lethality as an engine for cancer drug target discovery. Nat Rev Drug Discov. 2020;19:23–38. [DOI] [PubMed] [Google Scholar]
- 50.Esteves GNN, Ferraz LS, Alvarez MMP, Costa CA da, Lopes R de M, Tersariol ILDS, et al. BRAF and NRAS mutated melanoma: Different Ca2+ responses, Na+/Ca2+ exchanger expression, and sensitivity to inhibitors. Cell Calcium. 2020;90:102241. [DOI] [PubMed] [Google Scholar]
- 51.Pua LJW, Mai C-W, Chung FF-L, Khoo AS-B, Leong C-O, Lim W-M, et al. Functional Roles of JNK and p38 MAPK Signaling in Nasopharyngeal Carcinoma. Int J Mol Sci [Internet]. 2022;23. Available from: 10.3390/ijms23031108 [DOI] [PMC free article] [PubMed] [Google Scholar]
- 52.Xia S, Lin R, Jin L, Zhao L, Kang H-B, Pan Y, et al. Prevention of Dietary-Fat-Fueled Ketogenesis Attenuates BRAF V600E Tumor Growth. Cell Metab. 2017;25:358–73. [DOI] [PMC free article] [PubMed] [Google Scholar]
- 53.Zhao L, Fan J, Xia S, Pan Y, Liu S, Qian G, et al. HMG-CoA synthase 1 is a synthetic lethal partner of BRAFV600E in human cancers. J Biol Chem. 2017;292:10142–52. [DOI] [PMC free article] [PubMed] [Google Scholar]
- 54.Lin R, Xia S, Shan C, Chen D, Liu Y, Gao X, et al. The Dietary Supplement Chondroitin-4-Sulfate Exhibits Oncogene-Specific Pro-tumor Effects on BRAF V600E Melanoma Cells. Mol Cell. 2018;69:923–937.e8. [DOI] [PMC free article] [PubMed] [Google Scholar]
- 55.Min H-Y, Lee H-Y. Oncogene-Driven Metabolic Alterations in Cancer. Biomol Ther . 2018;26:45–56. [DOI] [PMC free article] [PubMed] [Google Scholar]
- 56.Tarrado-Castellarnau M, de Atauri P, Cascante M. Oncogenic regulation of tumor metabolic reprogramming. Oncotarget. 2016;7:62726–53. [DOI] [PMC free article] [PubMed] [Google Scholar]
- 57.Hanahan D Hallmarks of Cancer: New Dimensions. Cancer Discov. 2022;12:31–46. [DOI] [PubMed] [Google Scholar]
Associated Data
This section collects any data citations, data availability statements, or supplementary materials included in this article.
Supplementary Materials
Data Availability Statement
The data generated in this study will be publicly available in Gene Expression Omnibus (GEO) upon publication. For RNA-seq deposit, accession number is: GSE253246. The data generated in this study are available within the article and its supplementary data files. The data generated in this study are available upon request from the corresponding author Jing Chen (jingchen@bsd.uchicago.edu).